HAL Id: hal-01709512
https://hal.archives-ouvertes.fr/hal-01709512
Submitted on 15 Feb 2019
HAL is a multi-disciplinary open access
archive for the deposit and dissemination of
sci-entific research documents, whether they are
pub-lished or not. The documents may come from
teaching and research institutions in France or
abroad, or from public or private research centers.
L’archive ouverte pluridisciplinaire HAL, est
destinée au dépôt et à la diffusion de documents
scientifiques de niveau recherche, publiés ou non,
émanant des établissements d’enseignement et de
recherche français ou étrangers, des laboratoires
publics ou privés.
Modelling of infrared heating of thermoplastic sheet
used in thermoforming process
Fabrice Schmidt, Yannick Le Maoult, S Monteix
To cite this version:
Fabrice Schmidt, Yannick Le Maoult, S Monteix. Modelling of infrared heating of thermoplastic sheet
used in thermoforming process. Journal of Materials Processing Technology, Elsevier, 2003, 143 (SI),
pp.225-231. �10.1016/S0924-0136(03)00291-7�. �hal-01709512�
Modelling of infrared heating of thermoplastic sheet used in
thermoforming process
F.M. Schmidt
a,∗, Y. Le Maoult
a, S. Monteix
baEcole des Mines d’Albi-Carmaux, Route de Teillet, 81013 ALBI CT Cedex 09, France bSanpellegrino (Nestlé Company), Via Valsugana 5, 35010 S. Giorgio in Bosco, PD, Italy
Abstract
Thermoforming consists of warming a plastic sheet and forming it into a cavity or over a tool using vacuum, air pressure and mechanical means. The process begins by heating a thermoplastic sheet slightly above the glass transition temperature, for amorphous polymers, or slightly below the melting point, for semi-crystalline materials. As the final thickness distribution of the part is drastically controlled by the initial temperature distribution inside the sheet, it is very important to optimise the heating stage. In most of the thermoforming machine, this step is performed using an infrared oven constituted of long waves infrared emitters. The goal of this study is to determine the efficiency of short waves infrared emitters (halogen lamps) for the heating step. The infrared heating of thermoplastic sheets will be modelled following two steps: an experimental set-up developed in our laboratory permits to measure the influence of parameters such as heaters temperature, incidence of the radiation, heat transfer coefficient, etc. An 880 LW AGEMA infrared camera is used to evaluate the surface distribution of the transmitted heat flux by measuring the temperature distribution on the surface of the thermoplastic sheet. In addition, a numerical model using control volume method (software called PLASTIRAD) has been developed to simulate the heating stage. In particular, it takes into account the spectral properties of both heaters and plastic sheet as well as the heaters directivity. Comparisons between experimental data and numerical simulations allow validating the numerical model using different types of emitters and polystyrene (PS).
Keywords: Thermoforming process; Polystyrene; Halogen lamps; Surface temperature measurement; Infrared camera; Control volume method
1. Introduction
In Fig. 1, the plug-assisted thermoforming process is sketched. The heating zone is constituted of upper and lower rows of infrared emitters, which are used to warm the plastic sheet prior to forming[1,2].
In most of the thermoforming machines, the heating step is performed using an infrared oven constituted of long waves infrared emitters (3–5 !m spectral bandwidth). The goal of this study is to determine the efficiency of short waves infrared emitters (halogen lamps) for the heating step (0.76–2 !m spectral bandwidth) in the thermoforming pro-cess. For the purpose, a representative polymer of the ther-moforming process has been chosen, i.e. the polystyrene (PS). According to Jammet[3], this polymer represents 49% of the entire thermoformed polymers. Then, comparisons will be made upon energetic criterion between three dif-ferent emitters: long waves infrared emitters (ELSTEIN),
∗Corresponding author. Tel.:+33-563-49-6089; fax: +33-563-49-3242. E-mail address: [email protected] (F.M. Schmidt).
average waves infrared emitters (TQS) and halogen lamps (PHILIPS).
2. Experimental set-up
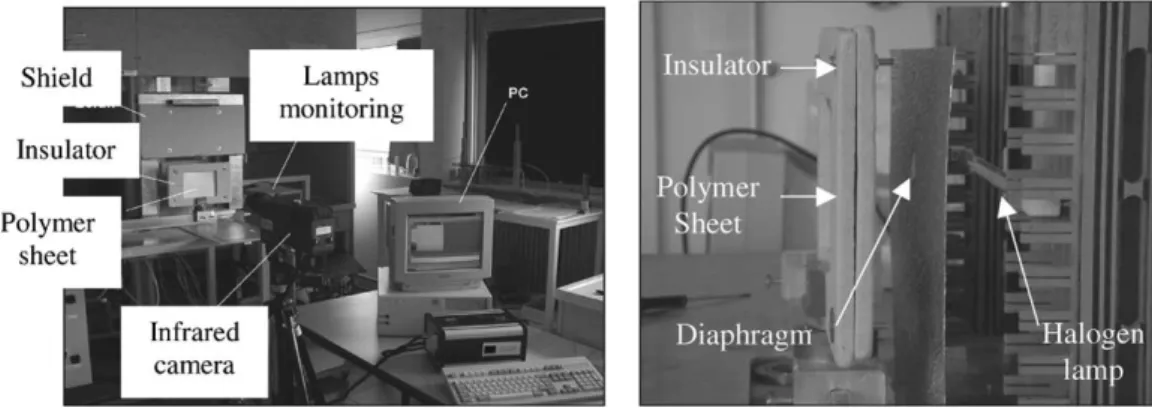
Fig. 2 shows the experimental set-up, which has been developed in order to measure the surface temperature evo-lution when a white PS sheet is heating using an infrared lamp (one or more if necessary). The polystyrene sheet is mounted in an isolating frame. The surface dimension of the sheet is 135 mm× 100 mm and the thickness is 1.63 mm. An 880 LW AGEMA I.R. camera (8–12 !m bandwidth) is used to evaluate the surface distribution of the transmit-ted heat flux by measuring the temperature distribution on the back surface of the sheet. The frequency of analysis is 25 frames/s and the device is connected to a 12 bit data acquisition board drive with a real time software. The exper-imental set-up allows for monitoring the transient surface temperature distribution. An aluminium polish sheet with an aperture (diaphragm) can be placed between the polystyrene sheet and the lamp in order to insure a constant view factor between the different lamps and the polymer sheet.
Fig. 1. Plug-assisted thermoforming process.
Fig. 2. Experimental set-up overview. Side view of the infrared oven.
2.1. Heat source characterisation
The halogen lamps used in the infrared oven (PHILIPS 900 W) are composed of a coiled tungsten filament (length: 300 mm), contained in a quartz tubular enclosure (diameter: 10 mm) filled with a neutral gas (Argon) and coated on its back with a ceramic reflector in order to increase the heat flux received by the product. This lamp as well as the EL-STEIN and the TQS lamps are presented inFig. 3. Spectral properties of these elements have already been measured in previous works[4,5]. Using these data, the tungsten filament and quartz tube temperatures are calculated using a net ra-diation method[6]:
P− εFil(TFil)SFilσTFil4 − 2πLQkArgon(T∗)
TFil− TQ ln(dQ/dFil) = 0,
αQ(TFil)εFil(TFil)SFilσTFil4 + 2πLQkArgon(T∗)
TFil− TQ ln(dQ/dFil) − εQSQσTQ4− hSQ(TQ− T∞)= 0 (1) where P is the electrical power of the lamps; the indices Fil and Q refer, respectively, to the filament and the quartz tube,
T the temperature, L the length of the lamp, d the filament
or the quartz tube diameter, ε, α the emissivity and absorp-tivity. T∗ is assumed to be equal to (TFil+ TQ)/2. We have simplified this model by computing directly total parame-ters instead of spectral ones (as emissivity and absorptiv-ity) with polynomial functions depending on temperatures
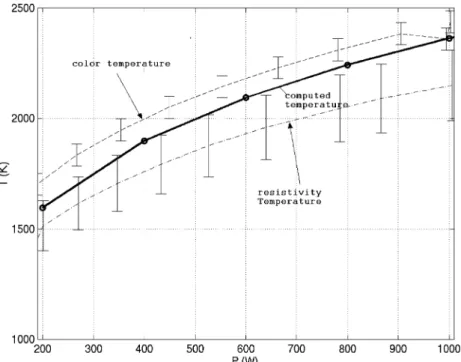
which is easier and saves time. The temperatures of the fila-ment and the quartz tube are computed at steady state using a Newton–Raphson method. The results of this computa-tion are shown in Fig. 4. Additional curves are plotted on the same graph, they are related to experimental measure-ments: colour temperature of the filament and temperature
Fig. 4. Filament temperature vs. electrical power.
computed with a resistivity method. At the nominal power of 1 kW, the values are given inTable 1.
As shown inFig. 4, the discrepancy between the extreme curves is high: greater than 100 K around 2350 K. This fact is due to the lack of knowledge on the properties of this particular kind of tungsten (coiled filament). On the other hand, “colour” temperature remains difficult to measure at such level of power. In order to conclude, we have chosen the computed temperature as a “mean” temperature, lower and upper limits of the temperature, at 1 kW, will be considered as the global uncertainty.
Using experimental set-up described in [4,5], the effi-ciency factor of the ceramic reflector has been measured: kr(θ, Tr)=
Φr(θ, Tr)
Φw(θ, Tr) (2) The index r and w refer, respectively, to the lamp with a ce-ramic reflector and without reflector. The angle θ covered by a detector around the heater and Tr the temperature of the reflector. This value is obtained using a thermopile detector with a large spectral bandwidth [0.25, 26] !m. The output signal delivered by the thermopile is related to the flux emit-ted by the lamp, so the ratio of the two fluxes measured by the detector and introduced in (2) gives the efficiency of the coating. We have checked that this efficiency is unaffected by the variation of the temperature of the filament and that
Table 1
Filament and quartz temperatures
Filament temperature (K) Quartz temperature (K)
2360 730
the emission of the lamp is quasi isotropic. Therefore, we have obtained
kr= 1.36 ± 0.02 (3)
2.2. PS spectral properties characterisation
Spectra data will be used as a database in the numerical simulation (seeSection 3) as well as for the surface temper-ature distribution measurements. In the litertemper-ature, we found few papers referring to polystyrene spectral properties mea-surements[7,8]. 1.63 mm white PS sheets were processed by extrusion moulding. In addition, the previous thick sheets were polished in order to obtain samples of 0.07 mm thick-ness. Then, we have proceeded to spectral properties mea-surements (transmitivity, reflectivity) using a Perkin-Elmer FT-IR spectrometer. We have found that the polymer is opaque for wavelengths in the range of 8–12 !m with an in-tegrated emissivity of 0.95. This bandwidth corresponds to the one of the infrared camera. InFig. 5, the PS absorbtivity αλis plotted versus wavelength both for the 1.63 mm sheet (a) and the 0.07 mm thin film (b).
3. Numerical modelling
3D control-volume software, called PLASTIRAD, has been developed in order to compute heat transfer during the infrared-heating step. The sheet is meshed using cubic or hexahedral elements so-called control volumes[9]. The temperature balance equation including radiant heat transfer (thermal power absorbed by the semitransparent PS sheet
Fig. 5. Absorptivity vs. wavelength.
and radiated from halogen lamps) is integrated over each control volume and over the time from t to t+ (t
! (t ! Ωe ρcp ∂T ∂tdΩ dt = − ! (t ! Γe (⃗qc· ⃗n) dΓ dt + ! (t ! Γe (⃗qr· ⃗n) dΓ dt (4)
where Ωeis the control volume, qcand qrare the Fourier’s conductive and the radiated fluxes, respectively. The un-known temperatures are computed at the cell centres of the elements. The specific lamp geometry is also consid-ered, taken into account from a view factor computation. In our model, we assume a constant filament temperature and then a uniform source temperature. Thus the amount of radiation, reaching each front elements of the irradiated
sheet, is performed with the contour method using Stokes theorem[10]: FH→p= 1 2πSH " ΓH ! Γrp ln r· d⃗rH· d⃗rrp (5)
where the subscripts H refers to the heater and p to the sheet front element under consideration, r is the distance between two elemental linear elements, issued from meshing the entire heater boundary ΓH and Γrp for each surface of
control element’s boundary reaching the irradiated sheet’s face. This contour method integration was chosen between different numerical view factor methods (Monte Carlo or geometrical method). This method allows a good accuracy with a very low computational time. An efficient numerical method based on Gaussian quadrature has been applied in order to perform the contour integration. The computation of
the amount of incident radiation, for each surface element, is given inEq. (6): Φ(rp)= krFH→rp SH Srp ! (λ ελ(TFil)πL0λ(TFil)dλ (6)
where ελ is the spectral tungsten emissivity, TFil the fila-ment temperature, L0λ the blackbody intensity, λ a given wavelength between [0.2, 10] !m and krthe efficiency fac-tor of the ceramic reflecfac-tor. In a first approximation, internal radiant heat transfer is assumed mono-dimensional across the sheet thickness. The PS bulk temperature (≤450 K) is very low in comparison to the source temperature (TFil > 2000 K). Therefore, the assumption of cold material is con-venient. This leads to express the transmitted flux across the thickness of the material, for an homogenous and amor-phous PS, using the Beer–Lambert’s law, if the coordinate y describe the thickness, we have, in a simple way, for the flux Φλ(y)= Φλ(y= 0) e−kλy (7) where kris the spectral absorption coefficient of our material.
4. Discussion
4.1. Model assessment
First of all, we proceed to a heating step of a white PS sheet during 70 s using one halogen lamp. The distance between the lamp and the sheet is 50 mm. It is to be noted that in this case, the diaphragm is not taken into account. The dimensions of the sheet are the same as in Section 2. The sheet is meshed using 2250 linear cubic elements (15× 15 × 10). Fig. 6 shows characteristic back surface temperature distribution obtained by numerical simulation (a) and by experimental measurement (b). We obtained a qualitative agreement. More interesting is the temperature variation along the width and the height of the sheet from a cross-point located on the centre of the sheet (seeFig. 6a). The maximum relative error for the temperature distribution
Fig. 6. Back surface temperature distribution. Table 2
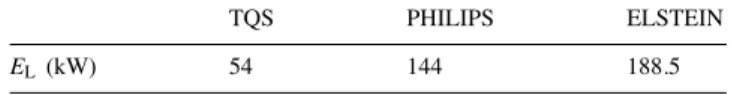
Energy consumed by each lamp
TQS PHILIPS ELSTEIN
EL (kW) 54 144 188.5
Table 3
Energy consumed by each lamp
TQS PHILIPS ELSTEIN
EL (kW) 54 49.5 188.5
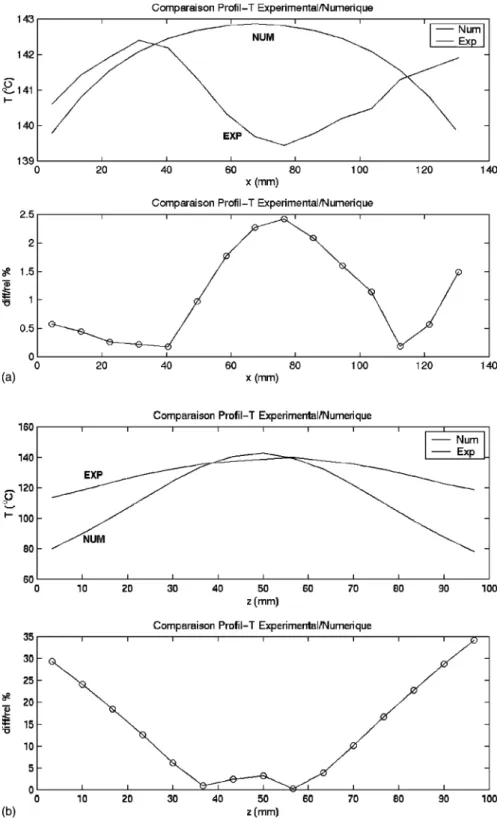
along width (Fig. 7a) is 2.5%. In this case, the agreement is fair. Moreover, the relative error in the case of the tem-perature distribution along height (Fig. 7b) increases from 4% at the sheet centre up to 35% at the sheet border. This discrepancy is due to the mono-dimensional absorption assumption in our model (seeSection 3).
4.2. Comparison between different emitters
In this section, we compare three different emitters: a long wave infrared emitter (ELSTEIN 650 W), an average wave infrared emitter (TQS 600 W) and a halogen lamps (PHILIPS 900 W) previously introduced inSection 2.
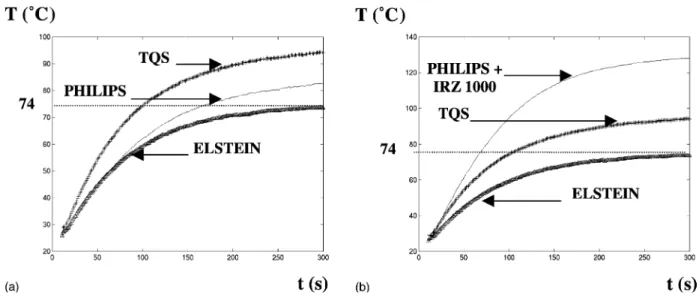
We proceed to a heating step of 290 s for each emitter using the experimental set-up described inSection 2. This is the duration for the less efficient infrared emitter to achieve a maximum temperature of 74◦C. The aluminium polish sheet with an aperture (diaphragm) is placed between the polystyrene sheet and the lamp in order to avoid geometric effect. Then, the temperature evolution is recorded versus time at the sheet centre using the infrared camera (seeFig. 8). Then, we calculate a simple energetic criterion
EL= PL× tL (8)
where EL is the approximated energy consumed by each lamp, tLthe time required for each lamp to achieve the less efficient infrared emitter maximum temperature, and PLthe
Fig. 7. Numerical and experimental temperature distribution along width (a) and along height (b).
electrical power of each lamp. If we appliedEq. (8)to the curves ofFig. 8a, we obtain the values refereed inTable 2. According to the criterion (Eq. (8)), the energy efficiency of the halogen lamp is better than the long waves infrared emitters (i.e. ELSTEIN lamp). In addition, the PHILIPS lamp efficiency should be improved in comparison to that of the TQS lamp. For that, an aluminium reflector (IRZ 1000)
has been placed in the back of the halogen lamp in order to increase radiant heat flux. InFig. 8b, the temperature evolu-tions of the different lamps are plotted versus time. Again, we calculate the energy consumed by each lamp (Table 3). Due to the presence of the aluminium reflector, the halo-gen lamp has now the best energy efficiency (i.e. lower en-ergy consumed).
Fig. 8. Recorded temperature vs. time at the sheet centre.
5. Conclusion
An experimental set-up has been developed in order to measure the back surface temperature distribution of a polystyrene sheet using an infrared camera and has permit-ted to compare the energy efficiency of three different emit-ters (TQS, ELSTEIN, PHILIPS). The comparisons, based upon a simple energetic criterion, allow demonstrating that the halogen lamp has the best energy efficiency. These pre-liminary results will be further improved and extended to other polymers, and particularly to polypropylene (PP).
A 3D numerical model using control volume method has been developed to simulate the heating stage and then vali-dated by comparisons with experimental data. This numer-ical model has to be improved in order to take into account the transmitted flux across the thickness without geometric assumptions (i.e. Beer–Lambert mono-dimensional law).
Acknowledgements
PHILIPS LIGHTING and EDF-RENARDIERE Compa-nies support this work. Special thanks go to R. Anbari for his help on the experiments.
References
[1] A. Illig, Pratique du thermoformage (in French), HERMES Science Publications, Paris, 1999, pp. 151–184.
[2] J.L. Throne, in: Two-Day Seminar on Thermoforming Pro-cess and Design, Basel, Switzerland, Technomic Publisging AG, 1998.
[3] J.-C. Jammet, Thermoformage, Techniques de l’ingénieur (in French), vol. AM3, AM3660, 1997.
[4] S. Monteix, F. Schmidt, Y. Le Maoult, in: Experimental Study and Numerical Simulation of Sheet and Tubular Preform Infrared Heating, QIRT 2000, Eurotherm Seminar No. 64, Reims, France, 2000.
[5] S. Monteix, F. Schmidt, Y. Le Maoult, G. Denis, M. Vigny, in: Recent Issues in Preform Radiative Heating Modelling, PPS 2001, Montreal, 2001.
[6] M. Petterson, Heat transfer and energy efficiency in infrared papers dryers, Ph.D. Thesis, Lund University, Sweden, 1999.
[7] K. Esser, E. Haberstroh, U. Hüsgen, D. Weinand, Infrared radiation in the processing of plastics: precise adjustment—the key to produc-tivity, Adv. Polym. Technol. 7 (1987) 89–128.
[8] T. Miyanaga, Y. Nakano, Analysis of Infrared Radiation Heating of Plastics, Central Research Institute of Electric Power Industry, Tokyo, Japan, 1990.
[9] S.V. Patankar, Numerical Heat Transfer and Fluid Flow, McGraw-Hill, New York, 1980.
[10] R. Rammohan, Efficient evaluation of diffuse view factors for radi-ation, Int. J. Heat Mass Transf. 39 (6) (1996) 1281–1286.