HAL Id: hal-00843365
https://hal-imt.archives-ouvertes.fr/hal-00843365
Submitted on 11 Jul 2013
HAL is a multi-disciplinary open access
archive for the deposit and dissemination of
sci-entific research documents, whether they are
pub-lished or not. The documents may come from
teaching and research institutions in France or
abroad, or from public or private research centers.
L’archive ouverte pluridisciplinaire HAL, est
destinée au dépôt et à la diffusion de documents
scientifiques de niveau recherche, publiés ou non,
émanant des établissements d’enseignement et de
recherche français ou étrangers, des laboratoires
publics ou privés.
Dual energy CT-based characterization of x-ray
attenuation properties of breast equivalent material
plates
N. Geeraert, Rémy Klausz, Philippe Guidici, S. Muller, Lesley Cockmartin, H.
Bosmans
To cite this version:
N. Geeraert, Rémy Klausz, Philippe Guidici, S. Muller, Lesley Cockmartin, et al.. Dual energy
CT-based characterization of x-ray attenuation properties of breast equivalent material plates. SPIE
Medical Imaging, Feb 2012, San Diego, United States. pp.178. �hal-00843365�
Dual energy CT-based characterization of x-ray attenuation properties
of breast equivalent material plates
N.Geeraert
1,2, R.Klausz
1, P. Giudici
1, S. Muller
1, L.Cockmartin
2, H.Bosmans
31
GE Healthcare, Buc, France
2
Katholieke Universiteit Leuven, Belgium
3
UZ Leuven, Belgium
ABSTRACT
Breast density is more and more considered as an important risk factor for breast cancer and several quantitative breast density evaluation methods have been proposed. The reference material for simulation of the breast attenuation proper-ties of glandular and adipose breast tissues is manufactured by a single provider. In order to characterize the attenuation properties of these materials, measurements in Hounsfield Units (HU) have been performed using a CT-scanner. Breast-equivalent plates have been imaged in different configurations (plates in and orthogonal to image planes), providing consistent results (+ 1.3 HU). Breast density equivalent plates of different nominal breast density equivalences and sizes were measured, demonstrating both a good homogeneity within the plates (+ 1.8 HU) and a good consistency between plates of the same nominal breast density equivalence (+ 1.5 HU). In addition, dual energy CT provided mono-energetic HU from which mono-energetic linear attenuation coefficients of water and glandular and adipose equivalent materials were computed. The values for these coefficients were found in good agreement with results from literature, respectively direct mono-energetic measurements of breast samples, and computation by combining published breast tissue atomic compositions and linear attenuation coefficient tables. In conclusion, CT was found effective for the verification of the breast equivalent material, and the homogeneity and consistency of the plates were found satisfactory. Furthermore, the most recent spectral CT technology allowed demonstrating a good agreement of the attenuation properties of breast-equivalent material plates with state-of-the-art knowledge of real breast tissue attenuation.
Keywords: breast equivalent material, breast density, attenuation properties, linear attenuation coefficients, dual energy CT
DESCRIPTION OF PURPOSE
Breast cancer is the second cause of cancer and first cause of mortality from cancer for women [1] . Breast cancer screen-ing programs, by means of mammographic imagscreen-ing, are set up to detect breast cancer at an early stage to improve treat-ment effectiveness [2] . Breast density has been found an important inherent risk factor for breast cancer [3] . This was mainly based on surfacic breast density (ratio of surface of fibroglandular tissue in the image to total surface of the breast in the image). In order to improve accuracy of density estimations, methods have been proposed to estimate volumetric breast density (ratio of volume of the fibroglandular tissue to the total volume of the breast) from mammographic imag-es. Those methods [4] , [5] , [6] have been based on calibrations using a breast equivalent material available from a single manufacturer following the method of White [7] and Fatouros [8] (CIRS Inc., Norfolk, VA). Consequently this breast equivalent material is the cornerstone for estimating breast densities from mammographic X-ray imaging. A fundamental requirement for the phantom material is the close match in attenuation properties between phantom material and real breast tissue in the energy domain of mammography (i.e. 15 keV to 30 keV). The material should in addition allow
sistent measurements within the samples (homogeneity) and from sample to sample of the same nominal glandular con-tent (consistency).
From another point of view, all breast density assessment methods should be validated on patients against available im-aging modalities capable to identify the different tissues and with the possibility to measure the volume of the breast and fibroglandular tissue. CT is a 3-dimensional imaging modality with a good geometric accuracy. It can effectively distin-guish fibroglandular tissue from adipose tissue, based on attenuation characteristics of both tissues and with the possibil-ity to quantify volumes, which makes it a good candidate for the validation of breast denspossibil-ity quantification methods [9] . Therefore it is of particular interest to double check the properties of the calibration phantoms using CT as well.
The capability of CT to measure the attenuation properties of the breast equivalent phantoms must first be verified and the accuracy must be determined. In particular, since the breast equivalent material generally used in mammography is available under the form of rectangular plates, the influence of the shape and configuration of these plates has to be stud-ied. The measurements of Hounsfield Units (HU) within the plates can then be used to assess the homogeneity of attenu-ation properties and their consistency between different plates of the same nominal breast density equivalence. The line-arity of HU to the nominal breast density equivalence can be plotted. Finally linear attenuation coefficients can be de-rived from the mono-energetic HU provided by dual-energy CT as described by Wu [9] and used by Van Gompel [11] and Zhang [12] . The results for these coefficients are compared with values from literature [13] ,[14] .
METHODS
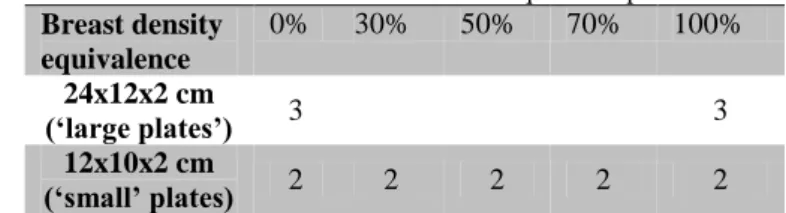
The number of breast equivalent material plates used for our analysis, is listed in Table 1.
The plates were imaged using a GE Discovery CT750 (GE Healthcare, Chalfont, UK) with the dual energy option (GSI), in helical mode for different configura-tions as summarized in Table 2 and shown in Figure 1
The images were analyzed using the measuring tools of the GSI viewer.
The plates were stacked together and were oriented either parallel or orthogonal to the image planes. Configuration 1 and 2 used a combination of the ten small plates and four large plates. Configuration 3 and 4 used six and four large plates respectively. The small plates were oriented parallel to the image planes in configuration 1 and orthogonal in configura-tion 2. The large plates were oriented orthogonal to the image planes in all configuraconfigura-tions.
Table 2: Configurations imaged with dual energy CT in helical mode at 140 kVp
Configuration # 1 2 3 4
Orientation to image In plane Orthogonal to plane Orthogonal to plane Orthogonal to plane
Environment Air Air Air Water(cylinder)
Plates Ten small
Four large
Ten small
Four large Six large Four large
Bowtie filter Medium Medium Body Medium
Slice thickness 1.25 mm 2.5 mm 2.5 mm 1.25 mm
Spacing between slices 2.0 mm 2.0 mm 2.5 mm 2.5 mm
Convolution kernel Standard Soft Soft Soft
Measured with QC-image
(140 kV) QC-image (140 kV) QC-image (140 kV) QC-image (140kV) and MONO-image (40 keV – 140 keV)
Table 1: Number of available breast equivalent plates.
Breast density equivalence 0% 30% 50% 70% 100% 24x12x2 cm (‘large plates’) 3 3 12x10x2 cm (‘small’ plates) 2 2 2 2 2
The purpose of these choices was to verify whether the consistency of the HU is guaranteed for a variety of geometries. In configuration 1 one image plane displayed only one plate, so measurements in the same ROI in consecutive image planes allowed comparing HU of plates with different nominal breast density equivalences.
In configuration 2 each plate was displayed in the whole stack of images, so homogeneity of the plates could be verified by measuring in the same ROI in consecutive image planes.
We wanted to investigate the influence of the shape of the configuration and of the surrounding material. There-fore in configuration 4 the plates were placed in an AAPM cylindrical CT QC phantom holder that was filled with water. This allowed us to check the homoge-neity of the plates in comparison with a homogeneous material. In configuration 3 all plates (alternating 0% and 100% breast density equivalence) were placed in a stack. Consequently the configurations were used for different tests: consistency of HU for configuration 1 and 2, the homogeneity of large plates in configuration 4, the con-sistency between plates of equal nominal breast density equivalence in all configurations, the linearity of HU to nominal breast density equivalence in configuration 1and the linear attenuation coefficients in configuration 4.
Images of configurations 1, 2 and 3 were QC CT-images (140 kV) corresponding to the high energy acquisition of the dual energy mode. Images of configuration 4 were used in both QC CT-images (140 kV) and mono-energetic (40 keV – 140 keV) images reconstructed from the dual energy mode.
In the center of each small plate (configuration 1 and 2) a physical cubic volume (1x1x1cm3) was defined. The average HU for these volumes were computed by averaging the ROIs from corresponding image planes for configuration 1 and 2. The difference of average HU of the physical positions in the phantoms that had been scanned with different orientation showed the influence of the orientation of the plates. If the average HU for the volumes in configuration 1 and 2 are not significantly different, it was assumed that the CT measurements are consistent with regard to orientation.
Homogeneity within the plates was checked for the large plates in configuration 4 by measuring the average HU along the imaged sequence in ROIs in the center and on the sides of each plate as seen in the 177 image planes, and computing the standard deviation over these averages. The water around the plates was homogeneous and thus a measure for the accuracy of the measurement.
The consistency between plates of the same nominal breast density equivalence was verified in configuration 3. The average HU were measured for all large plates in the ROIs in the center of the plates in all 39 image planes. The standard deviation was taken from the ROIs per plate. We compared HU and standard deviation of the three adipose equivalent plates and the three fibroglandular equivalent plates.
The linearity of the HU of the small plates was checked against nominal breast density equivalence in configuration 1. The HU were measured in the ROIs in the center of each plate, since a good plane to plane reproducibility was found
from the homogeneity measurements for water. The respective HU were plotted as function of nominal glandular con-tent. The expected result is
(
)
( )
with HUG the HU of a plate with nominal breast density equivalence G expressed in % and HUGl and HUF the HU for the
100% and 0% breast density equivalent plates respectively.
The linear attenuation coefficients were computed in the mono-energetic images from configuration 4 generated by the GSI dual energy function. The water around the plates allowed to accurately calibrate the HU measured in the plates. The average HU and the standard deviations within the ROIs in the center of the different plates and in the water next to the plates were computed per keV between 40 keV and 140 keV [11] ,[12] .
From these mono-energetic HU the linear attenuation coefficient were computed using
(
)
( )
with µG the linear attenuation coefficient of the material and HUG the average mono-energetic HU of the ROI. The
val-ues for µwater and µair were taken from the NIST tables [15]
RESULTS
The differences between configuration 1 and 2 for the eight middle volumes varied between 0.1 and 1.3 HU and were compared to an average standard deviation of 4 HU within the ROIs constituent of a volume and an standard deviation of 1 HU over the mean values of these ROIs. The contribution of the orientation to the difference was therefore not signifi-cant. The two outer plates of the stack of small plates differed between the configurations 1 and 2 by 4.1 and 6.0 HU. Therefore these plates were not considered.
The standard deviations over the ROIs respectively in water and in the plates in configuration 4 were comparable (0.6 in water, 0.7 and 0.7 in the two fibroglandular equivalent plates and 0.8 and 0.6 in the two adipose equivalent plates). Since the variations from ROI to ROI were not significantly different from the variations within water, the plates can be con-sidered homogeneous. Some more important local deviations were observed in some image planes (maximum difference to average value of 1.5 HU within water, 2.0 HU and 2.1 HU in fibroglandular equivalent plates and 2.4 HU and 5.5 HU in the two adipose equivalent plates respectively), but do not contradict the homogeneity assessment since they are local and of moderate amplitude.
The standard deviations over the ROIs of the same nominal breast density equivalence in configuration 3, neglecting the two outer plates, were 1.5 HU (fibroglandular) and 1.7 HU (adipose). Maximum differences versus the average values of the plates were 3.2 HU (glandular) and 2.9 HU (adipose). The average nominal breast density equivalence of 0% and 100% were respectively -67 HU and 55 HU.
The measurements of the HU in the small plates in configuration 1 were plotted against their nominal breast density equivalence (0%, 30%, 50%, 70% and 100%) in Figure 2. The HU were measured in the center of the plate in 157 con-secutive slices in total. The deviating values for 0% and 100% nominal breast density equivalence came from the outer plates, where the consistency of the CT measurement is not guaranteed (see above). A least square fit showed the good linear correlation between the nominal breast density equivalence and the HU as expected from equation 1 (R² = 0.989).
Table 3:Average HU per plate with all ROIs taken in the plates (center and sides) with FG = Fibroglandular and Ad = Adipose
Configuration #
1
2
3
4
FG a
-
-
58
-
FG b
56
49
58
61
FG c
56
50
49
62
FG small
55
47
-
-
Ad a
-86
-79
-68
-
Ad b
-85
-80
-66
-80
Ad c
-
-
-68
-79
Ad small
-89
-79
-
-
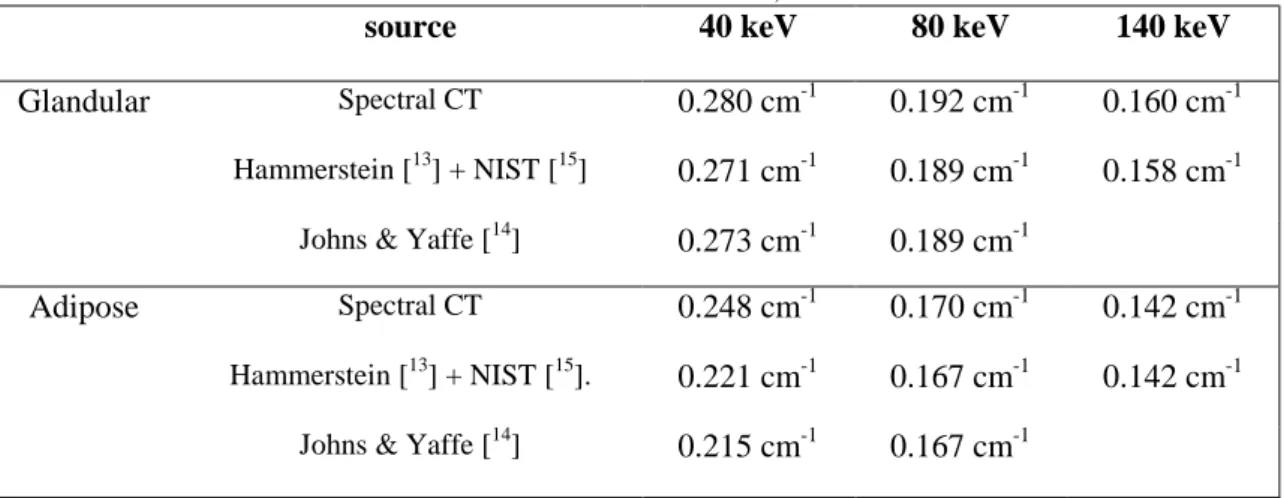
Table 4: Linear attenuation coefficients at 40 keV, 110 keV and 140 keV.
source
40 keV
80 keV
140 keV
Glandular
Spectral CT0.280 cm
-10.192 cm
-10.160 cm
-1Hammerstein [13] + NIST [15]
0.271 cm
-10.189 cm
-10.158 cm
-1Johns & Yaffe [14]
0.273 cm
-10.189 cm
-1Adipose
Spectral CT0.248 cm
-10.170 cm
-10.142 cm
-1Hammerstein [13] + NIST [15].
0.221 cm
-10.167 cm
-10.142 cm
-1Johns & Yaffe [14]
0.215 cm
-10.167 cm
-1Figure 2: HU in function of nominal breast density equiva-lence. (30 measurements per breast density equivalence) and least square fit finding the expected relation (R² = 0.989).
Figure 3: mono-energetic HU for gland equivalent and adipose equivalent breast material
The average HU for the ROIs in the center of the plates of the 0% and 100% small plates were -83 HU and 56 HU. This was not in agreement with the HU found for the large plates in configuration 3. The average HU for equal plates in dif-ferent configurations were compared for ROIs of the entire sequence in the middle and on the side of the plate. Results are presented in Table 3. Variability was found between the configurations, but there was a good consistency between different plates (small and large) within one configuration even if theROIs on the sides of the plate are taken into ac-count. It shows that probably not only the orientation of the plates is of importance, but also the surrounding material. Following results are measured on the GSI images. Figure 4 shows the computed mono-energetic HU and standard devi-ation as a function of energy in keV for configurdevi-ation 4. HU values for adipose and glandular equivalent materials ranged from respectively -144 and 57 HU at 40 keV to -75 and 24 HU at 140 keV.
Based on these curves the linear attenuation coefficients were computed. The linear attenuation coefficient of water was found to vary from 0.277 cm-1 at 40 keV to 0.152 cm-1 at 140 keV. When compared to the NIST values [15] differences were 0.010 cm-1 to 0.001 cm-1 respectively.
In Figure 4 and Table 4, the linear attenuation coefficients of glandular and adipose equivalent materials were compared to the linear attenuation coefficients computed by combining the atomic composition in [13] and [16] with the linear atten-uation coefficients of materials from [15] , and to the linear attenuation coefficients measured from tissue samples [14] .
CONCLUSIONS
CT was found effective to study the local attenuation properties of the breast equivalent phantom plates. The homogenei-ty within plates was found good and the attenuation consistent between plates of the same nominal breast densihomogenei-ty. A
Figure 4: Linear attenuation coefficients for glandular tissue and equivalent material (dark grey), water (black) and adipose tissue and equivalent material (light grey) obtained from linear attenuation of the composing elements (full lines) by sample measurements (dashed lines) and from phantom measure-ments (dots).
good linear correlation was found between the measured HU and the nominal breast density equivalence of the plates. Using spectral CT allowed to extend the investigation to the measurement of linear attenuation coefficients of the materi-als, and the results found were in good agreement with those provided by independent methods. These results confirm that these breast equivalent material plates can be used for the calibration and verification of breast density estimations methods, both in 2D and 3D.
REFERENCES
[1] American Cancer Society, “Breast Cancer Facts and Figures,” and references therein (2004-2011).
[2] Perry, N., Broeders, M., de Wolf, C., Törnberg, S., Holland, R., von Karsa, L., Puthaar, E., [European guidelines for quality assurance in breast cancer screening and diagnosis, fourth edition], ISBN 92-79-01258-4, (2006)
[3] McCormack, V.A., and dos Santos Silva, I., “Breast Density and Parenchymal Patterns as Markers of Breast Cancer Risk: A Meta-analysis,” Cancer Epidemiology, Biomarkers and Prevention 15, 1159-1169 (2006)
[4] Hartman, K., Highnam, R., Warren, R., and Jackson, V., “Volumetric assessment of breast tissue composition from FFDM images,” E.A.Krupinski, IWDM 2008 LNCS 5116, 33-39 (2008)
[5] Highnam, R., Brady, S.M., Yaffe, M.J., Karssenmeijer, N., and Harvey, J., “Robust Breast Composition Measure-ment – Volpara,” In J. Martí et al. (Eds.): IWDM 2010, LNCS 6136, 342–349 (2010)
[6] Malkov, S., Wang, J., and Shepherd, J., “Improvements to Single Energy Absorptiometry. Method for digital mammography to quantify breast tissue density,” E.A. Krupinsk: IWDM 2008, LNCS 5116, 1-8 (2008)
[7] White, D.R., R.J. Martin, and R. Darlison, “Epoxy resin based tissue substitutes,” British Journal of Radiology 5, 814-821 (1977)
[8] Fatouros P.P., Skubic S.E., Goodman H., “The Development and Use of Realistically Shaped, Tissue- equivalent Phantoms for Assessing the Mammographic Process,” Radiology, 157, 32 (1985)
[9] Durnez, M. “Comparison of density estimates from (3D) chest CT and 2D mammography,” Masterthesis KUL (2011)
[10] Wu, X., Langan, D.A., Xu, D., Benson, T.M., Pack, J.D., Schmitz, A.M., Tkaczyk, J.E., Leverentz, J., and Licato, P., “Monochromatic CT Image Representation via Fast Switching Dual kVp,” Proc. SPIE Vol. 7258 45-47 (2009) [11] Van Gompel, G., Buls N.,.,Nieboer, K., de Mey, J., "Accuracy estimation of spectral attenuation curves obtained by
Dual Energy CT", ECR 2011, (2011)
[12] Zhang, D., Li, X., and Liua, B., “Objective characterization of GE Discovery CT750 HD scanner: Gemstone spec-tral imaging mode,” Medical Physics 38, 1178-1188 (2011)
[13] Hammerstein, G.R., Miller, D.W., White, D.R., Masterson, M.E., Woodard, H.Q., and Laughlin, J.S., “Absorbed Radiation Dose in Mammography,” Radiology 130, 485-491(1979)
[14] Johns, P.C., and Yaffe, M.J., “X-ray characterization of normal and neoplastic breast tissues,” Physics in Medicine and Biology 32, 675-695 (1986)
[15] Berger, J., Hubbell, J.H., Seltzer, S.M., Chang, J., Coursey, J.S., Sukumar, R., Zucker, D.S., and Olsen, K., [XCOM: Photon Cross Sections Database, National Institute of Standards and Technology (NIST)], (1990)
[16] Poletti, M.E., Goncalves; O.D., and Mazzaro, I, “X-ray scattering from human breast tissues and breast-equivalent materials,” Physics in Medicine and Biology 47, 47-63 (2002)
[17] Malkov, S., Wang, J., Kerlikowske, K., Cummings, S.R., and Shepherd, J.A., “Single x-ray absorptiometry method for the quantitative mammographic measure of fibroglandular tissue volume,” Medical Physics 12, 5525-5536 (2009)
[18] Alonzo-Proulx, O., Packard, N., Boone, J.M., Al-Mayah, A., Brock, K.K., Shen, S.Z., and Yaffe, M.J., “Validation of a method for measuring the volumetric breast density from digital mammograms,” Physics in Medicine and Bi-ology 55, 3027-3044 (2010)