HAL Id: hal-01717487
https://hal.archives-ouvertes.fr/hal-01717487
Submitted on 7 Nov 2018
HAL is a multi-disciplinary open access
archive for the deposit and dissemination of
sci-entific research documents, whether they are
pub-lished or not. The documents may come from
teaching and research institutions in France or
abroad, or from public or private research centers.
L’archive ouverte pluridisciplinaire HAL, est
destinée au dépôt et à la diffusion de documents
scientifiques de niveau recherche, publiés ou non,
émanant des établissements d’enseignement et de
recherche français ou étrangers, des laboratoires
publics ou privés.
Effect of acid treatment on surface properties evolution
of attapulgite clay: An application of inverse gas
chromatography
Lilya Boudriche, Rachel Calvet, Boualem Hamdi, Henri Balard
To cite this version:
Lilya Boudriche, Rachel Calvet, Boualem Hamdi, Henri Balard. Effect of acid treatment on
sur-face properties evolution of attapulgite clay: An application of inverse gas chromatography.
Col-loids and Surfaces A: Physicochemical and Engineering Aspects, Elsevier, 2011, 392 (1), pp.45-54.
�10.1016/j.colsurfa.2011.09.031�. �hal-01717487�
Effect of acid treatment on surface properties evolution of attapulgite clay: An
application of inverse gas chromatography
Lilya Boudriche
a,b,∗, Rachel Calvet
c, Boualem Hamdi
b, Henri Balard
daCentre de Recherche Scientifique et Technique en Analyses Physico-Chimiques (C.R.A.P.C), BP 248, Alger Rp, 16004, Alger, Algeria
bLab. d’Etude Physico-Chimique des matériaux et Application à l’Environnement, Fac. De Chimie, USTHB, BP 32 El Alia, Bab Ezzouar, 16111, Alger, Algeria cUniversité de Toulouse, Mines Albi, CNRS, Centre RAPSODEE, Campus Jarlard, F-81013 Albi Cedex 09, France
dLab. Chimie Physique, ENSISA-W, 11, rue Werner, 68093 Mulhouse Cedex, France
Keywords: Attapulgite Palygorskite Acid treatment Surface properties Inverse gas Chromatography
a b s t r a c t
In this paper, the evolution of structural, textural and surface properties of attapulgite after treatment with increasing concentrations of hydrochloric acid (0.5, 1, 3 and 5 M) is reported. The solids obtained were characterized by SEM, XRD, FTIR and BET analysis. The surface properties were also evaluated using inverse gas chromatography at infinite dilution (IGC-ID) and finite concentration (IGC-FC). The IGC analysis permitted us to reach several parameters such as: specific surface area, BET constant with organic probes and the distribution functions of the adsorption energy sites on the solid surface. At dilute concentrations of acid, carbonates are eliminated and the specific surface area increases. However, the morphology and crystal structure of attapulgite are preserved. At higher concentrations of acid, disso-lution of octahedral sheets and at the same time formation of an amorphous silica from the tetrahedral sheets occur. However, the fibrous morphology is still preserved. The calculation of distribution functions reveals a clear evolution in the heterogeneity of the surface during the acid treatment, the appearance of shoulders is attributed to the development of strong specific interactions between the injected polar probe and silanol groups on the surface of amorphous silica formed during the acid treatment.
1. Introduction
Acid activation is an usual method employed for improving the surface properties of clay minerals[1,2]. This chemical treat-ment allows to optimize the adsorption capacity of some clays in different fields, like in water pollution[3,4], and in catalysis by elaboration of porous structures used as catalysts or catalyst supports, on which are adsorbed or deposited active elements
[5,6]. These practical applications are a consequence of the exis-tence of a high physico-chemical activity in the clay surface. In this sense it is important to note that the clay behavior will be con-ditioned by extent of its surface properties. Such channels may be considerably modified by heat and acid treatment, producing a sensible change not only of its surface geometry (specific sur-face and porosity) but also in its sursur-face chemistry and sursur-face energy. Indeed, this type of treatment makes it possible to increase specific surface, to create and modify the pores and can even
∗ Corresponding author at: Centre de Recherche Scientifique et Technique en Analyses Physico-Chimiques (C.R.A.P.C), BP 248, Alger Rp, 16004, Alger, Algeria. Tel.: +213 696521747; fax: +213 21247406.
E-mail addresses:boud lil@yahoo.fr(L. Boudriche),calvet@mines-albi.fr
(R. Calvet),bhamdi 99@yahoo.fr(B. Hamdi),h.balard@wanadoo.fr(H. Balard).
transform structure of material. Moreover, acid treatment of clay will produce changes in the nature and number of the active sites. These acid sites and the extent of the surface area are fundamen-tally responsible for the physico-chemical activity of the surface of clay.
Consequently, the assessment of the surface properties modifi-cation of clay, like chemical, morphological properties and energy surface, is essential to explain and understand the behavior of mate-rials in a given application.
The work reported here is based on the study of an Algerian clay “attapulgite”. So, acid treatment was applied on attapulgite at increasing concentration to monitor the physico-chemical properties evolution of the solid, particularly its surface prop-erties. Different methods, such as X-rays diffractometry, Fourier transform infrared, scanning electron microscopy, porosity anal-ysis were used to characterize the evolution of the properties of attapulgite before and after treatment by HCl acid. Inverse gas chromatography (IGC) was also carried out, it is now a well-established technique for the determination of the sur-face thermodynamic properties, including London (i.e. apolar) and specific (i.e. polar) interactions, at the molecular level. It was proved that this technique is very effective. It was applied extensively for the characterization of the surface ther-modynamic energy of various finely divided powders, (mineral
fillers, pigments, silicates etc.) [7–9], composite materials [10], organic materials (plastics, textiles, food, pharmacology etc.)
[11–13].
2. Theoretical part
Depending on the amount of probe molecules injected into the chromatographic column, two techniques of IGC may be distin-guished:
2.1. Inverse gas chromatography at infinite dilution (IGC-ID) This technique reflects the interaction between the isolated probe molecule and the solid surface, it consists on the injection of negligible quantities of probes molecules (vapour) with known properties (polarities, ramification).
Depending on the chemical nature of the probe molecule, inverse gas chromatography at infinite dilution (IGC-ID) provides access to many parameters:
- The dispersive component of the surface energy (!d
s), obtained
by injection of linear alkanes. This parameter indicates the ability of the solid surface to have non-specific interactions with probe molecules[14].
- The nanomorphological index IM("t), established by injection of
branched or cyclic alkanes. This value delivers an information about the roughness of the solid surface at the molecular scale
[15].
- The specific component of the surface energy (Isp), determined
by injections of polar probes, it gives access to polar interactions, mainly the acid-base interactions[16].
2.2. Inverse gas chromatography at finite concentration (IGC-FC) This technique reflects the interaction of a population of probe molecules with the solid surface by injecting few microliters of liquid probe (1–20 !L) into the column containing the solid to be analysed.
Due to the presence of sites of adsorption having high inter-action energies, a non-negligible part of the injected probe is not eluted in time corresponding to the return of the signal to the base line. In order to assess the amount of probe irreversibly adsorbed on the surface, the temperature of the chromatograph oven is increased up to 150◦C, the conditioning temperature, leading to the
small peak observed on the right side of the inverse gas chromatog-raphy at finite concentration (IGC-FC) chromatogram. Then the irreversible part of the adsorption phenomena could be assessed from the ratio of the area of the thermodesorption peak to the total area of the chromatogram, designed as irreversibility index (Iirr) [17]and computed according to the Eq.(1):
Iirr= (S Sth
rv+ Sth) (1)
where Srvis the surface of the main chromatographic peak and Sth
is the surface corresponding to the thermodesorption peak. IGC-FC gives also access to the first isotherm derivative[18], which is directly related to the net retention time of each point of diffuse front of the chromatogram by the Eq.(2):
!
∂N ∂P"
L,tr =RT1 Dmc(tr− t0) (2)where N is the number of probe molecules adsorbed at one point on the rear descending front of the chromatographic peak, P the partial pressure of the probe at the output of the column, L the column length, trthe retention time of this point, t0the retention
time of CH4, a molecule not retained by the solid surface, Dcthe
corrected flow rate and m the mass of the solid contained in the column, T the oven temperature. Also, the pressure of the probe is directly related to the height of the signal at this point.
Hence, one has easily access to the desorption isotherm of the molecule probe, from a single chromatographic peak[18].
Desorption isotherm and its main parameters such as the Henry and the BET constants and the specific surface area were com-puted using a home-made softaware from the Adscientis society (Wittelsheim, France).
On another hand, the shape analysis of the isotherm leads to the knowledge of distribution functions of the adsorption energy sites (DF), which are related to the surface heterogeneity of the solid contained in the column. The calculation of DF is based on a phys-ical adsorption model, which admits that the global isotherm may be considered as a sum of local isotherms of adsorption on isoen-ergetic domains (patchwork model)[17,19,20]. Then, the surface heterogeneity is described by a distribution function corresponding to the relative abundance of each type of domain having the same characteristic energy of interaction (εc). DF was computed using
the home-made software from the Adscientis Society (Wittelsheim, France).
Comparing the computed DF with the DF corresponding to a homogeneous surface that fit the left descending branch of the experimental DF, towards the lowest interaction energies,[17]one has access to an index of surface heterogeneity Ihete, given by the
Eq.(3):
Ihete=A − AA H (3)
where A is the area under the experimental DF and AHthat of the
homogeneous DF.
This index will permit to compare simply the surface hetero-geneity of the studied samples.
3. Materials and methods 3.1. Material
The attapulgite used in this study is from the region of Ghoufi, at the northeast of Algeria. The crude attapulgite was first coarsely crushed and sieved in order to obtain a size fraction below 1 mm, allowing easier analysis, measurements, and treatments at the laboratory-scale processes.
Palygorskite and attapulgite are synonymous terms for the same hydrated magnesium aluminum silicate mineral. The preferred name as specified by the International Nomenclature Committee is palygorskite but the name attapulgite is so well entrenched in trade circles that it continues to be used by many producers and users.
According to Bradley[21], the structure of attapulgite belongs to the 2:1 phyllosilicate classification, in which the sheets of silica tetrahedral are periodically inverted with respect to the tetrahedral bases (Fig. 1). As a result of this inversion, the octahedral sheets are periodically interrupted and terminal cations must complete their coordination spheres with water molecules. This structure confers to the material a fibrous morphology.
3.2. Acid treatment of attapulgite
The acid treatment of the attapulgite was carried out under reflux system at the boiling point of the HCl solution for 6 h. The experiments were done with different HCl concentrations: 0.5 M, 1 M, 3 M and 5 M.
For each concentration, the obtained solution was filtered and the residue was washed with distilled water several times. The titration of the filtered solution with silver nitrate (AgNO3)
Fig. 1. Crystal structure of attapulgite[21].
permitted us to ensure that the chloride ions were totally removed from the residue. Then, the obtained sample was dried at 110◦C
overnight, before characterizations. 3.3. Characterization methods
The particle morphology was investigated using a scanning elec-tron microscope (Philips XL 30 model ESEM-FEG) operating at 3 kV. The X-rays analysis by SEM or energy dispersive spectroscopy (EDS) was conducted to determine the elemental composition of parti-cles. This method is based on the emission of a photon X, knowing that the X-ray photons have an energy characteristic of each ele-ment that issued them. These photons are collected and classified according to their energy (EDS detector) to provide information on the chemical composition of the sample.
The density of the obtained solids was determined by an helium pycnometer (Accupyc 1330-Micrometrics).
The specific surface areas, BET constants, and meso and micro-pore volumes were determined using nitrogen adsorption at liquid nitrogen temperature (ASAP 2010, Micromeritics) by applying the BET, BJH, and t-plot methods, respectively. The samples were out gassed, before analysis, at 105◦C for 24 h at a pressure of
6.6 × 10⁻³mbar.
Phase identification was performed on a Panalytical X’PERT Pro diffractometer (Philips) (CuK radiation) with a step size of 0.017◦
for 2% angles ranging from 5◦to 80◦. The 2% values were analysed
with the X’Pert High Score software and compared with the ICDD (International Centre for Diffraction Data) database.
The IR spectra of activated attapulgite were obtained using a Perkin Elmer 560 Fourier transform infrared (FTIR) spectropho-tometer with a resolution of 2 cm−1and a scan number equal to 64.
The spectral study was extended over the range 4000–400 cm−1.
The analysis was done on KBr pellets with 1% of treated sample, using a hydraulic press by applying a pressure of 73.5 kPa.
For the analysis of silicon, samples were mineralized by alkaline fusion with sodium hydroxide. For the analysis of the following ele-ments: Al, Mg, Ca, Fe, samples were mineralized by wet way in acid media. After mineralization, all the elements were then analysed by ICP-AES.
The IGC measurements were performed with two GC devices (Agilent 7890 A and 6890), fitted with sensitive flame ionization detectors (FID). Helium was used as the carrier gas with a flow rate of 30 mL/min measured with an electronic flowmeter (Flow 500-Agilent). The temperatures of the injector and detector were respectively 130◦C and 200◦C. The columns were partially filled
with a mass of attapulgite powder varying between 0.3 and 1 g and completed with glass beads. The mass of powder was depending
of the pressure drop into the column which had to be lower than 1 bar in order to avoid leaks at the septa and fittings.
The IGC-ID study was done with an oven temperature of 130◦C,
using stainless steel columns of 20 cm in length, with 6.35 mm in diameter. The columns were conditioned overnight at 150◦C. The
conditioning temperature was taken equal to 150◦C after a study
made on the effect of temperature on the surface properties of the attapulgite, this temperature does not alter the surface properties of the solid. The oven temperature for the analysis must be less than the conditioning temperature so it was chosen equal to 130◦C to
allow a good separation between the peak of methane and the peak of the probe at this temperature.
The probes used were linear alkanes (hexane C6, heptane C7 and octane C8), two branched alkanes, the 2,3,4-trimethylpentane (2,3,4-TMP) and the 2,5-dimethylhexane (2,5-DMH), a cyclic alkane, the cycloctane (Cycl 8) and polar probes (chloroform CHCl3
and dichloromethane CH2Cl2). These probes had a
chromato-graphic grade (>99%) purity.
For IGC-FC, the chromatographic columns were 10 cm in length with 6.35 mm or 3.18 mm in diameter. The conditioning tempera-ture was 130◦C and analysis temperature depended on the probe
used, according to the Conder criterion[18]which states that the contribution of probe vapour to the flow of carrier gas does not exceed 5% of the initial flow at the maximum of the chromato-graphic peak. Three probes were examined in IGC-FC, the octane (C8) at 53◦C, the isopropanol (IP) at 43◦C and the 1,4-dioxan (DX)
at 51◦C. We chosed an apolar probe ‘octane’ to study the surface
morphology and two polar probes to study the surface chemistry. These probes had a chromatographic grade (>99%) purity and were placed on a molecular sieve to avoid the water effect.
The injections of each probe are repeated three times and three columns were made with the raw attapulgite for taking into account the heterogeneity of the powder. For each parameter, a media is then calculated from the values resulting from the dif-ferent injections and from the three columns. The repeatability measured with three columns was only examined with the raw powder because of the duration of the analysis. For the other sam-ples, only the injections on one column were repeated three times. To be sure that the amount of injected probe corresponds to the ID conditions, different injections are realised varying the amounts of probe vapour. If the retention time at the maximum of the chro-matogram is constant, the ID conditions are respected.
To reach the FC conditions, the probe is injected in the liquid form to lead to a highly asymmetric chromatographic peak. Exper-imentally, some increasing quantities of liquid probes are injected, the diffuse fronts of the chromatographic peaks are recovering themselves in the case of a solid leading to a type II adsorp-tion isotherm. The tops of the peaks appear for retenadsorp-tion times lower and lower as the quantity of probes increases until the chro-matogram obtained when the monolayer of probe is reached at the surface of the solid.
4. Results and discussion
4.1. Structural and textural characterizations 4.1.1. Scanning electron microscopy
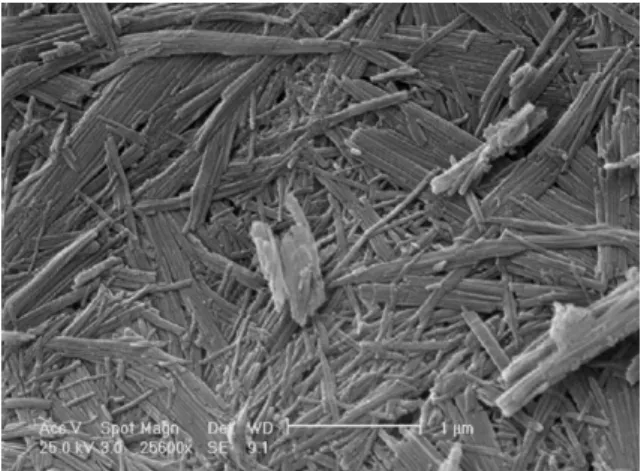
The scanning electron microscopy was used for the determina-tion of the morphology of acid treated attapulgites.Fig. 2displays two microscopies of the raw attapulgite.
One sees inFig. 2A that the raw attapulgite exhibits a fibrous morphology with fibers having an average length less than 3 !m.
Fig. 2B shows a typical crystalline inclusion present in the raw attapulgite, which are attributed to carbonated impurities accord-ing to their X-rays analysis (EDAX): Ca (22.38%), C (18.48%), O
Fig. 2. SEM micrographies of (A) attapulgite fibers and (B) a carbonate inclusion.
Fig. 3. SEM micrography of a hole appearing in attapulgite structure after acid treatment with 0.5 M HCl.
(44.76%) and Mg (13.32%), present in calcite CaCO3and dolomite
CaMg(CO3)2.
Fig. 3shows a SEM micrography of the attapulgite treated with HCl 0.5 M.
If it is observed that the silica keeps its fibrous morphology unchanged comparing with the raw attapulgite, some carbonate impurities had disappeared, leaving holes in the fibrous solid.
Then, the influence of the strongest treatment done with HCl 5 M, on the attapulgite morphology was so examined (Fig. 4).
It is worth to point out that the fibrous morphology is still pre-served with this strong acid treatment. Gonzalez et al. had made the same observation after activation with HCl of sepiolite[22]or
Fig. 4. SEM micrography of attapulgite, after treatment with 5 M HCl.
attapulgite[23]. He explained that the silica generated during the activation process could behave as a protective gel preserving the fibrous morphology of attapulgite.
The loss of material due to the acid treatment of the carbonated impurities will have certainly an influence on the global apparent density of the treated attapulgite as it could be measured using a helium pycnometer.
4.1.2. Density measurements
Table 1reports the values of the apparent densities of initial and acid treated attapulgites.
It is observed that the apparent density decreases readily with increasing HCl concentration. For the sample treated with 5 M HCl, the apparent density decrease is equal to 15% of the initial one.
This loss of material will certainly have an influence on the sur-face morphology in terms of specific sursur-face areas and porosity as it could assess through nitrogen adsorption at 77 K.
4.1.3. Specific surface areas and porosity measurements
The values of specific surface areas, micro and mesoporous vol-umes, obtained by exploiting the adsorption–desorption isotherms of N2at 77 K, are gathered inTable 2.
The specific surface areas increase from 125 m2/g before
treat-ment to 399 m2/g after a treatment with a 3 M HCl concentration.
There are good correlations between the density data quoted and specific surface area and with the mesoporous volumes.
The increase of the surface area is due to the creation of new surfaces in activated samples. This creation of porosity is caused, at first, by dissolution of carbonate species, followed by those of the octahedral sheets, and exchangeable cations[24].
But beyond the 3 M HCl concentration, BET surface decreases down to 315 m2/g for the 5 M solution, at the same time of
the microporous volume decreases. These evolutions could be attributed to the plugging of the active sites created after acid treat-ment, by the deposition of insoluble impurities. This trend was previously observed by Vincente Rodriguez[25] and Mendiorez et al.[26], on sepiolite and montmorillonite activated also with HCl.
Table 1
Density measurements of HCl activated attapulgites.
Samples Density (g/cm3)
Raw attapulgite 2.57
Activated attapulgite with HCl
0.5 M 2.40
1 M 2.35
3 M 2.21
Table 2
Values of the specific surface areas (aBET), BET constants (CBET), meso (Vmeso) and micropores (Vmicro) volumes of attapulgite samples before and after HCl treatment at different
concentrations, determined by nitrogen adsorption at 77 K.
aBET(m2/g) CBET Vmeso(cm3/g) Vmicro(cm3/g)
Raw attapulgite 125.1 436 0.302 0.018
Activated attapulgite with HCl
0.5 M 273.5 468 0.397 0.047
1 M 336.6 299 0.532 0.058
3 M 399.0 243 0.662 0.054
5 M 315.2 131 0.728 0.014
The BET constant is also affected by the acid treatment; it decreases significantly from 436 to 131, reflecting a decrease in the interaction ability of nitrogen with the surface of the activated samples.
All these change in surface morphology have certainly related to a change of the crystalline structure of the attapulgite that could be evidenced by X-ray diffraction and IR spectroscopy.
4.1.4. X-ray diffraction and IR spectroscopy
Diffraction patterns of acid treated attapulgite samples are gath-ered inFig. 5.
It is observed that the XRD diffractogram of attapulgite remains unchanged when treated with a 0.5 M HCl concentration. Beyond this value, a progressive reduction in the peaks intensity of dolomite and calcite with the increase of HCl concentration is noticed. Comparing with the raw clay diffractogram, for a 1 M HCl concentration the disappearance of peaks at 29.2, 30.8, 37.5, 39.3, 42.9, 44.8, 47.6, 48.5, and 50.9 (2%) characteristic of calcite (CaCO3)
and dolomite (CaMg(CO3)2) is observed whereas the attapulgite
pattern remains unchanged. This observation confirms the loss of the two crystalline forms of carbonates, which was evidenced by SEM.
For a 3 M HCl concentration, the attapulgite peaks become broader, indicating the loss of crystallinity. After 5 M HCl treatment, the diffraction patterns inFig. 5shows a broadened band (between 15 and 35 (2%)) corresponding to the formation of an amorphous silica phase, insoluble in acid medium, generated by the dissolution of octahedral sheet in attapulgite under acid treatment. Suarez Bar-rios et al.[24]have reported similar results on a Spanish attapulgite, with 7 M HCl. 6 11 16 21 26 31 36 41 46 51 56 61 66 71 76 (2θ) counts Be fo re a ci d tre at m en t 0.5 M 1 M 3 M 5 M Att+D Att D+ A tt Att C+ A tt C CD C D D + C D+ C At t + C At t Att C D D D CD D+ C D + D C D+ A tt D At t
Fig. 5. XRD diffractograms of attapulgite before and after acid activation at different HCl concentrations (Att = attapulgite, D = dolomite, C = calcite).
IR spectroscopy could also gives information about the structure of the studied attapulgites.
Fig. 6represents the evolution of FTIR spectra of attapulgite before and after activation with HCl at different concentrations in the spectral range of 3800–2900 cm−1.
The band located at 3614 cm−1 is attributed to the stretching
vibration of OH associated with Al3+cations in dioctahedral
coordi-nation (Al2OH) and to OH stretching vibration of water coordinated
to Mg along the fibers. The second band located at 3546 cm−1
is related to stretching vibrations of OH in (Fe, Mg)–OH and (Al, Mg)–OH[27].
The peaks intensities at 3614 cm−1and 3546 cm−1remain
con-stant until a 1 M HCl concentration and then are weaker for 3 M solution until their total disappearance for the 5 M concentration, revealing a broad intense band centered around 3440 cm−1.
Thus, the disappearance of these bands confirms the total dis-solution of the octahedral sheets for highest concentrations of acid. This variation agrees with that reported by Suarez Barrios et al.[24]
on a Spain attapulgite treated with acid.
Fig. 7shows the evolution of the IR pattern under the effect of acid treatment in the 1500–400 cm−1region.
The bands characteristic of carbonates, at 1423 cm−1 and
877 cm−1, disappear from the treatment with 0.5 M HCl,
cor-roborating again the elimination of carbonate impurities at this concentration. At 1 M concentration the characteristic bands of the attapulgite structure remains quite unchanged.
Nevertheless, at this concentration, new bands appear, which will increase with increasing HCl concentration:
- At 800 cm−1, this band increases in intensity as the concentration
of HCl increases. It is attributed to the vibration of Si–O–Si in the formed free silica (SiO2)[23,24].
2900 3100 3300 3500 3700 Wave Number (cm-1) 5 M 0.5 M Before treatment 1 M 3 M 3546 cm-1 3614 cm-1
Fig. 6. FTIR spectra of attapulgite before and after treatment with HCl, in 3800–2900 cm−1region.
400 900 1400
Wave Number (cm
-1)
Before acid
treatment
0.5 M
1 M
3 M
5 M
877cm
-1 800 cm-1 1423cm-1950 cm
-1Fig. 7. FTIR spectra of attapulgite before and after treatment with HCl, in the 1500–400 cm−1region.
- At 950 cm−1, this band is attributed to the silanol groups
vibra-tion related to the formed amorphous silica (bending vibravibra-tion of Si–OH)[23,28].
- At 1200 cm−1, a broad band, characteristic of the silica bulk [23,28].
In summary, the different spectroscopic analysis confirms that activation of the attapulgite with HCl is strongly dependent on the acid concentration. Of course, these modifications would be accompanied by some important chemical modification that we have evidenced by elemental chemical analysis.
4.1.5. Chemical composition
The quantification of elemental composition (%Si, %Al, %Mg, %Ca, %Fe, %C) in the solid after treatment will help us to precise the evolution of the structure of attapulgite treated with different acid concentrations.
The evolution of their respective percentage, with the HCl nor-mality, is reported inTable 3:
As expected, the percentage of Si increases with increasing the acid concentration, at the same time as the decrease of Ca, Mg and Al contents. This decrease was attributed to the dissolution of carbon-ated impurities, calcite and dolomite, and to the partial treatment of the octahedral sheets, containing Al and Mg cations.
The rapid decrease of the carbon content between the initial and 0.5 M HCl solution corroborates the previous results, that say that the carbonate impurities are quite completely eliminated at this concentration whereas the augmentation in aluminum content proves that this treatment permits the purification of the raw atta-pulgite. Beyond a 1 M HCl concentration, the Al content decreases strongly, emphasizing the modification of the attapulgite structure. As observed with RX and IR, a higher acid concentration is required to affect the attapulgite structure.
For the normality equal and higher to 1 M, a continuous decrease of the cationic species goes on indicating clearly the transformation of the attapulgite into amorphous silica.
0 0 1 2 3 4 5 6 γSD(mJ/m2) Si/Al IMC8 0 20 40 60 80 100 120 140 160 180 0 0.2 0.4 0.6 0.8 γSSDD(mJ/m(mJ/m22)) Si/Al Si/Al IIMMC8C8 [HCl] (M)
Fig. 8. Evolution of the dispersive component !d
s, the nanomorphological index
IM("t), and the Si/Al ratio of attapulgite treated with HCl acid at different
concen-trations.
However, the 5 M HCl solution does not eliminate all the cations and the silicon content remains lower and is equal to about 80% to that corresponding at the pure silica (46.8%).
4.2. Surface properties characterization by IGC
The surface properties of the initial and acid treated attapulgites were examined calling on IGC-ID and IGC-FC.
4.2.1. Characterization of samples by IGC-ID
By IGC-ID analysis, the three following parameters were deter-mined, at 130◦C, on raw and acid treated attapulgites:
- The dispersive component of surface energy, !d
s, using alkanes
probes.
- The nanomorphological indexes, IM("t), of two branched alkane
probes and of one cyclic probe.
- The specific interaction parameters (Isp) of two acid probes.
Their values are reported inTable 4.
The values of the dispersive component of the surface energy decrease from 164 mJ/m2to 47 mJ/m2, as the acid concentration
increases. The initial value of 164 mJ/m2 is typical of a
phyllosil-icate, this high value is attributed to the insertion of the alkanes probes into the fibrous channels of the attapulgite or into struc-ture defects between fibers[7], whereas the final value of 47 mJ/m2
is of the same order of some synthetic silica like the S13 one (Wacker, 40 mJ/m2measured at 150◦C) with a specific surface area
of 132 m2/g[29].
The specific components of the surface energy Ispdetermined
by injecting acid polar probes, chloroform and dichloromethane, decrease slightly as the HCl concentration increases. These decreases can be attributed to the gradual disappearance of basic sites associated with the constituent cations and the appearance of acidic silanol groups, exchanging weaker interactions with these two acid probes.
Moreover, a close relation exists between the evolution of dis-persive component (!d
s), the nanomorphology index (IM("t)) and
the chemical composition of attapulgite activated with HCl acid as depicted inFig. 8.
Indeed, the highest !d
s parameter value and the lowest IMone
corresponds to the lowest Si/Al ratio attributed to the raw atta-pulgite. Beyond 3 M HCl concentration, the !d
s reaches very low
values while IMvalues tend to 1, testifying of the disappearance of
the surface roughness, as, in the same time, a pronounced increase of the Si/Al ratio is observed corresponding to an increase of per-centage of free silica formed from tetrahedral and octahedral sheets
Table 3
Chemical composition of elements in raw and activated attapulgite at different HCl concentrations.
Element (%) Elemental analysis
Raw attapulgite Activated attapulgite with HCl
0.5 M 1 M 3 M 5 M Si 16.63 24.99 27.68 34.04 38.71 Mg 6.35 5.10 4.41 1.83 0.24 Al 4.12 5.36 4.61 2.14 0.28 Ca 8.62 0.15 0.42 0 0.11 Fe 2.33 2.26 1.54 0.23 0 C 5.03 0.30 0.51 1.73 0.52 Table 4 Variation of the !d
s, IM("t) and Ispvalues, determined by IGC-ID at 130◦C, for attapulgite activated at different HCl concentrations.
!d
s(mJ/m2) ±4% IM("t) 5% Isp(kJ/mol) ±4%
C5, C6, C7 2,3,4-TMP 2,5-DMH Cycl 8 CH2Cl2 CHCl3
Raw attapulgite 164 0.69 0.67 0.22 17 13
Activated attapulgite with HCl
0.5 M 133 0.71 0.69 0.26 14 12
1 M 99 0.64 0.64 0.31 13 11
3 M 65 0.70 0.62 0.42 13 11
5 M 47 1.02 0.83 0.76 * 10
*: Measurement not exploitable.
of the attapulgite. The same correlation between the silicification phenomenon and the decrease of the dispersive component of the surface energy was already observed[9]on acid treated minerals fillers like bentonite and kieselguhr, particularly at high concentra-tion (HCl 6 M).
These evolutions of IGC-ID parameters demonstrate the HCl treated attapulgite loses its crystalline structure responsible of its surface roughness and acquires at high HCl concentration the sur-face structure of an amorphous silica and therefore, it corroborates the conclusions of the X-rays and IR spectroscopies.
Following, our work will focus on studying the influence of acid activation not only on the specific surface areas, but also on the surface heterogeneity of attapulgite as it could be assessed by IGC-FC.
4.2.2. Characterization of samples by IGC-FC
4.2.2.1. (a) Evolution of the isotherm characteristics with the acid treatment. The values of the specific surface areas, BET constants and irreversibility indexes of the samples activated with HCl, deter-mined by IGC-FC and nitrogen adsorption are reported inTable 5.
The specific surface areas with nitrogen are higher than those measured with octane probe, which are themselves higher than those measured with the two selected polar probes (isopropanol and dioxan).
The gap could be due to:
- Uncertainty on the actual molecular areas of organic probes, which were computed from adsorption isotherm data “on non-porous solids” which is not the case of the attapulgite.
- Structures of the probes (polarity and steric encumbrances). - The irreversible adsorption of the probe on the solid surface,
because IGC-FC provides the desorption isotherm, leading to an underestimation of the specific surface area.
To overcome this last difficulty, the specific surface area could be corrected by adding to that measured from the desorption isotherm, the contribution corresponding to the irreversible part, which could be assessed calling on the irreversibility index (Iirr)
determined from the thermodesorption peak as described above. This index provides an estimate of the proportion of high energy sites. The values of the corrected specific surface areas (acorr) are
reported inTable 6.
Nevertheless, the corrected specific surface areas (acorr)
mea-sured with the organic probes remains lower than those with nitrogen. Irreversible adsorption is not the only factor responsi-ble of the low values of the specific surface areas measured with organic probes but also the uncertainty on the actual molecular of the probes.
The evolution of the specific surface area as a function of the acid concentration is displayed inFig. 9.
Whatever the probe used – nitrogen or organic molecules – the curves have the same shape, they pass through a maximum for the 3 M HCl concentration.
The increase of the surface observed during the initial con-centrations (<3 M) is explained by the creation of new surfaces caused by the removal of carbonates impurities. Beyond the 3 M concentration, the decrease of specific surface areas values could be attributed to the collapse of the channels characteristic of the attapulgite structure and the formation of the amorphous silica deposit. 50 100 150 200 250 300 350 400 450 0 1 2 3 4 5 [ HCl ] (M) Sp ec ifi c s ur fa ce a re a ( m 2 /g)
Fig. 9. Evolution of the specific surface area of attapulgite treated with various con-centrations of HCl, measured by nitrogen adsorption ! and IGC-FC with octane!, isopropanol!, and dioxan ".
Table 5
Values of the specific surface areas (aBET), BET constants (CBET) and irreversibility indexes (Iirr) of raw and treated attapulgite with HCl, obtained by nitrogen adsorption and
IGC-FC.
Adsorption N2 IGC-FC
C8 (53◦C) IP (43◦C) DX (51◦C)
aBET(m2/g) CBET aBET±2.8
(m2/g) CBET Iirr±0.2 (%) aBET±4 (m
2/g) C
BET Iirr±0.6 (%) aBET±3
(m2/g) CBET Iirr±0.1 (%)
Raw attapulgite 125.1 437 114.5 9 0.6 71 22 8.3 71 21 7.8
Activated attapulgite with HCl
0.5 M 272.6 592 135.4 10 2.1 100 20 10.4 142 13 12.9
1 M 336.6 299 183.4 9 1.3 201 28 18.1 174 17 19.9
3 M 399.0 243 239.8 6 0.8 237 32 15.2 251 16 20.5
5 M 315.2 131 222.6 5 0.2 142 60 9.9 201 19 20.4
Table 6
Corrected values of specific surfaces of attapulgite samples after treatment with HCl solutions.
acorr(m2/g) aBET(m2/g)
C8 (53◦C) IP (43◦C) DX (51◦C) N2
Raw attapulgite 115.2 76.9 76.5 125.1
Activated attapulgite with HCl
0.5 M 138.2 110.4 160.3 272.6
1 M 185.8 237.4 208.6 336.6
3 M 241.7 273.0 302.5 399.0
5 M 223.0 156.1 242.0 315.2
It is also worth to point out that the irreversibility indexes are also sensitive to the acid treatment. Those calculated with octane and isopropanol follow the same trend and go through a maximum for the acid concentrations comprised between 0.5 M and 1 M HCl. This observation supports again the hypothesis done previ-ously that these acid concentrations permit the purification of the raw attapulgite without affecting notably its crystalline structure between 0.5 M and 1 M HCl, the XRD patterns inFig. 5shows the peaks related to the attapulgite are preserved. The disappearance of roughness surface and the destruction of the attapulgite structure, at high acid concentrations, make the surface more uniform.
Dioxan behaves differently because its irreversibility index increases as the acid concentration increases indicating a greater affinity, bound to its strong base character, for the formed silica surface through the acid silanol sites.
In the same way, the isopropanol BET constant increases sig-nificantly as the HCl concentration increases until the 5 M HCl concentration, it was attributed to the strong interactions that take place between the isopropanol and the silanol at the surface of the silica formed gradually as the acid concentration increases.
Now the evolution of the surface heterogeneity with the increase of the acid concentration, will be assessed through the distribution functions of the adsorption energies of the organic probes.
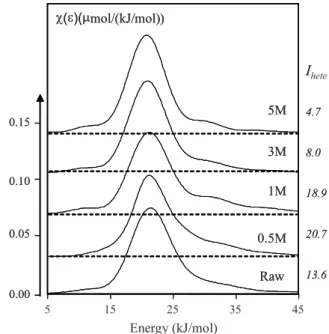
4.2.2.2. (b) Evolution of the surface energetic heterogeneity. The DF of the initial and treated attapulgites were calculated according to the Rudzinski Jagiello method[19]and developed by Balard[20]. The DF allows us to evaluate the surface heterogeneity of our activated samples. It was first evaluated with a non polar probe, n-octane (Fig. 10), which exchanges only dispersive interactions with the surface of the studied samples and therefore is not sensitive to the surface functionality.
The obtained DF obtained with octane are essentially monomodal and almost superposable for all the studied samples. Nevertheless their heterogeneity indexes Ihete(Fig. 10) go through
a maximum for the 0.5–1 M solutions, testifying that dissolution of carbonate impurities liberates high energetic sites, which are prob-ably insertion sites. For the 5 M concentration, the surface becomes quite homogeneous, a proof that the surface is quite smooth at the
molecular level as it was also proved by the fact the nanomorphol-ogy index of the cyclooctane was close to one.
On the contrary, by its ability to exchange strong interactions through hydrogen bonding, the isopropanol probe is sensitive to the surface functionality. The DF of isopropanol of the raw and treated attapulgite samples and their corresponding Iheteare
depicted inFig. 11.
The DF of the raw attapulgite shows only a tail extending towards the high energies, a proof that the presence of the impuri-ties generates some sites having intermediate interaction energies, leading to a continuum.
The treatment with 0.5 M HCl modifies only a little bit the initial DF shape, no define secondary maximum appears. This observa-tion corroborates the fact that at this concentraobserva-tion, attapulgite structure remains practically unchanged.
χ(ε)(µmol/(kJ/mol))
45 35 25 15 5Energy (kJ/mol)
3M
1M
0.5M
Raw
5M
0.05 0.10 0.15 0.00I
hete 4.7 8.0 18.9 20.7 13.6χ(ε)(µmol/(kJ/mol))
3M
1M
0.5M
Raw
5M
0.05 0.10 0.15 0.00I
4.7 8.0 18.9 20.7 13.6Fig. 10. Adsorption energy distribution functions of the n-octane probe of the initial and treated attapulgite, measured at 53◦C.
I
heteχ(ε)(µmol/(kJ/mol))
45 35 25 15 5Energy (kJ/mol)
Raw
0.5M
5M
3M
1M
0.05 0.10 0.15 0.00 63.2 57.8 49.9 40.7 41.2χ(ε)(µmol/(kJ/mol))
χ(ε)(µmol/(kJ/mol))
Energy (kJ/mol)
Raw
0.5M
5M
3M
1M
0.05 0.10 0.15 0.00Fig. 11. Adsorption energy distribution functions of the isopropanol probe of the initial and treated attapulgite, measured at 43◦C.
With increasing the acid concentration, the DF become clearly bimodal, very similar to those acquired for pyrogenic silicas
[16,30,31], reflecting an evolution toward a silica like structure. According to the literature, the peak towards low energies reflects the hydrogen interactions between the alcohol function of the iso-propanol probe and siloxane bridges Si–O–Si on the solid surface, whereas the peak at about 28 kJ/mol is attributed to stronger inter-actions through hydrogen bound of the probe with the silanol groups on the solid.
The regular growth of the Iheteparameter from the raw material
up to 5 M HCl treated one, denotes an increase of the surface het-erogeneity bound to the change of its chemical functionality. This agrees with the gradual formation of siloxane and silanol sites on free silica surface.
χ(ε)(µmol/(kJ/mol))
Energy (kJ/mol)
5M
3M
1M
0.5M
Raw
0.05 0.10 0.15 0.00I
heteχ(ε)(µ
45 35 25 15 55M
3M
1M
0.5M
Raw
0.05 0.10 0.15 0.00 42.0 34.4 38.6 29.3 31.1Fig. 12. Adsorption energy distribution functions of the dioxan probe of the initial and treated attapulgite, measured at 51◦C.
DF of dioxan probe and their corresponding Iheteparameters are
depicted inFig. 12.
As for the isopropanol probe, the DF of the raw sample and the one treated with 0.5 M HCl exhibit same shape and show no defined structure due to the multiplicity of the adsorption sites on their surface, testifying again that this treatment does not affect notably the structure of the attapulgite despite it permits the elimination of the most part of the carbonated impurities.
For higher acid concentrations, dioxan DF become clearly tri-modal. This difference in behavior compared with isopropanol probe should be attributed to the basic character of the dioxan, that can establish strong specific interactions with silanol group. If the main peak centered at 18 kJ/mol can be again attributed to the interaction probe-siloxane groups, two new peaks located at 28 kJ/mol and 36 kJ/mol, should correspond to the interactions of dioxan with different acid sites, some act-ing as Lewis site, like cations or as Brönsted site like silanol groups.
The dioxan heterogeneity indexes values, Ihete, do not evolve
strongly, if we except the 5 M treated sample. This could per-haps be bound to the ability of this basic probe to interact with different type of acid sites and to the fact the silanol on the amor-phous silica will replace Lewis ones when the acid concentration increases.
5. Conclusion
The activation of attapulgite with increasing HCl concentrations indicates that:
At low concentrations of HCl (≤1 M), the morphology and the crystal structure of attapulgite are preserved and the elimination of carbonates is mainly observed. Decarbonation causes an increase in surface area and pore volumes, measured with nitrogen and a decrease of the apparent density of the sample.
At higher concentrations of HCl (>3 M), the dissolution of Al and Mg cations from the tetrahedral and octahedral sheets leads to a progressive destruction of the chemical structure leading to the formation of amorphous silica, which keeps the original fibrous morphology.
By IGC-ID, it was observed a decrease of the dispersive com-ponent of the surface energy and correlatively an increase of the index of nanomorphology of the cyclooctane corroborating the passage from a clay structure to that of a amorphous sil-ica. Whereas the Isp, determined by injection of polar probes,
indicates a change in the surface acidity, the silica being more acidic.
The n-octane DF, which is not sensitive to the surface func-tionality, leads quite symmetrical DF characteristic of a quite homogeneous surface.
On another hand, the DF of the two polar probes (isopropanol or dioxan) are strongly asymmetrical for the initial attapulgite and bimodal for the isopropanol probe or trimodal for the dioxan probe, because of their high sensitivity to the surface functionality. These probes interact by hydrogen bonds or strong acid/base interactions with the surface functional groups.
Thus, inverse gas chromatography has enabled us to gather many informations about the surface properties of attapulgite acti-vated with HCl.
In conclusion, if one wants to purify an attapulgite and simulta-neously to preserve its structure, a one molar HCl solution will be the best, having a high specific surface area, whereas a treatment with a 5 M HCl solution will permit to transform the attapulgite into an amorphous silica, having very different surface properties and also a high specific surface area.
References
[1] E. Djoufac-Woumfo, R. Kamga, F. Figueras, D. Njopwouo, Acid activation and bleaching capacity of some cameroonian smectite soil clays, Appl. Clay Sci. 37 (2007) 149–156.
[2] M. Suarez Barrios, C. De Santiago Buey, E. Garcia Romero, J.M. Martin Pozas, Textural and structural modifications of saponite from Cerro del Aguila by acid treatment, Clay Miner. 36 (2001) 483–488.
[3] A. Amari, M. Chlendi, A. Gannouni, A. Bellagi, Optimised activation of bentonite for toluene adsorption, Appl. Clay Sci. 47 (2010) 457–461.
[4] N. Frini-Srasra, E. Srasra, Acid treatment of south Tunisian palygorskite: removal of Cd(II) from aqueous and phosphoric acid solutions, Desalination 250 (2010) 26–34.
[5] M. Lenarda, L. Storaro, A. Talon, E. Moretti, P. Riello, Solid acid catalysts from clays: preparation of mesoporous catalysts by chemical activation of metakaolin under acid conditions, J. Colloid Interface Sci. 311 (2007) 537–543. [6] A. Cabrera, D. Vazquez, L. Velasco, M. Salmon, L. Arias, 1,3-Dioxolane formation with a montmorillonite-type clay catalyst, J. Mol. Catal. 75 (1992) 101–107. [7] L. Boudriche, B. Hamdi, Z. Kessaïssia, R. Calvet, A. Chamayou, J.A. Dodds, H.
Balard, An assessment of the surface properties of milled attapulgite using inverse gas chromatography, Clays Clay Miner. 58 (2010) 143–153. [8] H. Kellou, B. Hamdi, E. Brendlé, T. Gottschalk-Gaudig, H. Barthel, H. Ridaoui,
H. Balard, J.B. Donnet, Surface properties of dimethylsilylated silicas, assessed using IGC at finite concentration, Colloids Surf., A 327 (2008) 90–94. [9] B. Hamdi, Z. Kessaissia, J.B. Donnet, T.K. Wang, IGC characterization of surface
energy and morphology of two natural fillers: kieselguhr and bentonite, Annal. de Chim., Science des Matériaux 25 (2000) 481–494.
[10] X. Huang, B. Li, B. Shi, L. Li, Investigation on interfacial interaction of flame retarded and glass fiber reinforced PA66 composites by IGC/DSC/SEM, Polymer 49 (2008) 1049–1055.
[11] A.B. Nastasovic, A.E. Onjia, Determination of glass temperature of polymers by inverse gas chromatography, J. Chromatogr., A 1195 (2008) 1–15.
[12] V. Swaminathan, J. Cobb, I. Saracovan, Measurement of the surface energy of lubricated pharmaceutical powders by inverse gas chromatography, Int. J. Pharm. 312 (2006) 158–165.
[13] E. Cantergiani, D. Benczédi, Use of inverse gas chromatography to characterize cotton fabrics and their interactions with fragrance molecules at controlled relative humidity, J. Chromatogr., A 969 (2002), 103-101.
[14] G.M. Dorris, D.G. Gray, Adsorption spreading pressure and London force inter-actions of hydrocarbons on cellulose and wood fiber surfaces, J. Colloid Interface Sci. 71 (1979) 93–104.
[15] E. Brendlé, E. Papirer, A new topological index for molecular probes used in inverse gas chromatography for the surface nanorugosity evaluation. (1) Method of evaluation, J. Colloid Interface Sci. 194 (1997) 207–216.
[16] H. Balard, E. Brendlé, E. Papirer, Determination of the acid–base properties of solid surfaces using inverse gas chromatography: advantages and limitations, in: K. Mittal (Ed.), Acid–Base Interactions, Relevance to Adhesion Science and Technology, VSP, Utrecht, The Netherlands, 2000, pp. 299–316.
[17] H. Balard, D. Maafa, A. Santini, J.B. Donnet, Study by inverse gas chromatography of the surface properties of milled graphites, J. Chromatogr., A 1198 (2008) 173–180.
[18] J.R. Conder, C.L. Young, Physicochemical Measurements by Gas Chromatogra-phy, Wiley Interscience, New York, 1979, pp. 385–390.
[19] H. Balard, Estimation of the surface energetic heterogeneity of a solid by inverse gas chromatography, Langmuir 13 (1997) 1260–1269.
[20] W. Rudzinski, J. Jagiello, Y. Grillet, Physical adsorption of gases on heteroge-neous solid surface: evaluation of the adsorption energy distribution from adsorption isotherms and heats of adsorption, J. Colloid Interface Sci. 87 (1982) 478–491.
[21] W.F. Bradley, The structural scheme of attapulgite, Am. Mineral. 25 (1940) 405–410.
[22] L.J. Gonzalez, L.M. Ibarra, A. Rodriguez, J.S. Moya, F.J. Valle, Clay Miner. 19 (1984) 93–98.
[23] F. Gonzalez, C. Pesquera, C. Blanco, I. Benito, S. Mendioroz, J.A. Pajares, Structural and textural evolution of Al- and Mg-rich palygorskites, I. Under acid treatment, Appl. Clay Sci. 4 (1989) 373–388.
[24] M. Suarez Barrios, L.V. Flores Gonzalez, M.A. Vicente Rodriguez, J.M. Mar-tin Pozas, Acid activation of a palygorskite with HCl: development of physico-chemical, textural and surface properties, Appl. Clay Sci. 10 (1995) 247–258.
[25] M.A. Vincente Rodriguez, J.D. Lopez Gonzalez, M.A. Banares Munoz, Acid acti-vation of a spanish sepiolite: physico-chemical characterization, free silica content and surface area of the obtained products, Clay Miner. 29 (1994) 439–445.
[26] S. Mendiorez, J. Pajares, I. Benito, C. Pesquera, F. Gonzalez, C. Blanco, Texture evolution of montmorillonite under progressive acid treatment: change from H3 to H2 type of hysteresis, Langmuir 3 (1987) 676–681.
[27] C. Blanco, F. Gonzalez, C. Pesquera, I. Benito, Differences between one aluminic palygorskite and another magnesic by infrared spectroscopy, Spectrosc. Lett. 06 (1989) 659–673.
[28] E. Mendelovici, Infrared study of attapulgite and HCl treated attapulgite, Clays Clay Miner. 21 (1973) 115–119.
[29] A. Khalfi, E. Papirer, H. Balard, H. Barthel, M.G. Heinemann, Character-ization of silylated silicas by inverse gas chromatography: modelCharacter-ization of the poly(dimethylsiloxane) monomer unit/surface interactions using poly(dimethylsiloxane) oligomers as probes, J. Colloid Interface Sci. 184 (1996) 586–593.
[30] J.B. Donnet, H. Balard, N. Nedjari, B. Hamdi, H. Barthel, T. Gottschalk-Gaudig, Influence of specific surface area of pyrogenic silicas on their heat of immersion in water and on their surface properties assessed using inverse gas chromatog-raphy, J. Colloid Interface Sci. 328 (2008) 15–19.
[31] E. Papirer, H. Balard, C. Vergelati, Surface Energetics of silica Investigated by Inverse Gas Chromatography, in: Surfactant Science (Ed.), Adsorption on Silica Surfaces, vol. 90, Marcel Dekker Inc, New York, 2000, pp. 205–242 (Chapt.I.7).
![Fig. 1. Crystal structure of attapulgite [21].](https://thumb-eu.123doks.com/thumbv2/123doknet/12518763.341695/4.892.126.389.118.325/fig-crystal-structure-of-attapulgite.webp)