HAL Id: hal-01090552
https://hal.inria.fr/hal-01090552
Submitted on 3 Dec 2014
HAL is a multi-disciplinary open access
archive for the deposit and dissemination of
sci-entific research documents, whether they are
pub-lished or not. The documents may come from
teaching and research institutions in France or
abroad, or from public or private research centers.
L’archive ouverte pluridisciplinaire HAL, est
destinée au dépôt et à la diffusion de documents
scientifiques de niveau recherche, publiés ou non,
émanant des établissements d’enseignement et de
recherche français ou étrangers, des laboratoires
publics ou privés.
Efficient Multi-Objective Optimisation of Service
Compositions in Mobile Ad hoc Networks Using
Lightweight Surrogate Models
Dionysios Efstathiou, Peter Mcburney, Steffen Zschaler, Johann Bourcier
To cite this version:
Dionysios Efstathiou, Peter Mcburney, Steffen Zschaler, Johann Bourcier. Efficient Multi-Objective
Optimisation of Service Compositions in Mobile Ad hoc Networks Using Lightweight Surrogate Models.
Journal of Universal Computer Science, Springer, 2014, 20 (8), pp.20. �hal-01090552�
Efficient Multi-Objective Optimisation of Service
Compositions in Mobile Ad hoc Networks Using
Lightweight Surrogate Models
Dionysios Efstathiou, Peter McBurney, Steffen Zschaler (Department of Informatics, King’s College London, UK
[email protected], [email protected], [email protected]) Johann Bourcier
(IRISA, University of Rennes 1, France [email protected])
Abstract: Infrastructure-less Mobile Ad hoc NETworks (MANETs) and Service-Oriented Architecture (SOA) enable the development of pervasive applications. Based on SOA, we can abstract devices’ resources as software services which can be combined into value-added composite services providing complex functionalities while exhibiting specified QoS properties. Configuring compositions with optimal QoS is challenging due to dynamic network topologies and availability of resources. Existing approaches seek to optimise the selection of which services to participate in a centralised orchestration without considering the overhead for estimating their combined QoS. QoS metrics can be used as fitness functions to guide the search for optimal compositions. When com-posing services offered by diverse devices, there is no trivial relationship between the composition’s QoS and its component services. Measuring the fitness values of a candi-date composition could be done either by monitoring its actual invocation or simulating it. However, both approaches are too expensive to be used within an optimisation pro-cess. In this paper, we propose a surrogate-based multi-objective optimisation approach for exploring trade-off compositions. The evaluation results show that by replacing the expensive fitness functions with lightweight surrogate models, we can vastly accelerate the optimisation algorithm while producing trade-off solutions of high quality. Key Words: Service composition, optimisation, surrogate models
Category: D.2.2, D.2.11
1
Introduction
Mobile devices such as smart-phones and tablets are progressively replacing PCs and laptops for web-access [van der Meulen and Rivera, 2014]. Modern mobile devices are equipped with a wide range of built-in sensors, fast proces-sors, and networking capabilities. Due to the amount of offered features, these devices present great potential for creating ubiquitous applications by forming self-configuring ecosystems of collaborating devices. In such applications, the device-to-device communication is based on infrastructure-less Mobile Ad hoc NETworks (MANETs) [Corson and Macker, 1999] which are peer-to-peer net-works with no central control entity or pre-existing networking infrastructure. Within such networks, devices, or in general computation nodes, move freely and
may join or leave the MANET at any time. Data exchange is realised in a multi-hop fashion using intermediate nodes as relays [Corson and Macker, 1999]. In recent years, MANETs have been used in various domains, including healthcare, emergency management, and smart cities [libelium, 2013].
Service-Oriented Architectures (SOA) promote node-to-node collaboration by abstracting nodes’ available resources as loosely coupled software services. Ser-vices are designed based on the important property of composability [Huhns and Singh, 2005] where individual services can be combined into value added compo-sitions. Service composition provides functionality that none of the component services could provide by itself [Papazoglou and Georgakopoulos, 2003].
While service composition offers a nice programming abstraction for aggre-gating loosely-coupled services, designing compositions with the desired func-tionality and optimal Quality of Service (QoS) properties, such as response time and energy consumption, is a very challenging task [de Oliveira Jr. and de Oliveira, 2011]. On the one hand, the highly heterogeneous nodes participat-ing in a MANET offer services with varyparticipat-ing QoS levels. On the other hand, the inherent dynamism present in such networks causes QoS levels to be highly fluctuating. Our goal is to enable the exploration of composition configurations which are optimal in terms of multiple QoS metrics. However, there may be a large number of equivalent service compositions with the same functionality, but with different QoS. Note that the size of the search space increases with the size of the considered service-based network. Using an exhaustive search for exploring a set of trade-off solutions is infeasible.
Multi-Objective Evolutionary Algorithms (MOEAs) are able to search large spaces and return a set of near-optimal solutions at any-time. QoS metrics are ideal to be used as fitness functions for guiding the search for optimal service compositions [Harman and Clark, 2004]. However, estimating the QoS of a can-didate service composition is not trivial especially in the case of distributed service-based MANETs. In traditional approaches, the QoS of a composition is estimated either by simulating or by actually invoking the composition and mon-itoring the underlying system. However, both approaches are computationally expensive requiring minutes or even hours for a single evaluation, thus making impractical their application in the search process of MOEAs.
State-of-the-art service composition optimisation approaches use synthetic functions for simulating services’ QoS [Canfora et al., 2005; Rosenberg et al., 2010]. Other studies use one-time measurements of services’ QoS which are as-sumed to remain static during the life-cycle of the composed service [Mabrouk et al., 2009; Zheng et al., 2011].
We propose the use of lightweight surrogate models in a traditional MOEA to accelerate the exploration of (near-) optimal service compositions. The main contributions of our study are the following:
– We present low cost statistical models for predicting the service com-positions’ QoS in the context of a fire-fighting pervasive application. The results show that the developed models provide accurate predictions with little computational effort and by exploiting limited predictive information. – We introduce a multi-objective optimisation approach to efficiently explore (near-) optimal service compositions. We use the popular NSGA-II algorithm [Deb et al., 2000] and replace the expensive simulation-based fitness functions with statistical models which act as surrogates for guiding the search for optimal solutions. Our experimental results indicate that the developed surrogates can guide NSGA-II to high quality solutions. This paper significantly extends our previous work in [Efstathiou et al., 2014] by considering the services response time and presenting the process of building and assessing the developed surrogate models.
The remainder of this paper is structured as follows: Section 2 presents the motivation and the optimisation problem of our research. Section 3 discusses the background on building surrogate models and evolutionary optimisation. Section 4 describes our surrogate-assisted approach for tackling the defined op-timisation problem. Section 5 describes the methodology used in our experimen-tal study. Section 6 presents the results of our study followed by section 7 which discusses related work. Finally, section 8 presents conclusions and future work.
2
Motivating Scenario
We consider a service-based system for improving the decision making of Fire-Fighters (FFs) in an emergency situation [Efstathiou et al., 2013]. In this scenario, FFs are equipped with mobile devices which form a mobile MANET. Following SOA principles, devices offer their resources (e.g. data, network and hardware components) as software services. Service composition promotes the creation of complex applications by combining services offered by different devices. Below we describe the services and devices involved in our scenario.
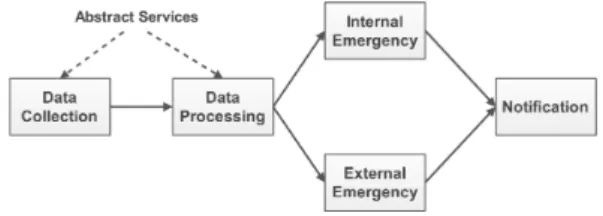
Scenario Services Consider the forest fire emergency situation where a commanding FF uses periodically a composite application to infer whether a FF is in danger to take appropriate measures if necessary. More specifically, the commanding FF aggregates information about the condition of his subordinates such as position, heart rate, and oxygen level. This information need to be fed into a processing service which assesses if there is a potential danger. In the case of an emergency event (e.g. a FF has stopped moving and high levels of carbon dioxide in the blood are observed), another FF team in the close proximity must be notified to intervene (e.g. by sending directions to a rescue team) along
with a medical team ready to approach. Finally, the various decisions and the situation events are logged to the FF department’s database which may respond with a set of recommended actions to be taken. The above service composition is depicted in figure 1 and involves the invocation of the following services: data collection, processing, internal emergency, external emergency, and notification.
Figure 1: The workflow of the example composite application.
Device Heterogeneity Table 1 presents the characteristics of the various de-vices participating in the considered FF scenario. In detail, we classify the dede-vices based on their processing power into fast, medium and slow devices.
We assume that a service provided by a node with a fast CPU will perform better than the same service running on a node with a slower CPU. Apart from CPU speed, device’s load plays an important role in determining the response time of a service running on a specific device. Similarly to the previous classifica-tion, we classify devices based on their load to low, medium and highly loaded. Given two devices with the same CPU speed but with different load, we assume that the service running on the device with the lower load will perform better.
In such a dynamic and time-critical scenario where computational and battery resources are limited, composite applications should exhibit specific QoS such as minimum response time and battery consumption. However, services’ QoS is influenced by a variety of factors such as topology changes, mobility, resource availability, and others. QoS of a composite application are highly susceptible to changes on the underlying network. The goal of our research is to enable the exploration of composite services exhibiting optimal QoS trade-offs.
User Device CPU RAM Type
Commanding FF ACER Iconia A500 1GHz× 2 Cores 1GB Fast FF Vehicle Raspberry Pi 700MHz 512MB Medium
Field FF IRIS/MICAz 8MHz 8KB RAM Slow
2.1 Problem Formulation
Suppose the abstract plan of a composite application describing a set of Abstract Services (ASs) as illustrated in figure 1. The nodes of the formed MANET offer Concrete Services (CSs) which implement the plan’s ASs. Service orchestrators are responsible for calling the appropriate CSs and forwarding intermediate re-sults to relevant nodes. Our goal is to produce QoS optimal compositions by tun-ing the followtun-ing available parameters of a service composition, called Degrees of Freedom (DoF) [Efstathiou et al., 2013]: (a) selection of CSs, (b) partitioning of the composition into sub-orchestrations, and (c) selection of orchestrating nodes. Definition 1. Distributed Service Orchestration Problem
Given: A set of m ASs creating the composition plan P , a set of n nodes partic-ipating in the network where each node provides a single CS and can coordinate a single orchestration, a mapping of the n available CSs that implement the functionality of the m ASs, and a set of q quality objectives Q ={Q1,· · · , Qq}.
Let a composition plan P be represented as a directed graph consisting of a node set AS = ⟨AS1, AS1,· · · , ASn⟩ of ASs and an edge set DF =
⟨(ASi, ASj) : i̸= j, 1 ≤ i ≤ n, 1 ≤ j ≤ n⟩ of data flow between ASs, where ASi
is the source and ASj the data destination.
Problem: Find a set of service composition configurations which implement the functionality described by P and are optimal according to Q.
2.2 QoS Metrics - Fitness Functions
Fitness functions measure the quality of a solution and guide the search pro-cess for finding the optimal ones. In Search-Based Software Engineering (SBSE) problems [Harman et al., 2012], QoS metrics are ideal to be used as fitness func-tions for searching optimal software architectures [Harman and Clark, 2004]. We use the following QoS metrics for estimating the quality of a composite service: – Response time QRT is the time from when a user issues a request until the
user receives the result. QRT is affected by: the network round trip time
(RTT) of the exchanged messages on the underlying network; the request processing time (RTS) a service provider needs to process a request; and the orchestration time (OT) for coordinating the execution of a set of services. – Energy consumption QEC of a configuration, which is the energy difference
observed in the nodes for realising a service composition configuration where nodes spent energy for: sending/receiving data, and orchestrating other ser-vices. They also spend energy for service execution, but this is independent of the configuration; therefore we can safely ignore it.
– Service reliability QSR is the ratio of successfully to total exchanged data
2.3 Simulation Settings
We use NS-31 to simulate our scenario where firefighters of three hierarchical
levels (Group, Engine, and Team) carry devices which form an infrastructure-less MANET and offer services. More specifically, we simulate a network of 84 mobile nodes (4 Group Leaders, 16 Engine Leaders, and 64 Team Leaders/Members) with transmission range of 45m distributed in a area of 500m×500m. Each group follows a different mobility model because each group has a different purpose and mission to fulfil. To ensure that the network is completely configured before simulating a composition configuration we included a set-up/warm-up time of 20 seconds. For more details about the chosen mobility, network and routing parameters, please refer to our previous work in [Efstathiou et al., 2013].
2.4 The Need for Surrogate-Assisted Stochastic Optimisation Suppose that we want to find a set of optimal compositions for an abstract workflow of 6 ASs as shown in figure 1. Consider that each of the 84 networking nodes provides a CS, and can play the role of an orchestrator. In our example, assume the following mapping between abstract and concrete services ASi =
{4, 10, 20, 20, 20, 10}, which means that AS1 is implemented by 4 CSs, AS2 by
10 CSs, and so on. Assuming that we are free to choose any equivalent CS for implementing the corresponding AS, this results to a total of 4× 10 × 20 × 20 × 20× 10 = 3.2 · 106 possible service composition configurations.
The execution time for evaluating the QoS metrics of a single composition is
∼ 3 minutes using a powerful machine with Intel Core i7 vPro with 12GB DDR3
RAM. This means that a full enumeration of the search space of the 3.2· 106
service compositions is infeasible as it would take∼ 89 months of CPU time. MOEAs seem unaffordable in our problem due to the high computational cost of the fitness functions which has a critical impact on the overall complexity of the search algorithm [Harman and Clark, 2004]. For example, suppose that using a MOEA requires 103 fitness function evaluations which would take∼ 50 CPU hours which is still infeasible for the time limitations of our scenario.
There are two main solutions for reducing the computation cost of a MOEA [Jin, 2005]. The first is to reduce the algorithm complexity of the MOEA which does not seem promising as the main overhead is due to the complex na-ture of the tackled problem. The second approach is to reduce the computational cost by approximating the fitness functions used for guiding the search process of the MOEA. To achieve this, functional approximation [Jin, 2005] proposes the replacement of the real computationally expensive fitness functions with cheaper alternatives called surrogate models. These surrogate models can be used by the
MOEA to evolve the population of individuals at a smaller computational cost than that of the real fitness functions.
3
Background Overview
In this section we present the necessary background about surrogate models and evolutionary optimisation.
3.1 Surrogate Models
Surrogate models are statistical models built to approximate computationally expensive functions. This model acts as a fit to the available training data so that unknown data points can be predicted without calling the modelled function [Jin, 2011]. The real fitness function f (x) can be represented as y = f (x), where
x is the vector of design parameters and y is the QoS value of the service
com-position. Then, a surrogate model is of the following formby = bf (x) = f (x) + ϵ,
where ϵ is the approximation error. Regression analysis [Hastie et al., 2003] is a simple and intuitive method for constructing such models. A representative set of regression techniques in the machine learning literature is described below.
Linear Regression (LR) [Hastie et al., 2003] assumes a linear relationship
be-tween the response Y and the predictor variables X1, X2,· · · , XN. The process
of building a linear model is called Model Selection which refers to the process of choosing the model with the appropriate complexity for the data.
Multivariate Adaptive Regression Splines (MARS) [Hastie et al., 2003] are
piecewise models which are formed by joining together two or more truncated linear functions in distinct intervals of the predictors variables. There is a smooth transition from one function to the next. In general, these linear functions are polynomial curves which can be of any degree, typically cubic. Splines are suit-able for modelling any smoothly changing response varisuit-able.
Classification and Regression Trees (CART) [Hastie et al., 2003] are tree-based
models used for both classification and regression applications. CARTs are rep-resented by a set of questions which split the initial training sample into smaller and smaller parts.
Random Forest (RF) [Hastie et al., 2003] is an ensemble model which combines
the results of multiple decision tree models and it is based on the same idea with bagging. In bagging many bootstrap samples are drawn from the initial data set which are used to build a prediction model, in this case a decision tree. To perform a prediction, the results of all the trees are combined by averaging which reduces the variance of the overall prediction.
3.2 Stochastic Optimisation
Evolutionary Algorithms (EAs) are based on biologically-inspired mechanisms such as crossover, mutation, and selection, to evolve a population of individuals which smartly explores a solution space. Each individual is a candidate solution and is represented by a chromosome. A chromosome is consisting of genes. Genes are analogous to the variables of the problem which are encoded based on its nature (e.g. integer or real values). A chromosome is a vector of features (degrees of freedom) which constitute a candidate solution. Chromosomes can be strings, permutations, sets or any other data structure. Any EA is defined by a suitable representation, a set of genetic operators, and one or more fitness functions.
Non-dominated Sorting Genetic Algorithm (NSGA-II) [Deb et al., 2000] is the most popular EA with a large number of applications and is based on two core ideas: Pareto ranking, and crowding distance. Pareto ranking sorts the current population into fronts of non-dominated solutions based on their Pareto domi-nance. This ranking penalises solutions in regions of the objective space which are dominated by many others, forcing the exploitation of the best population members. Secondly, crowding distance measures the population density around a solution and aims at maintaining diversity within the population. It is used to break ties between individuals with the same rank in the selection phase of NSGA-II where solutions with larger crowding distance are preferred.
4
The Surrogate-Assisted Optimisation Approach
In this section, we describe our approach for exploring (near-) optimal service compositions. To build our search-based approach we need to define the fol-lowing two ingredients: a problem representation, and the appropriate fitness functions for guiding the search. For fitness functions, we propose the replace-ment of the computationally expensive “real” simulation-based fitness functions with efficient surrogate models described in the previous section.
4.1 Defining the Design Space
We first define the space of service composition configurations. The work in [Efstathiou et al., 2013] showed that by taking into account multiple DoFs for tuning the quality of a composite service, we can define a solution space of higher quality than the traditional orchestration which considers only the DoF of ser-vice selection. In detail, we have proposed the following three parameters for tuning the quality of a service composition configuration: service selection, or-chestration partitioning, and orchestrator node selection. We call a composition configuration a solution. The set of all possible solutions is the set of all possible combinations of the defined DoFs, or in other words the defined design options.
4.2 The Optimisation Algorithm
We employed the popular NSGA-II algorithm for exploring trade-off composite services. To apply the NSGA-II algorithm in our problem, we have to define the following building blocks: solution representation, genetic operators, and fitness functions, which are described in the subsections below.
Solution Representation The service composition chromosome consti-tutes a container for further chromosomes. The genotypes exhibit variable lengths due to the fact that the number of sub-orchestrations can be varied between one (centralised orchestrator) and m (fully decentralised orchestration).
(a) (b) (c)
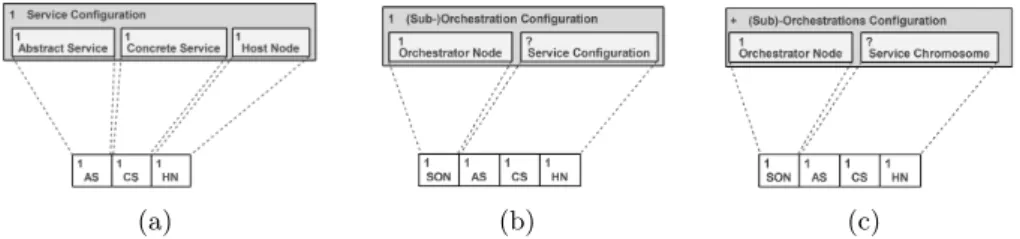
Figure 2: Chromosome representations for: (a) mapping concrete to abstract services, (b) sub-orchestrations, and (c) composition configuration.
We represent a candidate solution as a three-fold assignment of (i) concrete services to abstract services, (ii) abstract services to sub-orchestrations and (iii) network nodes to orchestrator nodes. Figure 2(a) shows the chromosome for mapping concrete services to abstract services. The chromosome for representing a sub-orchestration is depicted in figure 2(b). Finally, a complete configuration can be represented as a set of sub-orchestration chromosomes as denoted by the + sign in the upper left corner of the box shown in figure 2(c). The grey box indicates the chromosome, while the white boxes represent the genes that compose the chromosome. The signs 1, + and ? represent the repetition of a gene or chromosome exactly once, at least once, and at most once respectively.
An example chromosome representation for a complete composition configuration is depicted in figure 3. In this example, we have two sub-orchestrations which are hosted on nodes (SON) 2 and 4 respectively. The first sub-orchestration includes the abstract services 1 and 2, while the second orchestrates the services 3, 4 and 5. For implementing the abstract service 1 (AS), the concrete service 12 (CS) was selected which is hosted at node 2 (HN).
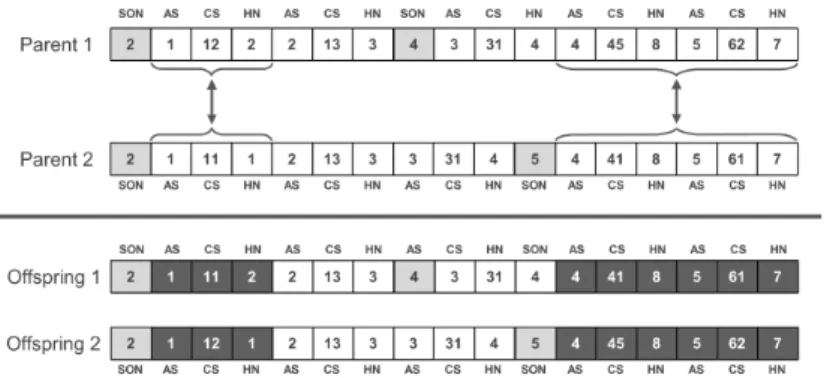
Genetic Operators The design of genetic operators is the second key element for constructing any MOEA. The chosen varied size representation complicates the implementation of genetic operators. For each of the three considered DoFs, we designed a pair of crossover and mutation operators, resulting to a total of 6 operators. Crossover ensures that features of the parents will be passed to the offspring forcing the convergence on the good solutions found so far (exploitation). For example, the single-point crossover for the first DoF, produces a new configuration by combining the concrete services mappings of two parents as depicted in figure 4.
Figure 4: An example crossover operation for the first DoF.
For the second DoF, two parent solutions are combined by swapping sub-orchestrations. The crossover operator for the last DoF, creates an offspring by combining the list of orchestrators of the parent configurations.Mutation ensures that any possible configuration can be searched which increases the exploration of the space and aims at maintaining diversity by avoiding to over-bias to fittest individuals. For instance, the mutation operator for the first DoF chooses ran-domly a concrete service for implementing an abstract service. The operators were designed to allow the modification of solutions to reach any area of the space while guaranteeing that the changed configuration is a valid one.
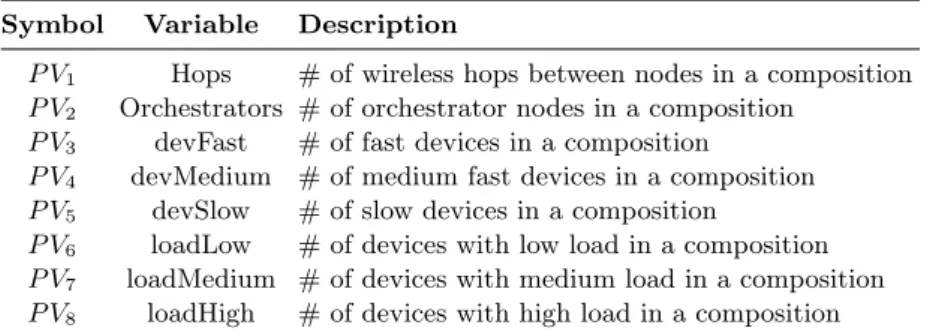
Symbol Variable Description
P V1 Hops # of wireless hops between nodes in a composition
P V2 Orchestrators # of orchestrator nodes in a composition
P V3 devFast # of fast devices in a composition
P V4 devMedium # of medium fast devices in a composition
P V5 devSlow # of slow devices in a composition
P V6 loadLow # of devices with low load in a composition
P V7 loadMedium # of devices with medium load in a composition
P V8 loadHigh # of devices with high load in a composition
Table 2: Variables for predicting the QoS metrics of composite applications.
4.3 Creating a Surrogate Fitness Function
By constructing a surrogate model our goal is to predict the QoS of a composite service where service users and providers communicate over a wireless multi-hop MANET. First, we need to determine the p factors (predictor variables) which may affect the QoS metrics (response variables) described in section 2.2.
We develop models by using regression analysis techniques for predicting the QoS of composite services in MANET environments. The models are trained on datasets taken by simulating the studied use-case scenario. In this section, we present the data gathering approach, the considered responses and predictor variables as well as our model comparison methodology. Our goal is to find the technique with the best performance on the studied problem.
4.3.1 Predictor Variables
We consider the seven predictor variables (p = 8) shown in table 2. These pre-dictors are not the only ones which we could use for our study. We have chosen these particular predictors for our analysis because it was comparatively cheap to obtain the relevant data for them. For example, the information about the hop distance between a pair of nodes in a network is already provided by the underlying routing layer (e.g. OLSR [Jacquet et al., 2001]) which is responsible for discovering and maintaining communication routes within a wireless multi-hop network. On the other hand, calculating the link interference at a node is a much more complicated and expensive process [Zhou and Zhuang, 2013].
4.3.2 Model Selection
When solving a prediction problem there is a wide range of available prediction models to choose from. Each model may have many sub-models which are de-fined by tuning their parameters. A candidate model is dede-fined by two degrees
of freedom: the set of predictor variables in the model, and the model param-eter values. In other words, our goal is to select the predictor variables and parameter values which maximise the predictive power of the regression model.
Model Selection concerns the selection of the best prediction model based on
some performance metrics which is usually the prediction error of the model on an independent validation set which was not used for training the model. For each of the four regression techniques, we select the model with the maximum predictive power among all the possible candidate models.
Variable selection is intended to select the “best” subset of predictors
vari-ables. Given that we consider 8 predictor variables as shown in table 2, this results to a total of 256 possible combinations of predictor variables with sub-sets ranging in size from single, to the set of all available predictor variables. As the number of possible combinations is not too large, we performed an exhaus-tive search to guarantee that we determine the optimal set of predictor variables for the considered regression models. In each model size class p = 1, 2,· · · , 8 the model with the smallest root mean squared error was chosen as a candidate model for the final step of model selection.
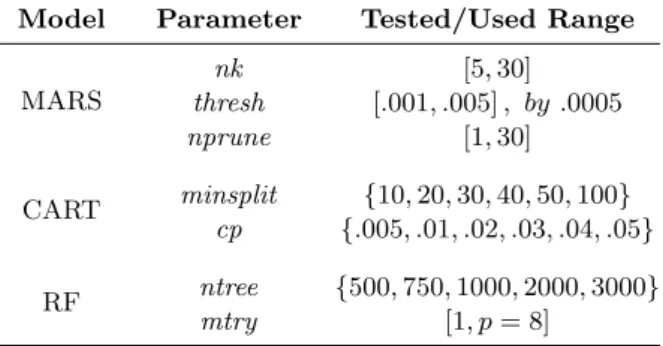
When building a regression model like MARS, CART, and RF, a number of parameters must be tuned. Parameter tuning concerns the selection of the optimal parameter settings. The choice of the optimal parameters is done by an exhaustive search of all the possible combinations of the parameters in the ranges shown in table 3. These ranges were chosen based on the characteristics of our prediction problem and on the common parameter settings of the considered regression techniques. We select for each technique the parameter setting which results in the minimum root mean squared error.
Model Parameter Tested/Used Range
MARS nk [5, 30] thresh [.001, .005] , by .0005 nprune [1, 30] CART minsplit {10, 20, 30, 40, 50, 100} cp {.005, .01, .02, .03, .04, .05} RF ntree {500, 750, 1000, 2000, 3000} mtry [1, p = 8]
4.3.3 Model Assessment
This step is carried out after model selection and aims at acquiring an objective judgement of the generalisation performance of the compared approximation models. The models are trained using the complete dataset used in the Model Selection step (training and validation sets). To acquire an objective estimation of the prediction performance of the compared models, we use an independent test set. The aim of this comparison is to select the model which performs best in new data, or in other words, minimises the prediction error.
5
Experimental Validation
Our experimental study aims to answer the following research questions: – RQ1 Which is the best performing surrogate model in terms of prediction
accuracy outside the training set?
– RQ2 Can the developed surrogates replace the simulation-based functions within the evolutionary algorithm for exploring good optimal solutions? – RQ3 How much do we gain in terms of computational cost and how much
do we lose in terms of optimality by using a light-weight surrogate model instead of the real expensive fitness function?
5.1 Methodology
We used R to evaluate the surrogate models mentioned above. The train-ing dataset was collected by ustrain-ing a simulation-based approach as we do not have the resources for performing real-world experiments of the studied scenario.
Prediction Quality Metrics To evaluate model quality we use four metrics [Hastie et al., 2003]: coefficient of determination R2, Mean Absolute
Error (MAE), Mean Squared Error (MSE), Root Mean Squared Error (RMSE), and Mean Absolute Percent Error (MAPE). Errors over large and small values are not weighted by using the previous error metrics. MAPE is a measure of how high or low are the differences between predictions and actual data.
For the optimisation part of our prototype we used the MOEA Framework2.
We took advantage of the elasticity provided by Amazon Elastic Compute Cloud (EC2) for executing the computationally-expensive experiments including the simulation-based fitness functions. The NSGA-II algorithm evolved a population of 96 configurations for 30 generations. After some tuning, we resulted with the following parameters for our problem: 95% crossover rate, 5% mutation rate.
2
Optimisation Quality Metrics To quantitatively compare the perfor-mance of NSGA-II for the cases of the expensive and surrogate fitness functions we employ four quality indicators, namely Hypervolume (IHV), Cardinality
(IC), Spread (∆) and Generational Distance (IGD) [Deb et al., 2000; Zitzler
et al., 2008]. Cardinality measures the number of optimal solutions in a Pareto set approximation. It is cheap to compute but is not compatible with the Pareto dominance relation. IHV calculates the volume of the objective space
which is weakly dominated by an approximation set and is the only unary indicator known to be strictly monotonic [Zitzler et al., 2008]. The higher the hypervolume, the better the quality of the approximation set. ∆ is a diversity metric which measures how evenly the points in the approximation set are distributed in the objective space. Smaller spacing indicates better population spread. IGD measures how far is the solutions in the approximation set from
the reference set which represents the best possible Pareto set.
To compute these indicators, we normalised fitness values to avoid unwanted scaling effects based on ideal and utopia points in the union of all approxima-tion sets achieved by all approaches in comparison [Joshua Knowles and Zitzler, 2006]. Similarly, we computed a reference set by determining the set of non-dominated solutions in this union set.
5.2 Statistical Analysis
In evolutionary optimisation the relationship between quality of resulted solu-tions and required resources is not fixed, but can be described probabilistically. If we apply the same algorithm several times to the same problem, each time a different set of (near-) optimal solutions may be returned. To obtain reliable con-clusions about the performance of the inherently stochastic MOEAs, we repeat each algorithm 30 times and collect the values of the studied quality indicators. A statistical test is used to assess whether the observed differences between compared algorithms are statistically significant [Arcuri and Briand, 2011]. We use a non-parametric Mann-Whitney test to evaluate statistical significance be-cause we have no information about the distribution of the data.
6
Results and Discussions
Results for RQ1 To determine the most appropriate surrogate model for our
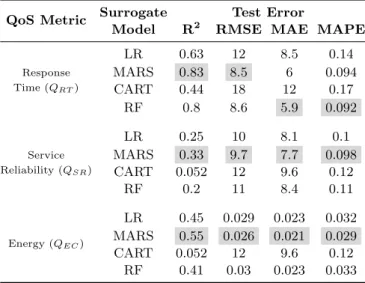
problem, we compare them according to their accuracy which is the ability of the model to closely predict the response variables. Table 4 presents the results for the four prediction metrics R2, RMSE, MAE, and MAPE of the four models in comparison (LR, MARS, CART, and RF). The results are based on a hold-out 10-fold cross-validation technique [Hastie et al., 2003].
QoS Metric Surrogate Test Error
Model R2 RMSE MAE MAPE
Response Time (QRT) LR 0.63 12 8.5 0.14 MARS 0.83 8.5 6 0.094 CART 0.44 18 12 0.17 RF 0.8 8.6 5.9 0.092 Service Reliability (QSR) LR 0.25 10 8.1 0.1 MARS 0.33 9.7 7.7 0.098 CART 0.052 12 9.6 0.12 RF 0.2 11 8.4 0.11 Energy (QEC) LR 0.45 0.029 0.023 0.032 MARS 0.55 0.026 0.021 0.029 CART 0.052 12 9.6 0.12 RF 0.41 0.03 0.023 0.033
Table 4: Accuracy metrics of the regression techniques (a higher R2 and a smaller RMSE, MAE, or MAPE value is desired).
Among the compared models, M ARS obtains smaller prediction error for almost all the considered QoS metrics for the cross-validation tests. M ARS is followed very closely by RF especially for the case of QRT where RF slightly
outperforms M ARS for the MAE and MAPE metrics, while CART has the worst performance. M ARS outperform the tree-based techniques (CART , RF ) by having ∼ 35% lower test-error. For the QSR and QEC QoS metrics, LR
outperforms CART and RF . Despite RF ’s additional complexity as an ensemble technique it achieves lower predictive performance than MARS for most of the cases. RF does, however, outperform CART as expected.
We observe that the considered models exhibit the poorest performance for the QSR metric. This may be due to the fact that this QoS metric is affected
by other factors which we did not consider as potential predictor variables. Our intuition suggests that the probability of successful packet transmission is based on factors more costly to acquire or measure such as signal-to-noise ratio, interference estimation, and others [Baumann and Heimlicher, 2007].
Results for RQ2 In RQ1, we studied the predictive performance of the proposed surrogate models applied on external test sets. When evaluating surrogate models to be used within a MOEA, we need to assess the ability of the developed models to guide the search towards good areas of the service composition configuration space. With regards to RQ2, we first run the NSGA-II algorithm with the simulation-based fitness function. Then, we
Fitness IHV IC ∆ IGD
Function Mean σ Mean σ Mean σ Mean σ
Expensive 0.925 ± 0.02 48.167 ± 13.52 0.656 ± 0.07 0.047 ± 0.01 LR 0.937 ± 0.04 51.5 ± 17.28 0.785 ± 0.11 0.049 ± 0.01 MARS 0.958 ± 0.03 44.056 ± 13.23 0.881 ± 0.11 0.046 ± 0.01 CART 0.663 ± 0.03 14.167 ± 3.72 0.72 ± 0.13 0.124 ± 0.02 RF 0.761 ± 0.03 18.278 ± 7.53 0.693 ± 0.08 0.086 ± 0.02
Table 5: Quality indicators of expensive and surrogate fitness functions.
replace the expensive fitness functions with the surrogate models during the evolution of the MOEA. At the last generation of the MOEA, we compute the simulation-based QoS metric values on the explored Pareto individuals. Table 5 presents the results for the four performance assessment indicators obtained for 30 runs and the mean values with their standard deviations are reported.
Table 5 show that by using the surrogate models LR and MARS, not only the computational burden can be greatly reduced but also solutions of higher quality can be explored due to the “bless of uncertainty” [Lim et al., 2010; Ong et al., 2006]. ‘Bless of uncertainty” refers to the uncertainty introduced by pre-diction errors in the surrogate models which may not be always bad but it may be beneficial by accelerating the evolutionary search to converge towards good optimal solutions. For the IC indicator, LR achieves the best results due to its
ability to assign different QoS values by doing fine-grain predictions based on slightly different predictor values. Tree-based approaches, like CART and RF, seem unable to provide fine-grain differentiation of solutions. These approaches try to handle the trade-off between building a big tree with many leaves for describing a specific training set (overfitting) and generalisation of performance. The H0 for RQ2 states that the approaches using the expensive and
surrogate fitness functions produce Pareto solutions of the same quality. It is rejected by the Mann-Whitney test at 1% significance level. The p-values for the four pairs (expensive against each of the surrogate models) of tech-niques in comparison are 9·10−3, 5.9·10−4, 1.6·10−7, and 1.6·10−7respectively.
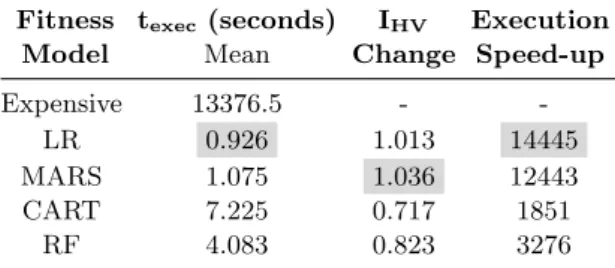
Results for RQ3 We now study the trade-off between the computa-tionally expensive simulator-based and cheap surrogate models fitness functions . For that reason, we present in the first column of table 6 the execution time for evaluating the QoS metrics of a population of service composition configura-tions. In the second column of table 6, we show the change in the hypervolume indicator of the approach using the surrogate model in relation to the approach using the expensive functions computed as the ratio HVSurrogate
HVExpensive achieved by
Fitness texec (seconds) IHV Execution
Model Mean Change Speed-up Expensive 13376.5 -
-LR 0.926 1.013 14445 MARS 1.075 1.036 12443 CART 7.225 0.717 1851
RF 4.083 0.823 3276
Table 6: Comparing the surrogate models with the expensive fitness function.
1 indicate an improvement in optimisation quality. The last column of table 6 presents the execution speed-up achieved by the optimisation algorithm using the various surrogate models in contrast to the expensive fitness functions during a generation of the NSGA-II algorithm. The values of this column are calculated as the ratio tExpensive
tSurrogate. Note that the one-time upfront cost of
building the model is negligible and it is not reported (< 5 seconds for all the models). In our scenario the prediction models can be built by servers located in the FF department and can be exported to any device in the network. The experiments reported in table 6 were executed on R running on an Intel Core i7 vPro with 12GB DDR3 RAM. We also executed the best performing models LR and MARS on a Raspberry Pi and observed 19.6 and 29.4 seconds of execution time respectively which is within the time constraints of the considered system. We look for models that balance predictive quality against their execution time. It is obvious that, due to its simplicity LR achieves the largest speed-up and also very good results in terms of hypervolume when compared to the approach using the expensive fitness functions. MARS appears to be the best performing technique and its speed-up is comparable to the simple LR technique.
CART is the most time-consuming model which may be caused the complexity
of the decision rules and the depth of the developed tree model. It is worth noting that all of the reported model build times are small compared to the time needed for running the expensive fitness function for a single service composition configuration (∼ 3 minutes) in the context of our studied motivating scenario.
7
Related Work
We classify the related work into two groups: QoS prediction in MANETs, and QoS prediction of single and composite services. In the first group, in a highly influential work [Ferreira and Helberg, 2009] the authors developed a wireless testbed for measuring how various factors can affect QoS metrics. Other stud-ies in this area used machine learning techniques for predicting the QoS in a MANET. For example, Guo et al. [Guo et al., 2010] proposed the use of neural
networks for predicting the end-to-end delay between a pair of communicating nodes. Towards predicting the same metric, Singh et al. [Singh et al., 2012] pro-posed the use of a fuzzy logic-based prediction model. However, these studies focus on predicting the latency between a pair of nodes without considering the more complex interaction patterns which emerge within a service-based system. In the second group, the authors in [Marzolla and Mirandola, 2007] proposed a prediction approach for providing performance bounds based on various work-loads by using Queueing Network analysis. Focusing on estimating the reliability property of a service composition, Gallotti et al. [Gallotti et al., 2008] proposed probabilistic model checking technique. Di Marco and Sabetta [Di Marco and Sa-betta, 2010] proposed a model-based framework towards automatic construction of composite services to support automated SLA negotiation and SLA-driven service reconfiguration. Their approach exploits rich service descriptions con-taining information about their provided QoS. Zheng et al. [Zheng et al., 2011] proposed a collaborative filtering approach for predicting QoS values of Web services based on past experiences of service users. Wang et al. [Wang et al., 2013] proposed a prediction-based approach towards maintaining the desired levels QoS of a service composition during execution. However, the mentioned approaches focus on predicting the QoS of composite services based on past QoS data of component services ignoring how these services are combined together. Also, they assume that past QoS measurements remain static during the whole life-cycle of the composed service which is unrealistic for the considered highly dynamic environments. Moreover, they focus on traditional web services offered via wired and resource-rich networks.
8
Conclusions and Future Work
We described a surrogate-assisted multi-objective optimisation approach for ex-ploring optimal service compositions within a service-based MANET. We pro-posed the use of statistical models as fitness functions To overcome the computa-tional overhead by the simulation-based fitness functions, for exploring optimal service composition configurations. Our experimental results show that surro-gates can vastly accelerate the execution time and still guide the evolutionary search into exploring solutions of high quality.
An interesting point for further study is the effect of applying the service com-positions explored by the MOEA with the various surrogate models throughout the lifetime of the system. This would give us an insight about which models are better on choosing configurations which have long-term beneficial effects for the system and which are acting in a more short-term and greedy way.
Acknowledgements This work has been supported by the European
FP7 Marie Curie Initial Training Network “RELATE” (Grant Agreement No. 264840).
References
Arcuri, A., Briand, L. C.: “A Practical Guide for Using Statistical Tests to Assess Randomized Algorithms in Software Engineering”; ICSE; 2011.
Baumann, R., Heimlicher, S.: “A Survey on Routing Metrics”; (2007).
Canfora, G., Di Penta, M., Esposito, R., Villani, M. L.: “An Approach for QoS-Aware Service Composition Based on Genetic Algorithms”; GECCO; 2005. Corson, S., Macker, J.: “Mobile Ad Hoc Networking (MANET): Routing
Proto-col Performance Issues and Evaluation Considerations”; (1999).
de Oliveira Jr., F. G. A., de Oliveira, J. M. P.: “QoS-based Approach for Dy-namic Web Service Composition”; J. UCS; 17 (2011), 5, 712–741.
Deb, K., Pratap, A., Agarwal, S., Meyarivan, T.: “A Fast Elitist Multi-Objective Genetic Algorithm: NSGA-II”; IEEE Trans. Evol. Comp.; 6 (2000), 182–197. Di Marco, A., Sabetta, A.: “Model-based Dynamic QoS-driven Service
Compo-sition”; 2nd QUASOSS; 5:1–5:6; 2010.
Efstathiou, D., McBurney, P., Zschaler, S., Bourcier, J.: “Flexible QoS-Aware Service Composition in Highly Heterogeneous and Dynamic Service-Based Systems”; 9th IEEE International Conference on Wireless and Mobile Com-puting, Networking and Communications (WiMob); 2013.
Efstathiou, D., McBurney, P., Zschaler, S., Bourcier, J.: “Surrogate-Assisted Optimisation of Composite Applications in Mobile Ad-hoc Networks”; Proc. ACM International Genetic and Evolutionary Computation Conference (GECCO); 2014.
Ferreira, M., Helberg, A. S.: “Testbed Validation for the Evaluation of a Delay Aware Routing Metric for Ad Hoc Networks”; SATNAC; (2009).
Gallotti, S., Ghezzi, C., Mirandola, R., Tamburrelli, G.: “Quality Prediction of Service Compositions through Probabilistic Model Checking”; Proc. 4th QoSA; 119–134; 2008.
Guo, Z., Sheikh, S., Al-Najjar, C., Kim, H., Malakooti, B.: “Mobile Ad Hoc Network Proactive Routing with Delay Prediction Using Neural Network”; Wireless Networks; 16 (2010), 6, 1601–1620.
Harman, M., Clark, J.: “Metrics Are Fitness Functions Too”; METRICS; 2004. Harman, M., McMinn, P., Souza, J. T., Yoo, S.: “Search Based Software En-gineering: Techniques, Taxonomy, Tutorial”; Empirical Software Engineering and Verification; volume 7007; 1–59; 2012.
Hastie, T., Tibshirani, R., Friedman, J.: The Elements of Statistical Learning; Springer, 2003.
Huhns, M. N., Singh, M. P.: “Service-Oriented Computing: Key Concepts and Principles”; IEEE Internet Computing; (2005), 75–81.
Jacquet, P., Muhlethaler, P., Clausen, T., Laouiti, A., Qayyum, A., Viennot, L.: “Optimized Link State Routing Protocol for Ad Hoc Networks”; 62–68; 2001.
Jin, Y.: “A Comprehensive Survey of Fitness Approximation in Evolutionary Computation”; Soft Computing; 9 (2005), 1, 3–12.
Jin, Y.: “Surrogate-Assisted Evolutionary Computation: Recent Advances and Future Challenges”; SEC; 1 (2011), 2, 61–70.
Joshua Knowles, L. T., Zitzler, E.: “A Tutorial on the Performance Assessment of Stochastic Multiobjective Optimizers”; TIK Report 214; Computer Engi-neering and Networks Laboratory (TIK) ETH Zurich (2006).
libelium: “50 Sensor Applications for a Smarter World”; (2013).
Lim, D., Jin, Y., Ong, Y.-S., Sendhoff, B.: “Generalizing Surrogate-Assisted Evolutionary Computation”; Trans. Evol. Comp; 14 (2010), 3, 329–355. Mabrouk, N. B., Beauche, S., Kuznetsova, E., Georgantas, N., Issarny, V.:
“QoS-Aware Service Composition in Dynamic Service Oriented Environments”; Middleware; 2009.
Marzolla, M., Mirandola, R.: “Performance Prediction of Web Service Work-flows”; QoSA; 127–144; 2007.
Ong, Y.-S., Zhou, Z., Lim, D.: “Curse and Blessing of Uncertainty in Evolution-ary Algorithm Using Approximation”; CEC; 2928–2935; 2006.
Papazoglou, M., Georgakopoulos, D.: “Introduction: Service-Oriented Comput-ing”; Comm. of ACM; 46 (2003), 24–28.
Rosenberg, F., Muller, M., Leitner, P., Michlmayr, A., Bouguettaya, A., Dustdar, S.: “Metaheuristic Optimization of Large-Scale QoS-aware Service Composi-tions”; SCC; 97–104; 2010.
Singh, J. P., Dutta, P., Pal, A.: “Delay Prediction in Mobile Ad Hoc Network using Artificial Neural Network”; Procedia Technology; 4 (2012), 0, 201 – 206. van der Meulen, R., Rivera, J.: “Gartner Says Worldwide Traditional PC, Tablet, Ultramobile and Mobile Phone Shipments On Pace to Grow 7.6 Percent in 2014”; (2014).
Wang, H., Sun, H., Yu, Q.: “Reliable Service Composition via Automatic QoS Prediction”; SCC; 2013.
Zheng, Z., Ma, H., Lyu, M., King, I.: “QoS-Aware Web Service Recommendation by Collaborative Filtering”; IEEE Trans. Serv. Comp.; 4 (2011), 2, 140–152. Zhou, Y., Zhuang, W.: “Beneficial Cooperation Ratio in Multi-hop Wireless Ad
Hoc Networks”; INFOCOM; 450–454; 2013.
Zitzler, E., Knowles, J., Thiele, L.: “Quality Assessment of Pareto Set Approxi-mations”; Multiobjective Optimization; 373–404; 2008.
![Table 5 show that by using the surrogate models LR and MARS, not only the computational burden can be greatly reduced but also solutions of higher quality can be explored due to the “bless of uncertainty” [Lim et al., 2010; Ong et al., 2006]](https://thumb-eu.123doks.com/thumbv2/123doknet/12482983.338786/17.892.234.687.164.302/surrogate-computational-greatly-reduced-solutions-quality-explored-uncertainty.webp)