HAL Id: hal-01181192
https://hal.inria.fr/hal-01181192
Submitted on 16 Oct 2015
HAL is a multi-disciplinary open access
archive for the deposit and dissemination of
sci-entific research documents, whether they are
pub-lished or not. The documents may come from
teaching and research institutions in France or
abroad, or from public or private research centers.
L’archive ouverte pluridisciplinaire HAL, est
destinée au dépôt et à la diffusion de documents
scientifiques de niveau recherche, publiés ou non,
émanant des établissements d’enseignement et de
recherche français ou étrangers, des laboratoires
publics ou privés.
Probabilistic Speaker Pronunciation Adaptation for
Spontaneous Speech Synthesis Using Linguistic Features
Raheel Qader, Gwénolé Lecorvé, Damien Lolive, Pascale Sébillot
To cite this version:
Raheel Qader, Gwénolé Lecorvé, Damien Lolive, Pascale Sébillot. Probabilistic Speaker Pronunciation
Adaptation for Spontaneous Speech Synthesis Using Linguistic Features. International Conference on
Statistical Language and Speech Processing (SLSP), Nov 2015, Budapest, Hungary. pp.229-241.
�hal-01181192�
for Spontaneous Speech Synthesis Using
Linguistic Features
Raheel Qader1, Gw´enol´e Lecorv´e1, Damien Lolive1, and Pascale S´ebillot2
1
IRISA/Universit´e de Rennes 1, Lannion, France
2 IRISA/INSA de Rennes, Rennes, France
{raheel.qader, gwenole.lecorve, damien.lolive, pascale.sebillot}@irisa.fr
Abstract. Pronunciation adaptation consists in predicting pronunciation variants of words and utterances based on their standard pronunciation and a target style. This is a key issue in text-to-speech as those variants bring expressiveness to synthetic speech, especially when considering a spontaneous style. This paper presents a new pronunciation adaptation method which adapts standard pronunciations to the style of individual speakers in a context of spontaneous speech. Its originality and strength are to solely rely on linguistic features and to consider a probabilistic machine learning framework, namely conditional random fields, to produce the adapted pronunciations. Features are first selected in a series of experiments, then combined to produce the final adaptation method. Backend experiments on the Buckeye conversational English speech corpus show that adapted pronunciations significantly better reflect spontaneous speech than standard ones, and that even better could be achieved if considering alternative predictions.
Keywords: pronunciation adaptation, linguistic features, feature selec-tion, spontaneous speech synthesis , conditional random fields
1
Introduction
Pronunciation variations are changes operated by speakers on standard pronunci-ations of words and phrases. These varipronunci-ations are valuable since they reflect the emotional state of a speaker, his/her intention, a specific accent or the context of the speech itself. However, pronunciation models and lexicons used by most current text-to-speech (TTS) systems still only rely on standard pronunciations, which limits the expressiveness of the resulting synthetic speech and prevents it from conveying a spontaneous style. A solution to this problem is to adapt stan-dard pronunciations in order to fit this style. In a machine learning perspective, this task consists in predicting an adapted sequence of phonemes from an input sequence of canonical phonemes, i.e., deciding whether input phonemes should be deleted, substituted, simply kept as is, or if new phonemes should be inserted.
This paper proposes a new pronunciation adaptation method whose goal is to mimic the spontaneous style of individual speakers for the purpose of TTS.
The strength of this method is to rely on linguistic information solely and on a probabilistic framework, namely conditional random fields (CRFs). Contrary to pronunciation adaptation in automatic speech recognition (ASR), the goal in TTS is to produce a unique adapted pronunciation rather than to cover all possible variants. In this scope, linguistic information is specifically important since no other type of information is available before synthesis. Nonetheless, this paper is wilfully limited to the generation of adapted pronunciations, the synthesis and evaluation of the corresponding speech signals being kept for future work. Finally, CRFs offer several advantages. They are widely used in grapheme-to-phoneme converters [19, 9, 14], thus enabling an easy integration of their outputs. And they also allow to explicitly consider and combine a large set of features.
Related work in pronunciation variant generation can be examined w.r.t. the nature of the proposed methods and the type of information they rely on. While early work has mostly concentrated on using phonological rules extracted from data to create alternative pronunciations [17, 8], most recent techniques are machine learning approaches. Notably, decision trees [7, 18], random forests [6], neural networks [5, 10], hidden Markov models [16], and CRFs [10] have been inves-tigated. In [18], decision trees and statistical contextual rules are even combined. Alternatively, [11] proposed to produce accented pronunciations by interpolating different grapheme-to-phoneme models. Unfortunately, these methods are hardly comparable as they are rarely used on the same data nor for the same exact task. Still, a picture of input information can be drawn. Acoustic features can be extracted from speech signals of the target style and considered as indicators for pronunciation adaptation (F0, energy, duration, speaking rate, etc.) [2–4], while linguistic features can be derived from textual data (distinction between content and function words, word predictability, syllable locations, lexical stress, etc.) [18, 3, 4]. Recently, [6] presented a deep study on the combination of both types of features, including even others like age and gender. This last work is close to the current paper, especially since the same corpus is used. However, machine learning techniques are different and [6] only focuses on making standard pronunciation shorter. Finally, [5] showed that predicting pronunciations trans-formations should not be carried out on each canonical phoneme independently, but including their neighborhood too. It is important to highlight that most of related work target ASR, whereas TTS approaches are still rare and none makes an extensive and exclusive use of linguistic features as achieved here. Hence, the presented pronunciation adaptation method is new and original.
The rest of this paper is structured as follows: Section 2 introduces the Buckeye speech corpus used in the experiments while Section 3 draws an overview of the method and describes the experimental setup. Section 4 provides the method details before Section 5 presents backend experiments and discusses the results.
2
The Buckeye Corpus
This work is conducted on a corpus of English conversational speech called the Buckeye corpus [15]. This corpus consists of 307,000 words collected through
interviews with 40 speakers from central Ohio, USA, each interview lasting about 1 hour. The proportions of gender and age of the speakers are equally balanced. The questions asked by the interviewers are of general topics to which the speakers have to answer based on their own opinion. Interviews are annotated with the orthographic transcription and each word is provided with two phonemic transcriptions: the standard pronunciation (canonical phonemes) and the one effectively uttered by the speaker (realized phonemes). Transcriptions have been automatically generated, manually checked and corrected.
In this work, 20 speakers from the Buckeye corpus are considered, other speakers being set aside for future work. They have been randomly selected under the constraint to maintain the age and gender proportions. Among selected speakers, the average number of phonemes per speaker is 22,789, and the average number of words is 7,354. As listed in Table 1, data has been enriched with additional information about utterances, words, stems, parts of speech (POS), syllables, and graphemes, forming a total of 22 linguistic features for each canonical phoneme. All frequencies have been grouped into three categories with equal probability masses (frequent/medium/rare), and stop words have been identified using a list of 500 words in English. Finally, canonical and realized phonemes have been automatically aligned using the Levenshtein distance. Alignments show that 30 % of the phonemes and 57 % of the words are pronounced differently from the standard pronunciation.
3
Method Overview
In this section, the proposed pronunciation adaptation method is described before introducing CRFs and the experimental setup.
3.1 Overall Method
The underlying problem in pronunciation adaptation is to predict the sequence of realized phonemes for a given utterance from an input sequence of canonical phonemes. As such, the adaptation accuracy is defined as an error rate between the realized and the predicted phonemes. Our method proposes to add information to canonical phonemes to improve this accuracy.
Mainly, every canonical phoneme has been augmented with a wide range of linguistic features and information about their neighborhood, i.e., surrounding canonical phonemes and their linguistic description. Linguistic features have been selected to discriminate those which enhance adaptation from useless and harmful others. Defining a neighborhood as a phoneme window centered on a canonical phoneme to be adapted, benefits of neighborhoods have been evaluated by adjusting the size of the window to optimize the adaptation accuracy. In addition, contexts of the realized phonemes have been studied, the underlying question being whether predicting a given phoneme depends on the preceding predicted phoneme. The effect of cross-word information has also been investigated by
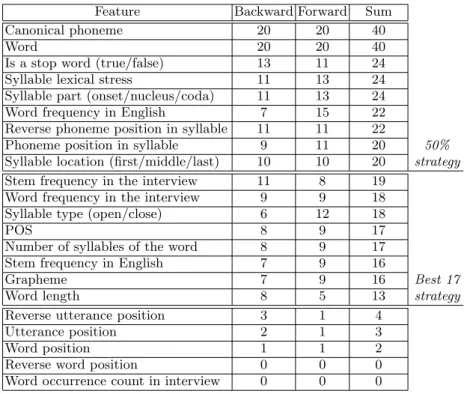
Table 1. Features along with their number of votes for greedy backward, forward methods, and the sum of both.
Feature Backward Forward Sum
Canonical phoneme 20 20 40
Word 20 20 40
Is a stop word (true/false) 13 11 24 Syllable lexical stress 11 13 24 Syllable part (onset/nucleus/coda) 11 13 24 Word frequency in English 7 15 22 Reverse phoneme position in syllable 11 11 22
Phoneme position in syllable 9 11 20 50% Syllable location (first/middle/last) 10 10 20 strategy Stem frequency in the interview 11 8 19
Word frequency in the interview 9 9 18 Syllable type (open/close) 6 12 18
POS 8 9 17
Number of syllables of the word 8 9 17 Stem frequency in English 7 9 16
Grapheme 7 9 16 Best 17
Word length 8 5 13 strategy
Reverse utterance position 3 1 4
Utterance position 2 1 3
Word position 1 1 2
Reverse word position 0 0 0
Word occurrence count in interview 0 0 0
comparing pronunciation adaptation when performed independently on each word of a given utterance or directly on all phonemes of all the words.
Linguistic feature selection and window size tuning have been performed in a first series of experiments, leading to the final method evaluated in backend experiments. Cross-dependencies over predicted phonemes and cross-word in-formation have been evaluated in all experiments. Before presenting results of these experiments in Sections 4 and 5, the remainder introduces the underlying probabilistic machine learning framework, CRFs, and the experimental setup. 3.2 Conditional Random Fields
CRFs are probabilistic models for labelling sequential data [12]. They model the conditional probability of a sequence of T labels y = (y1, . . . , yT) given an input
sequence of observations x = (x1, . . . , xT) as follows:
Pr(y|x) = 1 Zθ(x) exp T X t=1 K X k=1 θkfk(yt−1, yt, xt) ! , (1)
where Zθ(x) is a normalization factor, {fk}1≤k≤K are K so-called feature
func-tions, {θk}1≤k≤K are their associated weights estimated on training data such
Table 2. PERs and WERs (%) of canonical pronunciations (baseline error rates). PER on isolated words PER on utterances WER
Development set 30.4 30.3 57.0
Test set 30.5 30.3 57.2
Feature functions are a powerful mean to combine input information. They typically return 1 when the condition of the feature is met, 0 otherwise. An exam-ple of a condition in our case might be “the current input canonical phoneme xtis
/t/ and the output realized phoneme ytis /P/”. If desired, feature functions can
also take advantage of the previous phoneme yt−1to predict yt. This configuration
is referred to as bigram configuration, as opposed to unigram when only yt is
considered. Unigram and bigram features functions can be considered together (referred to as uni+bigram in the remainder). In order to test which configuration performs the best, all three have been tried for all the experiments in this work using the toolkit Wapiti [13].
3.3 Experimental Setup
Adaptation CRFs are trained and evaluated independently for each speaker. However, the objective is to determine a same set of features for any speaker adaptation. To do so, each interview is randomly divided into a training set (60% of the utterances), a development set (20%), and a test set (20%). The linguistic feature selection and the window size tuning are performed on the development set while final experiments are conducted on the test set. For each speaker, the phoneme error rate (PER) and the word error rate (WER) are computed by comparing the realized phonemes with either the canonical phonemes (baseline) or those resulting from an adaptation. Mean error rates are then reported by averaging PERs and WERs over all the speakers. Baseline error rates on the development and test sets are shown in Table 2. PERs on isolated words and utterances are different since the computation on utterances is more tolerant of some errors. Typically, a deletion and an insertion may be merged into one substitution when computing cross-word error rates. These numbers can later be used to compare the different tested pronunciation adaptation configurations. These average error rates hide big differences across speakers: individual PERs range from 22.0% to 39.8%, and WERs from 45.0% to 66.0%. This disparity is a strong argument to perform pronunciation adaptation on a speaker basis rather than on all the speakers together, as capturing variations may be very difficult in the latter case. Finally, as stated in the introduction, no speech signal has been generated in this work, this for two reasons. First, the phoneme set used in the Buckeye corpus is more precise than the one supported by our TTS system, especially by including allophones. Synthesizing speech would then require to degrade the pronunciation precision, which could possibly erase some pronunciation variants. Second, results of perceptual tests may be biased by the style of the speech corpus on which the TTS system relies. Hence, this
paper focuses on validating the approach through objective evaluations, leaving perceptual tests for future work.
4
Feature and Window Size Selection
In this section, the details of the linguistic feature and window size selections are given.
4.1 Linguistic Feature Selection
Training CRFs on too many features might result in overfitting the data. Therefore, it is important to reduce the number of features by removing less useful features and keeping only relevant ones. Moreover, it helps reducing the time and memory needed for training. For this purpose, a selection process has been applied on the development set. The basic idea of this process is to run an election over linguistic features by searching for the best feature set, i.e., the set with minimal PER, for each speaker. Features receive a vote each time they appear in the best set of some speaker. To make the selection process more robust, two selection schemes are considered, and votes for both schemes are finally added up. First, a greedy backward elimination was conducted where all features are considered at the beginning and features are eliminated one at a time until the best set is found. Second, a greedy forward selection was applied, i.e., the process starts with canonical phonemes as a unique feature and other features are added one at a time until the optimal set is found. This selection process has been carried out either disregarding or using cross-word information, i.e., on either isolated words or utterances, respectively.
Table 1 reports the total number of votes obtained by each feature over all speakers in the case of isolated words. Results are given for the backward and forward schemes, and when adding up votes from both methods. As a result, it appears that complementing canonical phonemes with information about the actual word is essential since this feature received the maximum number of votes (40). In the same trend, the status of the word in the language is also important. It can also be highlighted that syllable-based features are in the top of the list. These conclusions are consistent with previous studies [18, 3, 1].
Given the sorted list of features according to total votes, two strategies were tested to determine the feature set for the adaptation method. The first one considers all the features with at least 50% of the speakers’ votes, i.e., with 20 votes or more, while the second consists in choosing the threshold where a sharp decline is seen. Here, this strategy leads to select the best 17 features since the other worst 5 features received nearly no vote. Table 3 compares the PER and WER on the development set when ignoring linguistic features, i.e., only canonical phonemes are used, and when considering linguistic features selected with each strategy. Many conclusions can be drawn from these results. First, the selected features bring significant improvement over the baseline, whatever the CRF configuration (unigram, bigram or uni+bigram). This is all the more
Table 3. PER and WER (%) without linguistic features and with features selected according to the 50% and “Best 17” strategies. Absolute variations with the baseline are reported between brackets.
No linguistic feature 50% strategy Best 17 strategy
PER WER PER WER PER WER
Unigram 30.4 (0.0)57.0 (-0.2) 24.7 (-5.7) 50.7 (-6.5) 24.4 (-6.0)50.3 (-6.9)
Bigram 47.7(+17.3)82.3(+25.1) 31.8 (+1.4) 59.3 (+2.1) 32.1(+1.7)59.7(+2.5)
Uni+bigram 25.7 (-4.7)50.1 (-7.1) 24.1(-6.3)49.4 (-7.8) 24.4 (-6.0)50.2 (-7.0)
interesting since adaptation does not bring any improvement when CRFs are trained using unigrams and canonical phonemes only. Secondly, results on bigrams show that this configuration performs badly. This is probably due to data sparsity in the training set where only a limited number of realized phoneme bigrams can be observed. For all that, combining unigrams and bigrams leads to better results than the sole unigrams. Finally, the results of the two considered selection strategies are close. However the 50% strategy leads to the lowest error rates and utilizes less features (9 against 17). Thus, the features selected by the 50% strategy are chosen as the accepted set of features for the final experiments. In addition, as the bigram configuration does not provide any improvement, its results will not be reported in the following.
The same process was repeated on utterances after adding an explicit word boundary feature to keep track of the phoneme position inside their corresponding word. Very similar results were achieved, the only difference being the inclusion of the word boundary feature in the list of the best features. So the features used for training utterance-based models are the same as those selected by the 50% strategy on isolated words plus this word boundary feature.
4.2 Window Size Selection
One important step apart from feature selection is to decide on the neighborhood scope around each canonical phoneme, that is determining the best suited size of canonical phoneme windows. These windows are centered on the canonical phoneme to be adapted. They are symmetrically1defined by the number W of
the left and right hand surrounding phonemes. For instance, W = ±2 means that 2 neighbors from each side are considered along with the current canonical phoneme, hence considering 5 phonemes in total. The maximum value for W was set to ±5.
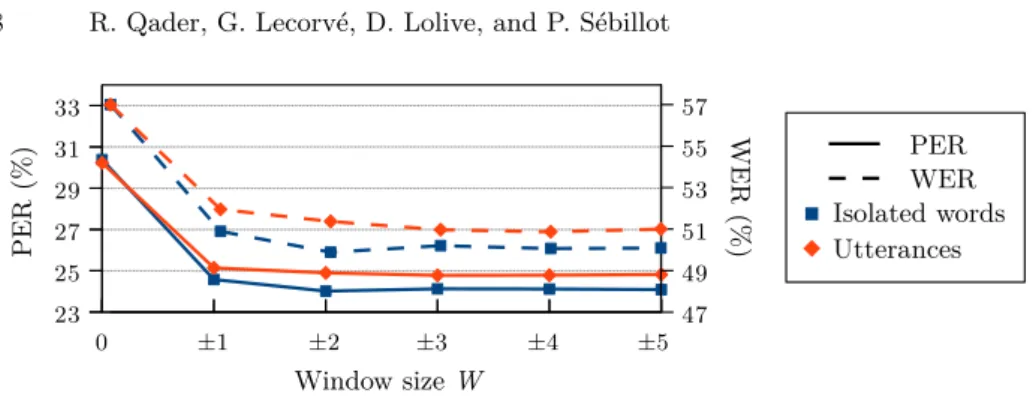
Figure 1 presents PERs and WERs obtained without windows (W = 0) or with different window sizes, for both isolated words and utterances. CRFs were trained on unigram features, without any linguistic feature. First, results show that phoneme neighborhoods bring significant improvements. For both isolated words and utterances, results seem to converge after a given size is reached. However, convergence is slower for utterances and results are worse than for
1
Fig. 1. PER and WER according to the window size, for isolated words and utterances.
isolated words. The reason is probably that word boundaries are not known in this configuration, CRFs being only trained on cross-word canonical phonemes. As a conclusion, the window W = ±2 is considered in the backend experiments.
5
Backend Experiments and Discussion
Experiments are carried out on the test set of all each speaker using canonical phonemes with or without linguistic features, with or without contextual windows, and on the basis of isolated words or utterances. Linguistic features and windows are those selected in Section 4. This section first presents the raw results before developing a deeper analysis.
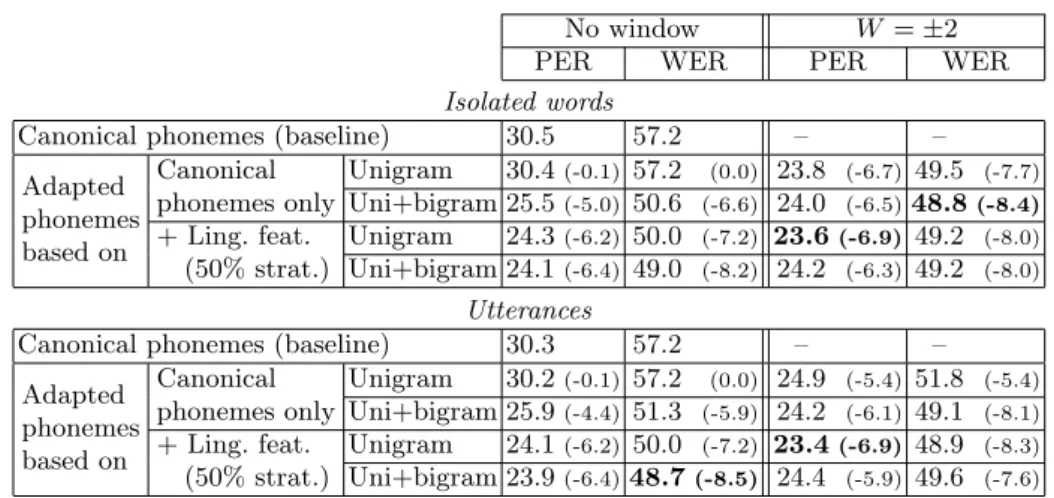
Table 4 presents results for all combinations. First, configurations already evaluated on the development set lead to similar results, i.e., enriching canonical phonemes with either selected linguistic features or phoneme windows brings lower error rates ; and the uni+bigrams configuration performs well in one or the other of the two settings. Then, new conclusions can be drawn when combining linguistic features and phoneme windows. On unigrams, it can be noticed that extra improvements are obtained, leading to the lowest PER for both isolated words and utterances. On isolated words, this improvement is small (0.2 w.r.t. using the phoneme window only) but statistically significant2. On utterances, the improvement is large. A part of it is probably due to the inclusion of the word boundary information. Compared to canonical pronunciations, the PER relatively decreased by about 23%, while the WER decreases by about 14% in this case. On the contrary, when looking at the uni+bigram results, this combination degrades the results. We think that this is due to the too large number of parameters implied by this configuration in relation to the training set size, which leads to poor feature weight estimates. As a conclusion, overall results demonstrate that (i) the proposed pronunciation adaptation method clearly outperforms the baseline and results from the simplest CRFs, based on independent canonical phonemes, (ii) the inclusion of linguistic features is useful though the impact is
2 The p-values are 0.01037 and 0.008844 using a paired t-test and a paired Wilcoxon
Table 4. PERs and WERs (%) on the test set for isolated words and utterances. Absolute variations with the baseline are reported between brackets.
No window W = ±2
PER WER PER WER
Isolated words
Canonical phonemes (baseline) 30.5 57.2 – – Adapted phonemes based on Canonical phonemes only Unigram 30.4(-0.1)57.2 (0.0) 23.8 (-6.7) 49.5 (-7.7) Uni+bigram 25.5(-5.0)50.6 (-6.6) 24.0 (-6.5)48.8(-8.4) + Ling. feat. (50% strat.) Unigram 24.3(-6.2)50.0 (-7.2) 23.6(-6.9) 49.2 (-8.0) Uni+bigram 24.1(-6.4)49.0 (-8.2) 24.2 (-6.3) 49.2 (-8.0) Utterances
Canonical phonemes (baseline) 30.3 57.2 – – Adapted phonemes based on Canonical phonemes only Unigram 30.2(-0.1)57.2 (0.0) 24.9 (-5.4) 51.8 (-5.4) Uni+bigram 25.9(-4.4)51.3 (-5.9) 24.2 (-6.1) 49.1 (-8.1) + Ling. feat. (50% strat.) Unigram 24.1(-6.2)50.0 (-7.2) 23.4(-6.9) 48.9 (-8.3) Uni+bigram 23.9(-6.4)48.7(-8.5) 24.4 (-5.9) 49.6 (-7.6)
Table 5. Pronunciations for the phrase “concentrated in Ohio”. Presented adapted pronunciations have been generated on isolated words, using unigram features. Errors w.r.t. the realized pronunciations are marked in bold.
Realized phonemes / k A n s n
" t ô eI I d · I ˜R · oU h A 2 /
Canonical phonemes (baseline) / k A n s 2 n t ô eI t 2 d · I n · oU h aI oU /(7 errors)
Adapted phonemes based on
canonical phonemes only / k A n s 2 n t ô eI t 2 d · I n · oU h aI oU /(7 errors)
+ linguistic feat. / k A n s 2 n t ô eI t 2 d · I n · oU h aI oU /(7 errors)
+ window / k A n s n
"n ô eI t I d · I n · oU h aI oU /(6 errors) + linguistic feat. + window / k A n s n
"n ô eI R I d · I n · oU h aI oU /(6 errors)
small, and (iii) considering words in the context of their utterance does not lead to any improvement.
To illustrate the results, Table 5 presents adapted pronunciation samples along with the realized and standard ones. First, it clearly appears that the standard pronunciation is very different from the realized one. Then, this ex-ample shows how adaptation only changes few phonemes, sometimes even none. Most of the time, these changes are deletions, substitutions with an allophone or simplifications of a diphthong into a monophthong. Nonetheless, adapted pronunciations are usually closer to spontaneous speech than the baseline, while still far from perfect. Overall, this example highlights one major difficulty in pronunciation adaptation: the way people speak is not deterministic and thus, in many cases, several pronunciations could be accepted for a same utterance and speaker. Consequently, error rates on single best hypotheses output by CRFs are probably not sufficient to measure how good is an adaptation model. In order to develop this analysis, extra measurements have been achieved.
First, oracle PERs have been measured on the n-best hypotheses, i.e., only the best matching pronunciation is considered among the n generated by the CRF
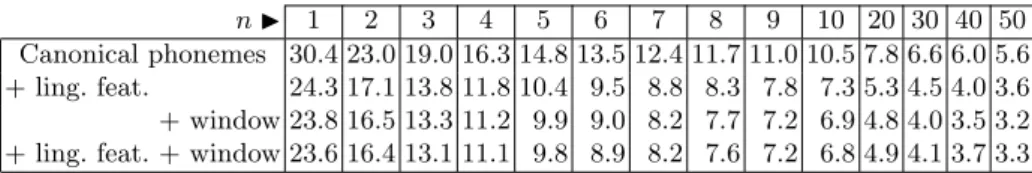
Table 6. Oracle PERs of n-best hypotheses on isolated words for n between 1 and 50. n I 1 2 3 4 5 6 7 8 9 10 20 30 40 50 Canonical phonemes 30.4 23.0 19.0 16.3 14.8 13.5 12.4 11.7 11.0 10.5 7.8 6.6 6.0 5.6 + ling. feat. 24.3 17.1 13.8 11.8 10.4 9.5 8.8 8.3 7.8 7.3 5.3 4.5 4.0 3.6 + window 23.8 16.5 13.3 11.2 9.9 9.0 8.2 7.7 7.2 6.9 4.8 4.0 3.5 3.2 + ling. feat. + window 23.6 16.4 13.1 11.1 9.8 8.9 8.2 7.6 7.2 6.8 4.9 4.1 3.7 3.3
instead of the sole 1-best. Table 6 shows oracle PERs for different settings with n ranging from 1 to 50. As it can be seen, by only adding the 2-best hypothesis, the PER drops from 23.6% to 16.4% for the best performing configuration. The same trend is observed for all the other configurations. Then, results are improved as the number of hypotheses increases until apparently approaching a lower bound, which can be thought as “unpredictable”, or at least very hardly predictable, pronunciation variants. Interestingly, this lower bound seems to be significantly higher for the most basic CRF (canonical phonemes only) than for others (n = 50). This tends to show that the latter models not only rerank phoneme probabilities but also introduce new adaptation possibilities.
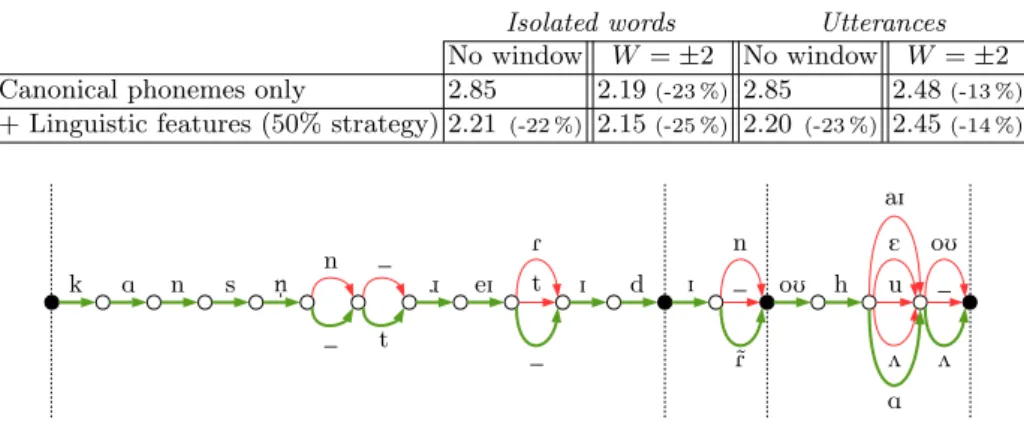
Second, adaptation models have also been compared by measuring how well they can predict the realized pronunciations, that is how high is their probability. This can be achieved by computing the perplexities of the test set according to the different models, the lower perplexity the better. Perplexity is interesting since a model may assign a high probability to the realized pronunciations while not considering it as the most likely hypothesis though. As a consequence, there is no direct relation between perplexity and error rates. Perplexities over phonemes are presented in Table 7 for all the adaptation models. Evidently, the model based on canonical phonemes only and W = 0 achieves the highest perplexity. Other results on isolated words confirm the PER and WER results of Table 4 since the lowest perplexity is achieved by the combination of linguistic features and the window W = ±2. On utterances, the lowest perplexity is surprisingly achieved by the use of linguistic features without any window. This shows that linguistic features are relevant cues to predict pronunciation variants. Finally, perplexity can also be interpreted as a branching factor, i.e., the number of phonemes to be tested in the descending order of their probability before finding the realized one. Numbers in Table 7 thus indicate that low oracle PERs could be achieved by only considering the few best phoneme predictions, typically the 2 or 3 best. For instance, Figure 2 draws the minimal confusion network for the sample utterance “concentrated in Ohio” when using the best performing model. Edges are sorted according to their descending posterior probability from top to bottom. Realized phonemes are on the bold green edges. In this example, considering only the 3 best hypotheses for each phoneme would lead to an oracle PER of 5.6 %. Such small confusion networks could be automatically using a very low static number of alternatives, and then post-processed or directly fed to a TTS system.
Table 7. Perplexity over phonemes of all the configurations. Relative variation w.r.t. the simplest CRFs (canonical phonemes only) are reported between brackets.
Isolated words Utterances No window W = ±2 No window W = ±2 Canonical phonemes only 2.85 2.19(-23 %) 2.85 2.48(-13 %)
+ Linguistic features (50% strategy) 2.21(-22 %) 2.15(-25 %) 2.20(-23 %) 2.45(-14 %)
Fig. 2. Confusion network for “concentrated in Ohio”. Black circles delimit words.
6
Conclusion and Future Work
This paper proposed a new CRF-based speaker pronunciation adaptation method for the purpose of spontaneous speech synthesis. While adapted pronunciations are significantly better than canonical ones, experiments on the Buckeye corpus demonstrate that including linguistic features contributes to achieving these good results. This work also shows that CRF features need to be selected since combining all possible features tends to decrease PER and WER gains produced by the adaptation. A deeper analysis of the results also showed that very low error rates could be achieved if considering alternative predictions.
Several tasks could be achieved in the future to improve the current work. First, results should be completed with speech synthesis experiments now that the current method has been validated by objective measures. The use of alternative hypotheses should be tested as well. Second, while this paper was focused on testing the relevance of the sole linguistic features, the proposed method could be enriched with phonetic features, e.g., phoneme aperture, manner, place of ar-ticulation, etc. These additional features could bring complementary information about how strong or weak a phoneme is. Finally, pronunciation adaptation should be used along with an automatic phonetizer. Especially, it would be interesting to couple the proposed approach with a CRF-based grapheme-to-phoneme converter and to interpolate probabilities returned by each of the components with the hope to outperform the quality of the finally adapted pronunciations.
References
1. Adda-Decker, M., de Mare¨uil, P.B., Adda, G., Lamel, L.: Investigating syllabic structures and their variation in spontaneous French. Speech Communication 46(2) (2005)
2. Bates, R., Ostendorf, M.: Modeling pronunciation variation in conversational speech using prosody. In: ISCA Tutorial and Research Workshop (ITRW) on Pronunciation Modeling and Lexicon Adaptation for Spoken Language Technology (2002) 3. Bell, A., Brenier, J.M., Gregory, M., Girand, C., Jurafsky, D.: Predictability effects
on durations of content and function words in conversational English. Journal of Memory and Language 60(1) (2009)
4. Bell, A., Jurafsky, D., Fosler-Lussier, E., Girand, C., Gregory, M., Gildea, D.: Effects of disfluencies, predictability, and utterance position on word form variation in English conversation. The Journal of the Acoustical Society of America 113(2) (2003)
5. Chen, K., Hasegawa-Johnson, M.: Modeling pronunciation variation using artificial neural networks for English spontaneous speech. In: Proceedings of the Annual Conference of the International Speech Communication Association (Interspeech) (2004)
6. Dilts, P.C.: Modelling phonetic reduction in a corpus of spoken English using random forests and mixed-effects regression. Ph.D. thesis, University of Alberta (2013)
7. Fosler-Lussier, E., et al.: Multi-level decision trees for static and dynamic pronuncia-tion models. In: Proceedings of the European Conference on Speech Communicapronuncia-tion and Technology (Eurospeech) (1999)
8. Giachin, E., Rosenberg, A., Lee, C.H.: Word juncture modeling using phonological rules for HMM-based continuous speech recognition. In: Proceedings of the IEEE International Conference on Acoustics, Speech and Signal Processing (ICASSP) (1990)
9. Illina, I., Fohr, D., Jouvet, D.: Grapheme-to-phoneme conversion using conditional random fields. In: Proceedings of the Annual Conference of the International Speech Communication Association (Interspeech) (2011)
10. Karanasou, P., Yvon, F., Lavergne, T., Lamel, L.: Discriminative training of a phoneme confusion model for a dynamic lexicon in ASR. In: Proceedings of the Annual Conference of the International Speech Communication Association (Interspeech) (2013)
11. Kolluru, B., Wan, V., Latorre, J., Yanagisawa, K., Gales, M.J.F.: Generating multiple-accent pronunciations for TTS using joint sequence model interpolation. In: Proceedings of the Annual Conference of the International Speech Communication Association (Interspeech) (2014)
12. Lafferty, J., McCallum, A., Pereira, F.C.: Conditional random fields: probabilistic models for segmenting and labeling sequence data (2001)
13. Lavergne, T., Capp´e, O., Yvon, F.: Practical very large scale CRFs. In: Proceedings of the 48th Annual Meeting of the Association for Computational Linguistics (2010) 14. Lecorv´e, G., Lolive, D.: Adaptive statistical utterance phonetization for French. In: Proceedings of IEEE International Conference on Acoustics, Speech and Signal Processing (ICASSP) (2015)
15. Pitt, M.A., Johnson, K., Hume, E., Kiesling, S., Raymond, W.: The Buckeye corpus of conversational speech: labeling conventions and a test of transcriber reliability. Speech Communication 45(1) (2005)
16. Prahallad, K., Black, A.W., Mosur, R.: Sub-phonetic modeling for capturing pro-nunciation variations for conversational speech synthesis. In: Proceedings of IEEE International Conference on Acoustics, Speech and Signal Processing (ICASSP). vol. 1 (2006)
17. Tajchman, G., Foster, E., Jurafsky, D.: Building multiple pronunciation models for novel words using exploratory computational phonology. In: Proceedings of the European Conference on Speech Communication and Technology (Eurospeech) (1995)
18. Vazirnezhad, B., Almasganj, F., Ahadi, S.M.: Hybrid statistical pronunciation models designed to be trained by a medium-size corpus. Computer Speech & Language 23(1) (2009)
19. Wang, D., King, S.: Letter-to-sound pronunciation prediction using conditional random fields. IEEE Signal Processing Letters 18(2) (2011)