Research Article
Daily Objective Physical Activity and Sedentary Time in
Adults with COPD Using Spirometry Data from Canadian
Measures Health Survey
P. Bernard ,
1,2G. Hains-Monfette,
1,2S. Atoui,
1,2and G. Moullec
3,41Department of Physical Activity Sciences, Universit´e du Qu´ebec `a Montr´eal, Montr´eal, QC, Canada 2Research Center, University Institute of Mental Health at Montreal, Montr´eal, QC, Canada
3Department of Social and Preventive Medicine, School of Public Health, University of Montr´eal, Montr´eal, QC, Canada 4Research Center, CIUSSS Nord-de-l’ˆIle-de-Montr´eal, QC, Canada
Correspondence should be addressed to P. Bernard; [email protected] Received 4 October 2018; Accepted 6 November 2018; Published 2 December 2018 Academic Editor: Andrea S. Melani
Copyright © 2018 P. Bernard et al. This is an open access article distributed under the Creative Commons Attribution License, which permits unrestricted use, distribution, and reproduction in any medium, provided the original work is properly cited. Chronic obstructive pulmonary disease (COPD) is expected to be the third leading cause of premature death and disability in Canada and around the world by the year 2020. The study aims to compare objective physical activity (PA) and sedentary time in a population-based sample of adults with chronic obstructive pulmonary disease (COPD) and compare a group, and to investigate whether these behaviors differ according to COPD severity. From the 2007–2013 Canadian Health Measures Survey dataset, accelerometer and prebronchodilator spirometry data were available for 6441 participants, aged 35 to 79. Two weighted analyses of covariance were performed with adjustments for age, sex, body mass index, accelerometer wearing time, season, work, smoking (cotinine), education level, and income. A set of sensitivity analyses were carried out to examine the possible effect of COPD and type of control group. A cross-sectional weighted analysis indicated that 14.6% of study participants had a measured airflow obstruction consistent with COPD. Time in PA (moderate-vigorous and light PA), number of steps, and sedentary duration were not significantly different in participants with COPD, taken together, compared to controls. However, moderate to severe COPD participants (stages ≥2) had a significantly lower daily time spent in PA of moderate and vigorous intensity level compared to controls. Canadian adults with COPD with all disease severity levels combined did not show lower daily duration of light, moderate, and vigorous PA, and number of steps and higher daily sedentary time than those without airflow obstruction. Both groups are extremely sedentary and have low PA duration. Thus, “move more and sit less” public health strategy could equally target adults with or without COPD.
1. Introduction
Chronic obstructive pulmonary disease (COPD) is a public health issue in Canada [1]. Indeed, COPD is a leading cause of disability, morbidity, and mortality. COPD is among the most common causes of hospitalization and health care utilization in Canadian adults [2, 3]. Comorbidities are highly prevalent in people with COPD [4] increasing the risk of physical inactivity. Lack of physical activity and majority of daily time spent in sedentary behaviors have been in-dependently associated with high mortality rates in adults with COPD [5, 6].
Physical activity and sedentary are complex behaviors in adults with COPD. Patterns of physical activity and sedentariness have been previously examined in COPD population using self-reported—as opposed to objective— measures [7, 8]. Previous cross-sectional investigations established that adults with COPD have a significantly re-duced duration of moderate and vigorous physical activity (MVPA), light physical activity (LPA), and number of steps when compared to age-matched controls [9–11]. Previous studies also compared the daily steps in COPD outpatients and controls. COPD patients performed significantly fewer steps [10, 12, 13]. In the last systematic review focusing on
Volume 2018, Article ID 9107435, 9 pages https://doi.org/10.1155/2018/9107435
objectively assessed daily physical activity comparison in adults with COPD and control group, Vorrink et al. con-cluded that adults with COPD have a significantly reduced duration, intensity, and frequency of physical activity [11]. They suggested that these differences may be due to possible selection bias (i.e., recruitment of more severe patients from rehabilitation programs and recruitment of highly physical active controls (seniors involved in a physical fitness/ exercise group) [11, 14]. However, a recent population-based study compared accelerometer data in adults with self-reported COPD diagnosis to controls, using the Na-tional Health and Nutrition Evaluation Survey (NHANES) data, a representative US national sample. People with COPD were less active and spent more time in sedentary behaviors. However, the self-reported COPD status was an important limitation due to its frequent underdiagnosis in the general population [15, 16]. To date, a comparison of objectively measured physical activity and sedentary be-haviors data between adults with or without spirometry-based classification of COPD remains to be done, across severity stages in a population-based study.
We aimed to compare objectively measured physical activity and sedentary behaviors in a representative sample of Canadian adults with measured airflow obstruction consistent with COPD (ratio of forced expiratory volume in 1 second to the forced vital capacity less than 0.70) with a control group with no COPD. We also investigated how physical activity and sedentary behaviors differ according to COPD severity.
2. Methods
2.1. Study Population. This study used data collected during
cycles 1, 2, and 3 (2007–2013) of the Canadian Health Measures Survey (CHMS; representative of approximately 96% of the Canadian population) [17]. Data were collected in two stages. First, sociodemographic and general health in-formation were collected during an in-person interview at the participants’ homes. Then, direct physical measurements (i.e., cotinine level, weight, height, and spirometry) were collected by trained health technicians during a subsequent visit to a mobile examination center. We included participants aged 35 to 79 years with a spirometry test and complete physical activity data. Ethical approval to conduct the survey was obtained from Health Canada’s Research Ethics Board [17]. All respondents provided written informed consent.
2.2. Measures
2.2.1. Sociodemographic and Clinical Characteristics. Age,
level of education, household income, working status (yes/no for last 12 months), marital status, and body mass index were reported as sociodemographic characteristics. Smoking was characterized with the following variables: age of first cigarette smoked, daily cigarette consumption, number of daily smoking years, and urinary cotinine level. Cotinine provided an accurate quantitative measure of active or second-hand smoking. Participants were asked to refrain from smoking for a 2-hr period prior to the mobile-examination-clinic visit [18].
The following self-reported information was documented with yes/no questions: self-reported diagnosis of COPD, cough, phlegm, shortness of breath, and mood disorders. Participants reported their sleep duration and used a Likert scale ranging from never to all the time to assess their sleep problems, restorative sleep, and difficulty to stay awake. Self-reported physical health, mental health, perceived stress, and quality of life were each evaluated with one item, using a response scale ranging from poor to excellent.
2.3. Physical Activity. Upon completion of their mobile
examination center visit, CHMS participants were asked to wear an Actical accelerometer (Philips-Respironics, 17 grams, omnidirectional accelerometer) [19] over their right hip on an elasticized belt during their waking hours for 7 consecutive days. The Actical began measuring the day following the mobile examination center appointment. The accelerometers were returned by post mail to Statistics Canada. Then, the monitor was checked to determine if it was still within the manufacturer’s calibration specifications. The Actical is a valid accelerometer to assess physical activity in adults [19, 20]. It measures and records time-stamped acceleration in all directions, thereby indicating the intensity of physical activity. The digitized values are summed over a user-specified interval of 1 minute, resulting in a count value per minute (cpm) and steps accumulated per minute [21]. All data were blind to respondents while they were wearing the device. As recommended for adults with COPD [22], a valid day was defined as 8 or more hours of wear time; respondents with 4 or more valid days were retained for analyses (FEV1/FVC values between participants with valid
and no valid actimeter data were compared). Participants with extreme counts (i.e., >20,000 cpm) were excluded from analyses [23]. The daily time spent in physical activity of different intensity levels was categorized using validated cpm thresholds for adults [24]: sedentary (<100 cpm), light (100 to 1534 cpm), and moderate to vigorous (≥1535 cpm).
2.4. Prebronchodilator Spirometry Measures. The
pre-bronchodilator spirometry procedure followed the revised joint American Thoracic Society/European Respiratory So-ciety guidelines [25]. Spirometry was performed with a modern Fleisch pneumotachograph-type spirometer (KoKo; nSpire Health, Longmont, CO). The spirometer was always the same for all CHMS participants. Technician training for the mobile examination center was the same for all operators, and quality control assessment was done both manually and electronically. The spirograms were saved, and all tracings were reviewed at a later date by a qualified pulmonary function technician who made the final acceptance or re-jection of tracings from the field based on previously agreed-on criteria. The forced vital capacity (FVC), forced expiratory volume in one second (FEV1), and their ratio (FEV1/FVC)
were collected. Predicted values for these lung function pa-rameters were derived from prediction equations from the Third NHANES [26]. The Global Initiative for Obstructive Lung Disease (GOLD) criteria for prebronchodilator data
were used to identify COPD cases (FEV1/FVC < 0.70) and to
determine severity stages [27].
For each participant, the measured FEV1/FVC was
calculated from the largest set of FEV1 and FVC values
recorded in any of the spirometric maneuvers for which participant performance met American Thoracic Society acceptability criteria. Respondents were not eligible to perform spirometry if they were pregnant for more than 27 weeks, had a heart attack or major surgery in the chest or abdomen in the previous 3 months, had eye surgery in the previous 6 weeks, reported taking medication for tubercu-losis, or had an acute respiratory tract infection (e.g., cold, flu, and so on) [28] or other conditions that would likely make spirometry unsafe [29].
2.5. Statistical Analysis. To account for the complex,
mul-tistage probability sampling design, weights (i.e., activity monitor subsample weights combining cycles 1, 2, and 3) and bootstraps provided by the CHMS were used in the analyses. All analyses were performed during 2017 and 2018, using
survey [30] package in R version 3.3. A set of weighted
an-alyses of covariance regression models (ANCOVA) in-corporating age, sex, body mass index, accelerometer wearing time, season, work, smoking (cotinine), education level, and income were carried out. As suggested by Aaron et al. [31], in order to limit a possible COPD misclassification, the absolute distance of the participant’s FEV1/FVC ratio from 0.70 was
also included in our models. Different models were tested for the following outcomes: average steps per day, average minutes per day of LPA and MVPA, and average minutes per day of sedentary behavior. Since the number of minutes of MVPA was not normally distributed, Poisson models were carried out for this variable.
2.6. Sensitivity Analyses. To examine the possible effect of
COPD characterization, type of control group, and poor adherence to accelerometer, a set of sensitivity analyses was planned. A more conservative definition of airflow limita-tion defined as FEV1/FVC less than the lower limit of normal
(LLN), using the Canadian references from CHMS [28, 32], was used. Then, ANCOVAs were carried out with physical activity and sedentary outcomes. We also performed ana-lyses by excluding controls with chronic diseases (i.e., diabetes, cancer, heart disease, and fibromyalgia).
3. Results
3.1. Descriptives. In total, 6,441 participants were included.
Cross-sectional weighted analyses indicated that 14.6% of CHMS participants aged 35 to 79 had a measured airflow obstruction consistent with COPD and 1.3% self-reported a COPD diagnosis. Among these COPD cases, 49.3% were classified as GOLD stage 1, 45% stage 2, and 5.7% stages 3-4. The average age were 56.9 (0.7), 57.2 (0.9), and 59.9 (3.4) in participants classified in GOLD stages 1, 2, and 3-4, re-spectively. For the comparison group, the average age was 52.2 (SE � 0.2) years and 48% were male. On average, participants with COPD spent 16.5 (SE � 1), 216 (SE � 5),
and 447 (SE � 11) minutes per day engaged in MVPA, LPA, and sedentary time, respectively. The detailed participant characteristics are shown in Tables 1 and 2 and Supple-mentary file 1. The FEV1/FVC values between participants with (N � 6,641) and without (N � 606) valid accelerometer data were not significantly different (p � 0.15).
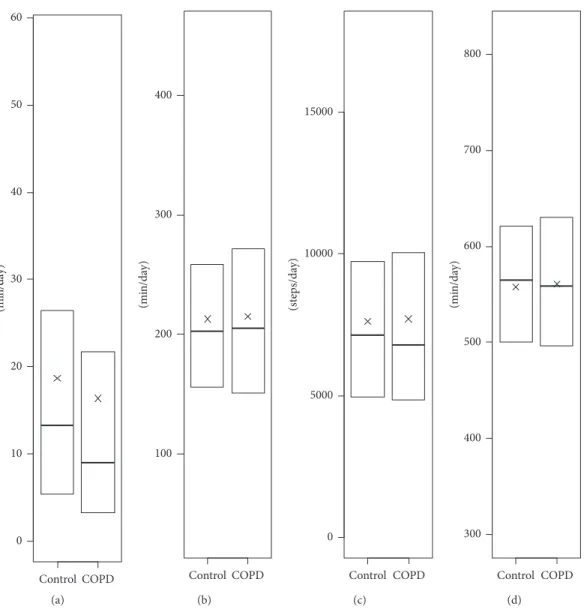
3.2. Accelerometry-Measured Physical Activity and Sedentary Time in Participants with COPD. We found that physical
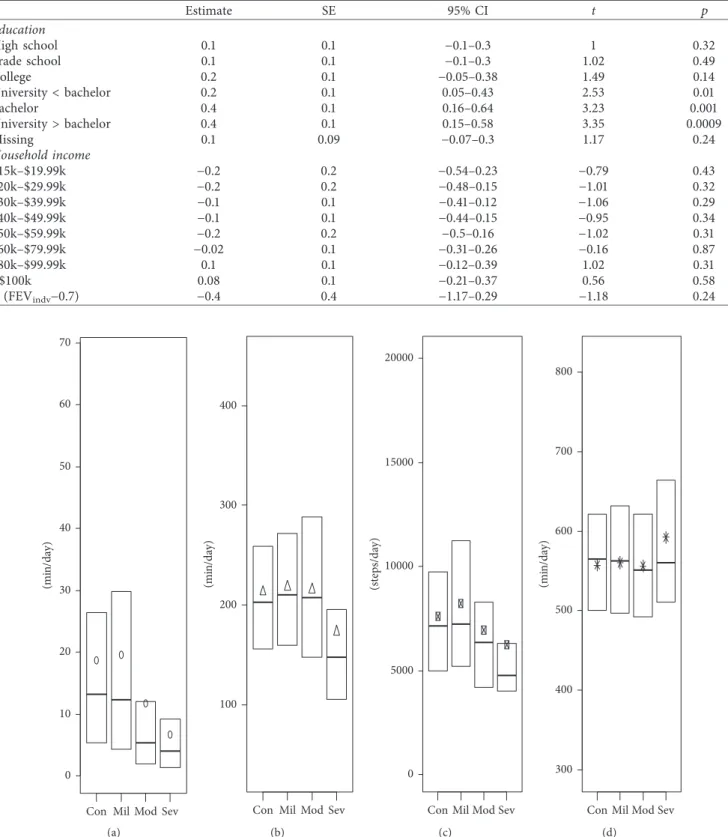
activity and sedentary duration were not significantly dif-ferent in participants with COPD, taken all together, com-pared to controls (Figure 1). Participants classified in stages 2 and 3-4 had a significant lower daily MVPA duration in comparison to controls (11.7 min and 6.7 min versus 18.7 min; p < 0.01; effect size (ES) � 0.14 and ES � 0.54, respectively) (Table 3). No other significant differences were observed across COPD severity (Figure 2). All details about statistical results are available in Supplementary files 2 and 3.
3.3. Sensitivity Analyses. In sensitivity analyses, using a
“healthy” control group (i.e., excluding participants with chronic diseases, N � 4312), similar results were found for physical activity and sedentary outcomes (Table 2). When we used the COPD case definition as FEV1/FVC<LLN, leading to
a weighted prevalence of 9.6%, no significant differences were observed for MVPA, LPA, steps, and sedentary variables. Descriptive results and findings from sensitivity analyses are presented in Supplementary files 2 and 3.
4. Discussion
Previous studies conducted in convenient samples have shown that COPD patients were less active and spent more time in sedentary behaviors than their same-age peers [10, 11, 33]. This population-based study, with spirometry-based characterization, is the first one to robustly show that COPD patients (taken all together) spend equivalent daily durations of physical activity and sedentary time when compared to age-matched controls. This inconsistency may be due to recruitment strategies in previous studies where COPD patients were mostly recruited from rehabilitation programs [11, 33] or cancer screening trial [10], and their peer controls were active seniors [34] or students [35]. For instance, the daily number of steps in control groups was around 7620 and 9400 in the current study and in Trooster’s investigation [12], respectively. Consequently, previous studies may have included more severe COPD patients. Another possible explanation is the important difference in the prevalence of COPD, confirmed by spirometry (14.6%) or self-reported (1.3%) [27], among CHMS participants. Consequently, a substantial part of CHMS participants seems to be undiagnosed. Yet, using the NHANES cohort, Martinez and colleagues [36] demonstrated that patients with undiagnosed COPD had better lung function and health status compared to those with physician-diagnosed COPD. As previously shown [37, 38], this may explain why CHMS participants with undiagnosed COPD (13.4%) re-ported higher physical activity levels. This inconsistency may
Table 1: Weighted sample characteristics for adults with airflow obstruction consistent with COPD and the comparison group.
Control COPD Univariate test p
Sex (men), %N 47.8 (7,209,724) 55.2 (1,437,262) F � 4.8 0.03
Age (years), M (Se) 52.2 (0.2) 57.1 (0.5) t � 7.7 0.0001e−09
BMI, M (Se) 27 (0.2) 25.77 (0.3) t � −5.1 0.0004e−03
Worked at job last year, %(N)
Yes 73.8 (11,120,963) 59.6 (1,548,769)
F � 17.1 0.0007e−03
No 23.6 (3,554,449) 34.2 (888,519)
Study/retired 2.7 (400,151) 6.2 (161,012)
Marital status (alone), %(N) 23.4 (3,521,001) 35.3 (921,516) F � 14.8 0.0001
Income, %(N) <$15k 3.3 (503,026) 5.7 (148,953) F � 4 0.0004 $15k–$19.99k 2.1 (314,984) 4.7 (122,368) $20k–$29.99k 7.6 (1,145,997) 11.7 (305,177) $30k–$39.99k 9.3 (1,406,009) 13.8 (360,495) $40k–$49.99k 10 (1,510,219) 10.2 (266,676) $50k–$59.99k 8.3 (1,258,115) 9.7 (252,317) $60k–$79.99k 15.5 (2,336,038) 13 (338,775) $80k-$99.99k 12.1 (1,825,625) 8.8 (228,037) ≥$100k 31.6 (4,768,563) 22.4 (582,489) Education, %(N)
Lower than high school 4.5 (684,534) 3.7 (95 553)
F � 6.1 0.0001e−01 High school 8.7 (1,320,078) 16.7 (430,033) Work school 17 (2,560,089) 16.1 (414,645) College 9.6 (1,456,458) 6.3 (163,051) University < bachelor 12.3 (1,861,439) 7.8 (200,974) University ≥ bachelor 17.2 (2,591,464) 11.9 (304,806) Missing 30.7 (4,629,193) 37.4 (961,546)
Self-reported symptoms and disease
Self-reported COPD, %(N) 0.3 (48 394) 6.6 (172,681) F � 106.2 0.0002e−12
Cough phlegm regularly, %(N) 9.9 (1,493,964) 20.4 (531,364) F � 34.7 0.0007e−05
Simple chores make short of breath, %(N) 9.1 (1,374,510) 17.9 (466,106) F � 22.2 0.0003e−02
Self-rated health, %(N)
Fair/poor 11.2 (1,687,499) 16.6 (433,036)
F � 8.1 0.005
(Very)good/excellent 88.8 (13,381,077) 83.4 (2,172,250)
Self-rated health compared to 1 year ago, %(N)
Much better/somewhat/about the same 86.6 (13,043,443) 83.4 (2,172,889)
F � 1.7 0.19
Somewhat/much worse 13.4 (2,025,133) 16.6 (432,396)
Self-reported mood disorder, %(N) 11 (1,653,201) 11.9 (309,163) F � 0.2 0.64
Other physical or mental conditions, %(N) 20.7 (3,123,929) 17.2 (447,954) F � 1.8 0.18
Psychosocial outcomes Self-rated quality of life, %(N)
Fair/poor 6.1 (915,796) 6.7 (175,346)
F � 0.1 0.72
(Very)good/excellent 93.9 (14,158,701) 93.3 (2,424,018)
Self-rated mental health, %(N)
Fair/poor 5.4 (818,961) 7.5 (195,594)
F � 1.1 0.3
(Very)good/excellent 94.6 (14,256,256) 92.5 (2,403,050)
Self-rated stress, %(N)
Not at all/not very/a bit stressful 78.4 (11,813,678) 78.3 (2,043,899)
F � 0.002 0.97
Quite a bit/extremely stressful 21.6 (3,249,461) 21.7 (566,824)
Sleep outcomes
Sleep duration, M (Se) 7 (0.03) 7.1 (0.06) t � 0.6 0.54
Frequency of sleep problems, %(N)
Never/rarely/sometimes 77.8 (11,712,338) 74.2 (1,940,200)
F � 2.59 0.06
Most of the/all the time 22.2 (3,347,745) 25.8 (673,579)
Restorative sleep, %(N)
Never/rarely/sometimes 40.7 (6,127,211) 37.6 (982,096)
F � 1.9 0.14
Most of the/all the time 59.3 (8,932,682) 62.4 (1,631,872)
Difficulty staying awake, %(N)
Never/rarely/sometimes 95 (14,316,265) 94.7 (2,473,213)
F � 0.03 0.86
be explained, at least in part, by the fact that the classification of participants with mild-to-moderate airflow obstruction based only on spirometry data is associated with higher risk of misclassification [31].
Our results support that daily sedentary duration was not related to COPD status or severity. This finding is consistent with previous evidence showing an equivalent daily time spent among adults with self-reported COPD and controls [16]. Regarding physical activity across COPD severity, only daily time spent in MVPA was significantly lower in participants in the later stages of COPD. The lack of differences in LPA duration and number of steps across severity stages is consistent with previous data [33]. These results also suggest a floor effect due to aging, where most of the Canadian elderly have adopted a lifestyle including few MVPA [39]. COPD mainly affects LPA in everyday life and leisure, which is likely to play an important role in the deterioration of patient’s quality of life [40].
While findings suggest that there is a modest impact of COPD on these behaviors, the promotion of physical activity and prevention of prolonged sedentary time by clinicians should not be discouraged. Physical activities of light in-tensity should be considered as a priority target in the most advanced COPD patients. Indeed, physical activity and sedentary behaviors, objectively assessed, are among the strongest predictors of mortality in adults with COPD [5, 6].
4.1. Strengths and Limitations. This is the first time that
data from a representative national sample of adults have been used to compare objectively measured physical activity and sedentary variables between adults with COPD (con-firmed with spirometry data) and age-matched controls. However, the limitations of this study need to be considered when interpreting the results. First, a misclassification bias of COPD cases cannot be ruled out because only pre-bronchodilatator spirometry data were available in CHMS. The prevalence of measured airflow obstruction was two times higher than self-reported diagnosis of COPD [27]. However, this prevalence was consistent with those found in North America [41]. Second, the CHMS dataset contained no validated indicator of anxiety or depression. Yet, these parameters are known to affect the physical activity and sedentary behaviors in adults with COPD [42]. Third, the cross-sectional design did not allow inference on the evo-lution of physical activity across COPD severity stages.
5. Conclusions
In conclusion, participants with COPD did not perform a lower daily duration of MVPA and LPA, number of steps, and higher daily sedentary time than those without airflow obstruction in Canada. The daily time spent in physical activity of moderate and vigorous intensity is impaired in
Table 1: Continued.
Control COPD Univariate test p
Smoking variables
Smoking, %(N) 16.1 (2,428,599) 43 (1,121,876) F � 86.4 0.0002e−12
Age at first smoking the whole cig, M (Se) 16 (0.2) 15.5 (0.2) t � −1.8 0.07
Age at smoking everyday, M (Se) 18.9 (0.2) 19 (0.8) t � 0.1 0.95
Number of cig smoked/day when at least one cig/month, M (Se) 6.1 (0.2) 6.7 (0.3) t � 1.5 0.13
Number of years smoked daily (former daily smokers), M (Se) 18.3 (0.5) 24 (1) t � 5.2 0.0003e−03
Levels of cotinine, M (Se) 215.2 (19.1) 609.9 (60.1) t � 6.2 0.0001e−05
Spirometry
FEV1/FVC, M (Se) 0.78 (0.001) 0.64 (0.003) t � −46.6 0.0002e−12
FEV1predicted, M (Se) 103.5 (0.4) 84.9 (0.9) t � −18.8 0.0002e−12
Characteristics of physical activity and sedentary
Acc wearing time (min/day), M (Se) 13.7 (0.04) 13.8 (0.1) t � 0.5 0.63
MVPA (min/day), M (Se) 18.7 (0.6) 16.4 (1.5) t � −1.9 0.06
LPA (min/day), M (Se) 213.1 (2.8) 215.2 (5.6) t � 0.4 0.71
Steps (steps/day), M (Se) 7621.2 (111.9) 7712.7 (256.5) t � 0.3 0.74
Sed (min/day), M (Se) 557.3 (2.4) 560.6 (6.6) t � 0.4 0.66
Note. BMI � body mass index, cig � cigarette, Acc � accelerometer, LPA � light physical activity, MVPA � moderate and vigorous physical activity, Sed �
sedentary behavior.
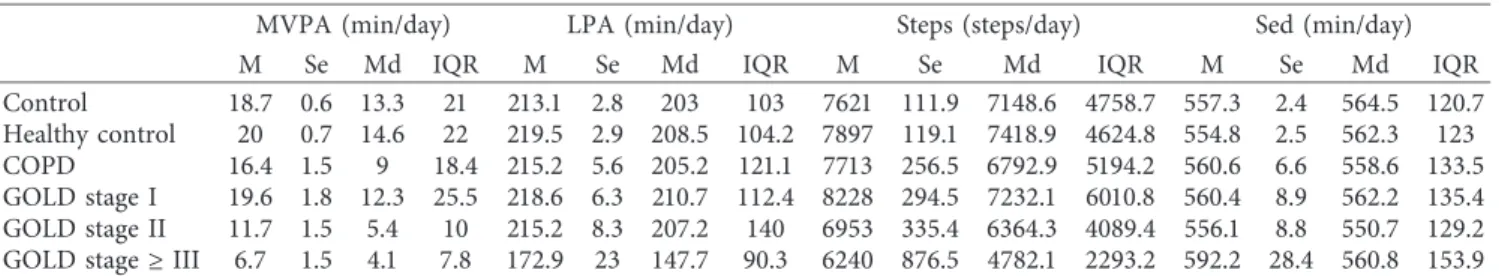
Table 2: Weighted characteristics of physical activity and sedentary.
MVPA (min/day) LPA (min/day) Steps (steps/day) Sed (min/day)
M Se Md IQR M Se Md IQR M Se Md IQR M Se Md IQR
Control 18.7 0.6 13.3 21 213.1 2.8 203 103 7621 111.9 7148.6 4758.7 557.3 2.4 564.5 120.7
Healthy control 20 0.7 14.6 22 219.5 2.9 208.5 104.2 7897 119.1 7418.9 4624.8 554.8 2.5 562.3 123
COPD 16.4 1.5 9 18.4 215.2 5.6 205.2 121.1 7713 256.5 6792.9 5194.2 560.6 6.6 558.6 133.5
GOLD stage I 19.6 1.8 12.3 25.5 218.6 6.3 210.7 112.4 8228 294.5 7232.1 6010.8 560.4 8.9 562.2 135.4 GOLD stage II 11.7 1.5 5.4 10 215.2 8.3 207.2 140 6953 335.4 6364.3 4089.4 556.1 8.8 550.7 129.2 GOLD stage ≥ III 6.7 1.5 4.1 7.8 172.9 23 147.7 90.3 6240 876.5 4782.1 2293.2 592.2 28.4 560.8 153.9
(mi n/ da y) 50 40 30 20 10 0 60 Control COPD (a) (m in /d ay) Control COPD 400 300 200 100 (b) (st eps/da y) Control COPD 15000 10000 5000 0 (c) (m in /d ay) Control COPD 800 700 600 500 400 300 (d)
Figure 1: Daily physical activity and sedentary in participants with and without COPD. (a) Moderate and vigorous physical activity (MVPA). (b) Light physical activity (LPA). (c) Steps. (d) Sedentary. x � mean. The whiskers are voluntary missing because Statistics Canada does not allow figures with individual data representation.
Table 3: Weighted ANCOVA table for COPD severity and MVPA controlling for age, body mass index, sex, accelerometer wearing time, season, work, levels of cotinine, education, income, and ∆ (FEVindv−0.7).
Estimate SE 95% CI t p COPD stages Stage I 0.02 0.09 −0.15–0.21 0.31 0.76 Stage II −0.3 0.1 −0.59–0.07 −2.49 0.01 Stage ≥ III −0.8 0.2 −1.31–0.38 −3.52 0.0005 Age −0.01 0.002 −0.01–0.008 −6.98 0.0001e−7 BMI −0.04 0.005 −0.05–0.03 −7.94 0.0001e−10
Sex (women) −0.3 0.04 −0.34–0.18 −6.26 0.0009e−6
Accelerometer wearing −0.1 0.01 0.07–0.13 6.98 0.0001e−7
Worked last year
Study/retired −0.1 0.2 −0.48–0.2 −0.82 0.41 Working 0.08 0.08 −0.07–0.23 1.1 0.27 Seasons Spring −0.03 0.08 −0.18–0.13 −0.32 0.75 Summer −0.04 0.07 −0.17–0.08 −0.68 0.5 Winter −0.1 0.1 −0.37–0.08 −1.25 0.21
Marital status (couple) −0.2 0.06 −0.31–0.05 −2.8 0.005
severe COPD adults. Our results highlight that both groups are extremely sedentary and have low duration of MVPA and LPA. Thus, a “move more and sit less” public health
strategy [43], arguing in favor of interventions targeting physical activity and sedentary behaviors could equally target adults with or without COPD.
Table 3: Continued. Estimate SE 95% CI t p Education High school 0.1 0.1 −0.1–0.3 1 0.32 Trade school 0.1 0.1 −0.1–0.3 1.02 0.49 College 0.2 0.1 −0.05–0.38 1.49 0.14 University < bachelor 0.2 0.1 0.05–0.43 2.53 0.01 Bachelor 0.4 0.1 0.16–0.64 3.23 0.001 University > bachelor 0.4 0.1 0.15–0.58 3.35 0.0009 Missing 0.1 0.09 −0.07–0.3 1.17 0.24 Household income $15k–$19.99k −0.2 0.2 −0.54–0.23 −0.79 0.43 $20k–$29.99k −0.2 0.2 −0.48–0.15 −1.01 0.32 $30k–$39.99k −0.1 0.1 −0.41–0.12 −1.06 0.29 $40k–$49.99k −0.1 0.1 −0.44–0.15 −0.95 0.34 $50k–$59.99k −0.2 0.2 −0.5–0.16 −1.02 0.31 $60k–$79.99k −0.02 0.1 −0.31–0.26 −0.16 0.87 $80k–$99.99k 0.1 0.1 −0.12–0.39 1.02 0.31 ≥$100k 0.08 0.1 −0.21–0.37 0.56 0.58 ∆ (FEVindv−0.7) −0.4 0.4 −1.17–0.29 −1.18 0.24 0 10 20 30 40 50 60 70 (mi n/ da y)
Con Mil Mod Sev (a)
(mi
n/
da
y)
Con Mil Mod Sev 400
300
200
100
(b)
Con Mil Mod Sev 20000 15000 10000 5000 0 (st eps/da y) (c) (mi n/ da y)
Con Mil Mod Sev 300 400 500 600 700 800 (d)
Figure 2: Physical activity and sedentary levels between control participants and COPD severity. (a) Moderate and vigorous physical activity (MVPA). (b) Light physical activity (LPA). (c) Steps. (d) Sedentary. Con � control, Mil � COPD mild severity, Mod � COPD moderate severity, Sev � COPD (very) severe. The whiskers are voluntary missing because Statistics Canada does not allow figures with individual representation.
Data Availability
Data access is available only in Statistics Canada Research Data Centers for researchers or students on request (no fees are due). Researchers and students need to run all analysis on-site, and only results approved by the Research Data Center coordinator can be kept by the researchers or stu-dents. The application process for data access is available at https://www.statcan.gc.ca/eng/rdc/process.
Conflicts of Interest
The authors declare that they have no conflicts of interest for this work.
Authors’ Contributions
P. Bernard conceived the study. P. Bernard and G. Moullec provided statistical expertise in the complex survey. G. Hains-Monfette and S. Atoui conducted the primary sta-tistical analyses and wrote the Results section. All authors contributed to refinement of the study protocol and ap-proved the final manuscript.
Acknowledgments
The authors would like to thank Allan Coates and Kevin Duckworth. The authors would like to thank the participants of the Canadian Health Measures Survey as well as all staff at Statistics Canada involved in the operations of the survey. P. Bernard was supported by Universit´e du Qu´ebec `a Montr´eal, Institut Universitaire de Sant´e Mentale de Montr´eal, and by a salary award from the Fonds de recherche du Qu´ebec– Sant´e. G. Hains-Monfette and S. Atoui were supported by the Quebec Inter-university Center for Social Statictics. G. Moullec holds a Chercheur-Boursier Junior 1 FRQS scholarship.
Supplementary Materials
Supplementary file 1: sample characteristics and detailed results from multivariate analyses. Supplementary file 2: sensitivity analyses with the “healthy control group.” Sup-plementary file 3: sensitivity analyses with COPD charac-terized with LLN. (Supplementary Materials)
References
[1] M. Doucet, L. Rochette, and D. Hamel, “Incidence, preva-lence, and mortality trends in chronic obstructive pulmonary disease over 2001 to 2011: a public health point of view of the burden,” Canadian Respiratory Journal, vol. 2016, Article ID 7518287, 10 pages, 2016.
[2] T. Dang-Tan, S. Zhang, R. V. Tavares et al., “The burden of illness related to chronic obstructive pulmonary disease ex-acerbations in Qu´ebec, Canada,” Canadian Respiratory Journal, vol. 2017, Article ID 8184915, 10 pages, 2017. [3] A. Gershon, G. Mecredy, R. Croxford, T. To, M. B. Stanbrook,
and S. D. Aaron, “Outcomes of patients with chronic ob-structive pulmonary disease diagnosed with or without
pulmonary function testing,” Canadian Medical Association Journal, vol. 189, no. 14, pp. E530–E538, 2017.
[4] W. Chen, J. M. FitzGerald, D. D. Sin, and M. Sadatsafavi, “Excess economic burden of comorbidities in COPD: a 15-year population-based study,” European Respiratory Journal, vol. 50, no. 1, article 1700393, 2017.
[5] B. Waschki, A. Kirsten, O. Holz et al., “Physical activity is the strongest predictor of all-cause mortality in patients with COPD,” Chest, vol. 140, no. 2, pp. 331–342, 2011.
[6] K. C. Furlanetto, L. Don´aria, L. P. Schneider et al., “Sedentary behavior is an independent predictor of mortality in subjects with COPD,” Respiratory Care, vol. 62, no. 5, pp. 579–587, 2017.
[7] G. Chevance, N. H´eraud, A. Varray, and J. Boich´e, “Change in explicit and implicit motivation toward physical activity and sedentary behavior in pulmonary rehabilitation and associ-ations with postrehabilitation behaviors,” Rehabilitation Psychology, vol. 62, no. 2, pp. 119–129, 2017.
[8] R. Mesquita, G. Spina, F. Pitta et al., “Physical activity patterns and clusters in 1001 patients with COPD,” Chronic Re-spiratory Disease, vol. 14, no. 3, pp. 256–269, 2017. [9] D. Donaire-Gonzalez, E. Gimeno-Santos, E. Balcells et al.,
“Physical activity in COPD patients: patterns and bouts,” European Respiratory Journal, vol. 42, no. 4, pp. 993–1002, 2013.
[10] H. Van Remoortel, M. Hornikx, H. Demeyer et al., “Daily physical activity in subjects with newly diagnosed COPD,” Thorax, vol. 68, no. 10, pp. 962-963, 2013.
[11] S. N. Vorrink, H. S. Kort, T. Troosters, and J.-W. J. Lammers, “Level of daily physical activity in individuals with COPD compared with healthy controls,” Respiratory Research, vol. 12, no. 1, 2011.
[12] T. Troosters, F. Sciurba, S. Battaglia et al., “Physical inactivity in patients with COPD, a controlled multi-center pilot-study,” Respiratory Medicine, vol. 104, no. 7, pp. 1005–1011, 2010. [13] P. B. Amorim, R. Stelmach, C. R. F. Carvalho,
F. L. A. Fernandes, R. M. Carvalho-Pinto, and A. Cukier, “Barriers associated with reduced physical activity in COPD patients,” Jornal Brasileiro de Pneumologia, vol. 40, no. 5, pp. 504–512, 2014.
[14] T. Saunders, N. Campbell, T. Jason et al., “Objectively measured steps/day in patients with chronic obstructive pulmonary disease: a systematic review and meta-analysis,” Journal of Physical Activity and Health, vol. 13, no. 11, pp. 1275–1283, 2016.
[15] P. Almagro and J. B. Soriano, “Underdiagnosis in COPD: a battle worth fighting,” The Lancet Respiratory Medicine, vol. 5, no. 5, pp. 367-368, 2017.
[16] S. K. Park, C. R. Richardson, R. G. Holleman, and J. L. Larson, “Physical activity in people with COPD, using the national health and nutrition evaluation survey dataset (2003–2006),” Heart and Lung, vol. 42, no. 4, pp. 235–240, 2013.
[17] M. S. Tremblay and S. Connor Gorber, “Canadian health measures survey: brief overview,” Canadian Journal of Public Health/Revue Canadienne de Sant´e Publique, vol. 98, no. 6, pp. 453–456, 2007.
[18] S. L. Wong, E. Malaison, D. Hammond, and S. T. Leatherdale, “Secondhand smoke exposure among canadians: cotinine and self-report measures from the canadian health measures survey 2007-2009,” Nicotine and Tobacco Research, vol. 15, no. 3, pp. 693–700, 2013.
[19] D. P. Heil, “Predicting activity energy expenditure using the Actical
®
activity monitor,” Research Quarterly for Exercise and Sport, vol. 77, no. 1, pp. 64–80, 2006.[20] D. W. Esliger, A. Probert, S. C. Gorber, S. Bryan, M. Laviolette, and M. S. Tremblay, “Validity of the actical accelerometer step-count function,” Medicine and Science in Sports and Exercise, vol. 39, no. 7, pp. 1200–1204, 2007.
[21] D. W. Esliger, A. V. Rowlands, T. L. Hurst, M. Catt, P. Murray, and R. G. Eston, “Validation of the GENEA accelerometer,” Medicine and Science in Sports and Exercise, vol. 43, no. 6, pp. 1085–1093, 2011.
[22] H. Demeyer, C. Burtin, H. Van Remoortel et al., “Stan-dardizing the analysis of physical activity in patients with COPD following a pulmonary rehabilitation program,” Chest, vol. 146, no. 2, pp. 318–327, 2014.
[23] R. P. Troiano, D. Berrigan, K. W. Dodd, L. C. MˆaSse, T. Tilert, and M. Mcdowell, “Physical activity in the United States measured by accelerometer,” Medicine and Science in Sports and Exercise, vol. 40, no. 1, pp. 181–188, 2008.
[24] R. C. Colley and M. S. Tremblay, “Moderate and vigorous physical activity intensity cut-points for the Actical acceler-ometer,” Journal of Sports Sciences, vol. 29, no. 8, pp. 783–789, 2011.
[25] M. R. Miller, “General considerations for lung function testing,” European Respiratory Journal, vol. 26, no. 1, pp. 153–161, 2005.
[26] J. L. Hankinson, J. R. Odencrantz, and K. B. Fedan, “Spiro-metric reference values from a sample of the general U.S. Population,” American Journal of Respiratory and Critical Care Medicine, vol. 159, no. 1, pp. 179–187, 1999.
[27] J. Evans, Y. Chen, P. G. Camp, D. M. Bowie, and L. McRae, “Estimating the prevalence of COPD in Canada: reported diagnosis versus measured airflow obstruction,” Health Re-ports, vol. 25, no. 3, pp. 3–11, 2014.
[28] A. L. Coates, S. L. Wong, C. Tremblay, and J. L. Hankinson, “Reference equations for spirometry in the canadian pop-ulation,” Annals of the American Thoracic Society, vol. 13, no. 6, pp. 833–841, 2016.
[29] M. R. Miller, “Standardisation of spirometry,” European Respiratory Journal, vol. 26, no. 2, pp. 319–338, 2005. [30] T. Lumley, Complex Surveys: A Guide to Analysis Using R,
(Wiley series in survey methodology), John Wiley, Hoboken, NJ, USA, 2010.
[31] S. D. Aaron, W. C. Tan, J. Bourbeau et al., “Diagnostic in-stability and reversals of chronic obstructive pulmonary disease diagnosis in individuals with mild to moderate airflow obstruction,” American Journal of Respiratory and Critical Care Medicine, vol. 196, no. 3, pp. 306–314, 2017.
[32] P. S. Bakke, E. Ronmark, T. Eagan et al., “Recommendations for epidemiological studies on COPD,” European Respiratory Journal, vol. 38, no. 6, pp. 1261–1277, 2011.
[33] L. Bossenbroek, M. H. G. de Greef, J. B. Wempe, W. P. Krijnen, and N. H. T. ten Hacken, “Daily physical activity in patients with chronic obstructive pulmonary dis-ease: a systematic review,” COPD: Journal of Chronic Ob-structive Pulmonary Disease, vol. 8, no. 4, pp. 306–319, 2011. [34] M. Coronado, J.-P. Janssens, B. de Muralt, P. Terrier, Y. Schutz, and J.-W. Fitting, “Walking activity measured by accelerometry during respiratory rehabilitation,” Journal of Cardiopulmonary Rehabilitation, vol. 23, no. 5, pp. 357–364, 2003.
[35] N. A. Hernandes, D. de C. Teixeira, V. S. Probst, A. F. Brunetto, E. M. C. Ramos, and F. Pitta, “Profile of the level of physical activity in the daily lives of patients with COPD in Brazil,” Jornal Brasileiro de Pneumologia, vol. 35, no. 10, pp. 949–956, 2009.
[36] C. H. Martinez, D. M. Mannino, F. A. Jaimes et al., “Undiagnosed obstructive lung disease in the United States. Associated factors
and long-term mortality,” Annals of the American Thoracic Society, vol. 12, no. 12, pp. 1788–1795, 2015.
[37] A. van Buul, M. Kasteleyn, N. Chavannes, and C. Taube, “The association between objectively measured physical activity and morning symptoms in COPD,” International Journal of Chronic Obstructive Pulmonary Disease, vol. 12, pp. 2831– 2840, 2017.
[38] A. R. van Buul, M. J. Kasteleyn, N. H. Chavannes, and C. Taube, “Association between morning symptoms and physical activity in COPD: a systematic review,” European Respiratory Review, vol. 26, no. 143, article 160033, 2017. [39] R. C. Colley, D. Garriguet, I. Janssen, C. L. Craig, J. Clarke,
and M. S. Tremblay, “Physical activity of canadian adults: accelerometer results from the 2007 to 2009 canadian health measures survey,” Health Reports, vol. 22, no. 1, pp. 7–14, 2011.
[40] H. Watz, F. Pitta, C. L. Rochester et al., “An official European Respiratory Society statement on physical activity in COPD,” European Respiratory Journal, vol. 44, no. 6, pp. 1521–1537, 2014.
[41] D. Adeloye, S. Chua, C. Lee et al., “Global and regional es-timates of COPD prevalence: systematic review and meta– analysis,” Journal of Global Health, vol. 5, no. 2, 2015. [42] H. Q. Nguyen, V. S. Fan, J. Herting et al., “Patients with COPD
with higher levels of anxiety are more physically active,” Chest, vol. 144, no. 1, pp. 145–151, 2013.
[43] D. E. R. Warburton and S. S. D. Bredin, “Reflections on physical activity and health: what should we recommend?,” Canadian Journal of Cardiology, vol. 32, no. 4, pp. 495–504, 2016.
Stem Cells
International
Hindawi www.hindawi.com Volume 2018 Hindawi www.hindawi.com Volume 2018 INFLAMMATIONEndocrinology
International Journal ofHindawi www.hindawi.com Volume 2018 Hindawi www.hindawi.com Volume 2018
Disease Markers
Hindawi www.hindawi.com Volume 2018 BioMed Research InternationalOncology
Journal of Hindawi www.hindawi.com Volume 2013 Hindawi www.hindawi.com Volume 2018Oxidative Medicine and Cellular Longevity
Hindawi
www.hindawi.com Volume 2018
PPAR Research
Hindawi Publishing Corporation
http://www.hindawi.com Volume 2013 Hindawi www.hindawi.com
The Scientific
World Journal
Volume 2018 Immunology Research Hindawi www.hindawi.com Volume 2018 Journal ofObesity
Journal of Hindawi www.hindawi.com Volume 2018 Hindawi www.hindawi.com Volume 2018 Computational and Mathematical Methods in Medicine Hindawi www.hindawi.com Volume 2018Behavioural
Neurology
Ophthalmology
Journal of Hindawi www.hindawi.com Volume 2018Diabetes Research
Journal ofHindawi
www.hindawi.com Volume 2018
Hindawi
www.hindawi.com Volume 2018
Research and Treatment
AIDS
Hindawi
www.hindawi.com Volume 2018
Gastroenterology Research and Practice
Hindawi www.hindawi.com Volume 2018