HAL Id: tel-02067269
https://pastel.archives-ouvertes.fr/tel-02067269
Submitted on 14 Mar 2019HAL is a multi-disciplinary open access archive for the deposit and dissemination of sci-entific research documents, whether they are pub-lished or not. The documents may come from teaching and research institutions in France or abroad, or from public or private research centers.
L’archive ouverte pluridisciplinaire HAL, est destinée au dépôt et à la diffusion de documents scientifiques de niveau recherche, publiés ou non, émanant des établissements d’enseignement et de recherche français ou étrangers, des laboratoires publics ou privés.
and priors on gene networks and images
Aurelie Pirayre
To cite this version:
Aurelie Pirayre. Reconstruction and clustering with graph optimization and priors on gene net-works and images. Signal and Image Processing. Université Paris-Est, 2017. English. �NNT : 2017PESC1170�. �tel-02067269�
´
Ecole Doctorale Math´
ematiques et Sciences et
Technologies de l’Information et de la Communication
Universit´
e Paris-Est
TH`
ESES
Sp´ecialit´e: Traitement du Signal et Image
pr´esent´ee par
Aur´elie PIRAYRE
soutenue le03 juillet 2017
Reconstruction
et
Classification
avec
Optimisation sur graphes
et
a priori
pour
R´
eseaux de g`
enes
et
Images
Rapporteurs: Pascal FROSSARD EPFL
Jean-Philippe VERT Mines ParisTech
Examinateurs: St´ephane ROBIN INRA
Hugues TALBOT Labinfo IGM
Directeur de th`ese: Jean-Christophe PESQUET CentraleSup´elec
Co-encadrants: Laurent DUVAL IFP Energies nouvelles
Camille COUPRIE Facebook A.I. Research Fr´ed´erique BIDARD-MICHELOT IFP Energies nouvelles
“J’entends, j’oublie.
Je vois, je me souviens.
Je fais, je comprends”
Abstract
The discovery of novel gene regulatory processes improves the understanding of cell phenotypic responses to external stimuli for many biological applications, such as medicine, environment or biotechnologies. To this purpose, transcriptomic data are generated and analyzed from DNA microarrays or more recently RNAseq experiments. They consist in genetic expression level se-quences obtained for all genes of a studied organism placed in different living conditions. From these data, gene regulation mechanisms can be recovered by revealing topological links encoded in graphs. In regulatory graphs, nodes correspond to genes. A link between two nodes is identi-fied if a regulation relationship exists between the two corresponding genes. Such networks are called Gene Regulatory Networks (GRNs). Their construction as well as their analysis remain challenging despite the large number of available inference methods.
In this thesis, we propose to address this network inference problem with recently developed techniques pertaining to graph optimization. Given all the pairwise gene regulation information available, we propose to determine the presence of edges in the final GRN by adopting an en-ergy optimization formulation integrating additional constraints. Either biological (information about gene interactions) or structural (information about node connectivity) a priori have been considered to restrict the space of possible solutions. Different priors lead to different properties of the global cost function, for which various optimization strategies, either discrete and continu-ous, can be applied. The post-processing network refinements we designed led to computational approaches named BRANE for “Biologically-Related A priori for Network Enhancement”. For each of the proposed methods — BRANE Cut, BRANE Relax and BRANE Clust — our contributions are threefold: a priori-based formulation, design of the optimization strategy and validation (numerical and/or biological) on benchmark datasets from DREAM4 and DREAM5 challenges showing numerical improvement reaching 20 %.
In a ramification of this thesis, we slide from graph inference to more generic data processing such as inverse problems. We notably invest in HOGMep, a Bayesian-based approach using a Variational Bayesian Approximation framework for its resolution. This approach allows to jointly perform reconstruction and clustering/segmentation tasks on multi-component data (for instance signals or images). Its performance in a color image deconvolution context demonstrates both quality of reconstruction and segmentation. A preliminary study in a medical data classification context linking genotype and phenotype yields promising results for forthcoming bioinformatics adaptations.
R´esum´e
Le couplage entre des ph´enom`enes croissants de pollution mondiale, de gaz `a effet de serre, de r´echauffement climatique et de diminution des ressources ´energ´etiques fossiles soul`eve des probl´ematiques environnementales pour le futur, n´ecessitant de ce fait le d´eveloppement de nou-velles ´energies, dites alternatives. C’est le cas des biocarburants, et notamment le bio´ethanol, qui connait maintenant un regain d’int´erˆet.
Alors que les biocarburants de premi`ere g´en´eration — obtenus `a partir de cultures sucri`eres et amylac´ees — sont vivement controvers´es en raison de leur comp´etitivit´e avec la fili`ere agro-alimentaire, un attachement particulier a ´et´e donn´e au d´eveloppement des biocarburants dits de seconde g´en´eration. Ces derniers sont obtenus `a partir de biomasse lignocellulosique (v´eg´etaux non comestibles ou r´esidus). Le proc´ed´e classique de production de bio´ethanol suivant le proc´ed´e de seconde g´en´eration consiste en trois grandes ´etapes : i) un pr´e-traitement permettant d’ex-traire la cellulose — un polym`ere de glucoses — contenue dans la biomasse, ii) une hydrolyse de la cellulose en monom`eres de glucose, cette hydrolyse ´etant r´ealis´ee par un cocktail d’enzymes d´edi´ees et enfin iii) une fermentation des mol´ecules de glucose en ´ethanol. Cependant, la pro-duction d’enzymes et la phase d’hydrolyse repr´esentent `a elles seules quelques 30 % du coˆut de l’´ethanol produit, limitant ainsi la viabilit´e ´economique du proc´ed´e. Une recherche active est donc n´ecessaire pour am´eliorer `a moindre coˆut la production d’enzymes.
La production d’enzymes cellulolytiques n´ecessaire `a la conversion cellulose/sucre se fait, d’apr`es le choix des acteurs industriels, par un champignon filamenteux, Trichoderma reesei . Afin d’am´eliorer ses rendements de production, une optimisation g´en´etique de ce champignon peut ˆetre envisag´ee. C’est notamment ce qui a ´et´e fait au cours des ann´ees 1980, par l’utilisation de mutagen`ese al´eatoires. Ces manipulations g´en´etiques ont permis de s´electionner des souches hyper-productrices. Cependant, l’utilisation de mutagen`eses al´eatoires semble avoir maintenant atteint ses limites et des approches dirig´ees sont `a privil´egier. Une optimisation g´en´etique par mutagen`ese dirig´ee requiert cependant d’avoir une bonne connaissance du processus de produc-tion d’enzymes par le champignon. L’informaproduc-tion, trop parcimonieuse, que nous avons sur les m´ecanismes fins de T. reesei nous am`ene donc dans un premier temps `a mieux connaˆıtre et com-prendre le fonctionnement g´en´etique de ce champignon lors de sa production d’enzymes cellulo-lytiques. Les biologistes recourent aux donn´ees “-omiques”, qui offrent un acc`es sans pr´ec´edent `
a des m´ecanismes biologiques fondamentaux, `a diff´erentes ´echelles. Les donn´ees, g´en´er´ees en volume important, font appel `a des comp´etences pluridisciplinaires, `a l’intersection des biotech-nologies et du d´eveloppement d’analyse algorithmique, pour une int´egration et une interpr´etation effectives.
Partant du postulat que la production de prot´eines (que sont les enzymes) est li´ee `a l’expres-sion des g`enes sous-jacents, la compr´ehenl’expres-sion du m´ecanisme de production de prot´eines peut ˆetre obtenue par celle des m´ecanismes d’expression des g`enes et donc leur r´egulation. La r´egulation des g`enes fait elle-mˆeme intervenir des prot´eines, issues elles-mˆemes de g`enes. On comprend alors que la d´etection d’interactions entre g`enes permet de comprendre leurs m´ecanismes de r´egulation et donc d’expression menant `a terme aux prot´eines. Pour ce faire, les ´etudes trans-criptomiques nous permettent d’avoir acc`es, pour une population de cellules donn´ees dans des conditions exp´erimentales bien choisies, au niveau d’expression de tous les g`enes. En recueillant les niveaux d’expression des g`enes pour ces diff´erentes conditions exp´erimentales, des profils d’expression des g`enes sont ainsi obtenus. `A partir de ces profils d’expression, il est alors pos-sible apr`es traitements d’en d´eduire des interactions entre g`enes. Ces interactions peuvent ˆetre mod´elis´ees sous la forme de graphes, o`u les nœuds correspondent aux g`enes et les liens entre les nœuds aux interactions entre g`enes. De tels graphes sont appel´ees des R´eseaux de R´egulation de G`enes (RRGs). C’est dans ce contexte que cette th`ese s’inscrit, o`u les contributions propos´ees portent sur le d´eveloppement d’outils bio-informatiques visant `a construire des RRGs `a partir de donn´ees transcriptomiques. Cette partie introductive est notamment d´etaill´ee dans le chapitre2. La construction de RRGs `a partir de donn´ees transcriptomiques peut ˆetre vue comme un proc´ed´e en deux ´etapes : i) calcul d’un poids pour chaque arˆete du graphe complet et ii) seuillage de ces poids pour garder les liens significatifs. Comme le d´etaille l’´etude bibliographique du cha-pitre 3, le d´eveloppement de m´ethodes d’inf´erence de RRGs porte essentiellement sur l’´etape de calcul du poids. Afin de compl´eter une m´ethode de calcul de poids satisfaisante, nous avons concentr´e nos efforts sur le d´eveloppement de m´ethodes de s´election d’arˆetes, plus puissantes qu’un simple seuillage sur les poids. Pour ce faire, le probl`eme de seuillage classique a ´et´e formul´e `
a l’aide d’une fonction objectif `a optimiser, qui d´epend de variables binaires portant sur chaque arˆete et t´emoignant de la pr´esence ou de l’absence de l’arˆete dans le graphe final. La r´esolution du probl`eme ainsi formul´e peut paraˆıtre triviale mais cette formulation donne ainsi une base pour de potentielles am´eliorations, notamment par l’ajout de termes de r´egularisation bien choisis : notre d´emarche a ´et´e d’encoder, `a travers ces termes de r´egularisation additionnels, des a priori biologiques sur les m´ecanismes de r´egulation des g`enes et/ou structuraux sur les r´eseaux atten-dus. Les diff´erents a priori choisis ont donn´e lieu `a des fonctions objectifs dont les propri´et´es requi`erent le choix d’algorithmes d´edi´es. Les diff´erents a priori biologiques que nous avons for-mul´es font ´etat d’une connaissance pr´ealable sur des g`enes codant pour des prot´eines appel´ees facteurs de transcription. Ces prot´eines sont des acteurs de premier plan dans la r´egulation des g`enes et l’information qu’elles portent est donc `a promouvoir. Ce travail de th`ese a men´e `a un ensemble d’approches computationnelles nomm´e BRANE, pour “Biologically Related A priori for Network Enhancement”. Les diff´erentes m´ethodes de s´election d’arˆetes d´evelopp´ees dans cette th`ese peuvent ˆetre per¸cues comme des m´ethodes de post-traitement `a utiliser sur des graphes pleinement connect´es et pond´er´es.
Le chapitre 4est d´edi´e `a la pr´esentation de BRANE Cut, notre premi`ere strat´egie de s´election d’arˆetes. En plus de s´electionner les arˆetes fortement pond´er´ees comme dans le seuillage clas-sique, la fonction objectif que nous avons con¸cue permet de promouvoir une structure modulaire
v dans les r´eseaux inf´er´es. Par ailleurs, un a priori de co-r´egulation de g`enes est ´egalement pris en compte par l’ajout d’un terme de r´egularisation permettant un couplage dans l’inf´erence d’arˆetes mettant en jeu des couples de facteurs de transcription agissant en coop´eration. La formulation finale du probl`eme prend la forme d’une fonction objectif ressortissant aux probl`emes de coupe minimale dans un graphe. Par dualit´e (minimum cut/maximal flow ), notre probl`eme d’optimi-sation discr`ete est r´esolu grˆace `a l’algorithme de flot maximal. Les performances de BRANE Cut ont ´et´e valid´ees sur des donn´ees simul´ees issues des challenges DREAM4 et DREAM5 avant que d’ˆetre ´egalement valid´ees sur donn´ees r´eelles provenant d’un organisme bact´erien tel que Escheri-chia coli ou de notre champignon d’´etude Trichoderma reesei . En compl´ement d’une validation de la m´ethode, des comparaisons avec des m´ethodes ´etat de l’art telles que CLR, GENIE3 ou encore le post-traitement Network Deconvolution (ND) ont permis de mettre en ´evidence les am´eliorations fournies par BRANE Cut, tant sur le plan de la performance num´erique (avec des am´eliorations atteignant environ 11 %) que de l’interpr´etation biologique des r´eseaux inf´er´es. Dans le mˆeme ´etat d’esprit que BRANE Cut, une seconde strat´egie, nomm´ee BRANE Relax, a ´et´e d´evelopp´ee. Le chapitre 5 lui est consacr´e. Comme pr´ec´edemment, la fonction objectif d´efinie favorise la s´election d’arˆetes de fort poids en plus de fournir un r´eseau modulaire. Dans cette approche, l’a priori de co-r´egulation a ´et´e remplac´e par un a priori sur la connectivit´e des g`enes autres que ceux identifi´es comme codant pour un facteur de transcription. La formulation r´esultante, dans sa forme discr`ete, ne peut ˆetre optimis´ee par des algorithmes d’optimisation combinatoire. En revanche, en relaxant le probl`eme dans le domaine continu, il est alors possible de le r´esoudre `a l’aide d’un algorithme de gradient projet´e. Cependant ce type d’algorithme, connu pour sa potentielle lenteur de convergence dans le cas de probl`emes de grandes dimen-sions, peut ˆetre acc´el´er´e par l’introduction de matrices de pr´e-conditionnement issues du principe de Majoration-Minimisation coupl´ee `a des strat´egies par blocs. L’approche propos´ee a ´et´e valid´ee et compar´ee `a des m´ethodes de l’´etat de l’art (CLR, GENIE3 et le post-traitement ND) sur des donn´ees synth´etiques de parangonnage issues des challenges DREAM4 et DREAM5 et montre des am´eliorations pouvant atteindre 8 %, environ.
En compl´ement de l’inf´erence de r´eseaux, la classification des g`enes par rapport `a leurs profils d’expression est ´egalement une pratique tr`es courante dans le traitement de donn´ees transcrip-tomiques. Cette classification a pour but de regrouper les g`enes ayant des profils d’expression similaires, au sens d’un certain crit`ere. Ces groupes de g`enes sont ensuite ´etudi´es plus en d´etail afin de d´eterminer si des fonctions particuli`eres ressortent de ces groupes de g`enes, pouvant po-tentiellement appartenir `a une mˆeme voie biologique. Cependant, cette classification est souvent men´ee de fa¸con ind´ependante `a l’inf´erence de r´eseaux. Afin d’am´eliorer l’inf´erence et son in-terpr´etation, l’int´egration d’une information de groupement des g`enes est propos´ee dans BRANE Clust. En effet, comme d´etaill´e dans le chapitre 6 d´edi´e `a BRANE Clust, la fonction objectif que nous proposons a ´et´e con¸cue pour p´enaliser les arˆetes liant des nœuds appartenant `a des clus-ters distincts. Pour ce faire, en compl´ement des variables binaires sur les arˆetes, des variables discr`etes (mais non n´ecessairement binaires) sont ´egalement d´efinies sur les nœuds. Ces variables encodent le label de la partition auquel le nœud est assign´e. Par cons´equent, la classification n’est pas calcul´ee de fa¸con ind´ependante mais est coupl´ee `a l’inf´erence. Une contrainte sur la construction de classes centr´ees sur les facteurs de transcription permet de favoriser une
struc-ture modulaire dans le r´eseau final. Une strat´egie d’optimisation altern´ee peut ˆetre mise en place pour r´esoudre ce probl`eme. Le sous-probl`eme portant sur l’inf´erence `a proprement parler peut se r´esoudre de fa¸con explicite, alors que le sous-probl`eme de classification peut ˆetre r´esolu, apr`es relaxation, par une r´esolution de syst`emes lin´eaires. Cette approche a ´et´e valid´ee `a la fois sur des donn´ees synth´etiques et r´eelles issues des challenges DREAM4 et DREAM5. Des am´eliorations par rapport aux m´ethodes ´etats de l’art (CLR, GENIE3 et ND) ont ´egalement ´et´e d´emontr´ees, autant en termes de performances num´eriques (avec des gains atteignant 20 %) qu’en termes d’interpr´etations biologiques faites sur un r´eseau inf´er´e `a partir de donn´ees sur la bact´erie Es-cherichia coli .
Ce travail de th`ese a donc permis le d´eveloppement de deux m´ethodes principales (BRANE Cut and BRANE Clust) et d’une plus interm´ediaire (BRANE Relax) pour la s´election d’arˆetes dans le contexte de r´eseaux de r´egulation de g`enes. Ces m´ethodes se basent sur une formulation va-riationnelle d’un probl`eme d’optimisation int´egrant des a priori biologiques et/ou structuraux. Ces m´ethodes, qui peuvent ˆetre utilis´ees en post-traitement des m´ethodes classiques d’inf´erence, ont su faire leurs preuves sur des donn´ees synth´etiques aussi bien que r´eelles. Cependant, en compl´ement de ce travail essentiellement orient´e sur l’inf´erence de r´eseaux de r´egulation de g`enes, nous avons men´e des travaux vers des traitements de graphes plus g´en´eriques, dans le contexte des probl`emes inverses. Ce travail pr´eliminaire, pr´esent´e dans le chapitre 7, a ´et´e pens´e en vue d’adaptations `a des probl´ematiques plus larges, incluant la biologie. Il a permis de valoriser un travail g´en´erique autour d’HOGMep, une m´ethode bay´esienne d´evelopp´ee pour effectuer conjointement des tˆaches de restauration et de classification sur des donn´ees multi-composantes. Les performances d’HOGMep ont ´et´e ´eprouv´ees et valid´ees dans deux contextes tr`es distincts. Une premi`ere application en d´econvolution d’images couleur a d’abord ´et´e abord´ee. Des am´eliorations, tant sur le plan de la reconstruction que celui de la segmentation, ont ainsi pu ˆetre d´emontr´ees. Enfin, son utilit´e pour la classification de donn´ees d’expression de g`enes dans un contexte m´edical de relations g´enotype/ph´enotype a ´egalement ´et´e ´etablie. La valida-tion de ces performances est une premi`ere ´etape vers une adaptavalida-tion potentielle de HOGMep `a des probl`emes de biologie plus pouss´es.
Enfin, un r´ecapitulatif des contributions r´ealis´ees durant cette th`ese ainsi que plusieurs pers-pectives sont pr´esent´es dans le chapitre 8.
Acronyms
AIC Akaike Information Criterion. ANOVA ANalysis Of Variance.
ARACNE Algorithm for the Reconstruction of Accurate Cellular NEtwork. BIC Bayesian Information Criterion.
BN Bayesian network.
BRANE Biologically-Related A priori for Network Enhancement. C3Net Conservative Causal Core.
CAST Cluster Affinity Search Technique. cDNA complementary DNA.
CLR Context Likelihood of Relatedness. CMI Conditional Mutual Information. CPM Counts Per Million.
DINGO Differential network analysis in genomics. DNA DesoxyriboNucleic Acid.
DPI Data Processing Inequality.
DREAM Dialogue on Reverse Engineering Assessment and Methods. EM Expectation-Maximization.
FN False Negative. FP False Positive.
GEO Gene Expression Omnibus.
GGM Gaussian Graphical Models. GH Glycosyl Hydrolase.
GNW GeneNetWeaver. GO Gene Ontology.
GRN Gene Regulatory Network.
KEGG Kyoto Encyclopedia of Genes and Genomes. lasso Least Absolute Shrinkage and Selection Operator. LOWESS LOcally WEighted Scatterplot Smoothing. Med Median.
MEME Multiple EM for Motif Elicitation. MeV MultiExperiment Viewer.
MI3 Mutual Information 3.
MIC Maximal Information Coefficient. MM Majorize-Minimize.
MRMR Maximum Relevance/Minimum Redundancy. mRNA messenger RNA.
MRNET Minimum Redundancy NETworks. NB negative binomial.
NGS Next Generation Sequencing. PCR Polymerization Chain Reaction. PGM Probabilistic Graphical Model. PMT photomultiplier.
Q Quantile.
RMA Robust Multichip Averaging. RN Relevance Network.
Acronyms ix ROC Receiver Operator Characteristics.
RPKM Reads Per Kilobase per Million mapped reads. RSAT Regulatory Sequence Analysis Tools.
SAM Significance Analysis of Microarrays. SCAD Smoothly Clipped Absolute Deviation. SIMoNe Statistical Inference for Modular Networks. SNP Single Nucleotide Polymorphisme.
SVD Singular Value Decomposition. TC Total Counts.
TGD Threshold Gradient Descent. TMM Trimmed Mean of M-values. TN True Negative.
TP True Positive. UQ Upper Quartile.
VI Variation of Information.
Glossary
biological replicates for a given experimental condition, different cultures of same cells are prepared in parallel
.
dual knockdown steady-state level for two simultaneously deleted genes.
knockdown steady-state level of a single-gene knockdown leading to a transcription rate arbi-trary decreased to twice.
knockout steady-state level of a deleted genes leading to a gene transcription rate equals to 0. multifactorial steady-state levels of all genes after multifactorial perturbations. This simu-lation tends to simultaneously increase or decrease all basal expression level by different random amounts.
technical replicates for a given experimental condition, a unique cell culture is firstly pro-cessed and split just before hybridization
.
wild type steady-state level of the unperturbed gene.
Contents
Abstract i Resume iii Acronyms vii Glossary xi 1 Introduction 11.1 Context and motivations . . . 1
1.2 Contributions . . . 3
1.3 Publications, communications and codes . . . 4
1.4 Outlines . . . 7
2 Methodology 9 2.1 Biological prerequisites . . . 10
2.2 Data acquisition and collections . . . 11
2.2.1 DNA microarray principles and data. . . 12
2.2.2 RNA-seq principles and data . . . 15
2.2.3 Benchmark data: simulated and real compendium . . . 17
2.3 Gene expression pre-processing . . . 19
2.3.1 Biases and normalization. . . 19
2.3.2 Differential expression and gene selection . . . 28
2.4 Gene Regulatory Network (GRN) inference . . . 32
3 An overview of related works in GRN inference 37 3.1 GRN inference methods . . . 38
3.1.1 Metric-based inference . . . 39
3.1.2 Model-based inference . . . 41
3.1.3 Ancillary inference methods . . . 50
3.2 Evaluation methodology . . . 53
3.2.1 Datasets and methods . . . 53
3.2.2 Inference metrics and databases . . . 58
3.2.3 Clustering metrics and databases . . . 63
3.3 Graph optimization and algorithmic frameworks . . . 65 xiii
3.3.1 Optimization view point for edge selection . . . 65
3.3.2 Maximal flow for discrete optimization . . . 67
3.3.3 Random walker for multi-class and relaxed optimization . . . 70
3.3.4 Proximal methods for continuous optimization. . . 72
3.3.5 Majorize-Minimize (MM) method . . . 76
4 Edge selection refinement using gene co-regluation a priori (BRANE Cut) 79 4.1 BRANE Cut: gene co-regulation a priori . . . 80
4.1.1 Biological a priori and problem formulation . . . 80
4.1.2 Optimization via a maximal flow framework . . . 83
4.1.3 Objective results and biological interpretation . . . 87
4.2 BRANE Cut: application on Trichoderma reesei . . . 101
4.2.1 Actual knowledge on T. reesei cellulase production system . . . 101
4.2.2 Dataset and preludes . . . 102
4.2.3 New insights on cellulase production . . . 106
4.3 Conclusions on BRANE Cut . . . 109
5 Edge selection refinement using gene connectivity a priori (BRANE Relax) 111 5.1 BRANE Relaxproblem formulation . . . 112
5.1.1 Gene connectivity a priori . . . 112
5.1.2 Initial formulation and relaxation . . . 114
5.2 BRANE Relax: optimization via a proximal framework . . . 114
5.2.1 Preconditioning . . . 116
5.2.2 Block-coordinate descent strategy . . . 117
5.3 BRANE Relax: objective results on benchmark datasets. . . 119
5.3.1 Numerical performance on DREAM4 . . . 119
5.3.2 Impact of the function Φ . . . 123
5.3.3 Numerical performance on DREAM5 . . . 125
5.3.4 Speed-up performance . . . 126
5.4 Conclusions on BRANE Relax . . . 126
6 Edge selection refinement using node clustering (BRANE Clust) 133 6.1 Complemental works on joint clustering and inference. . . 134
6.2 BRANE Clust with hard -clustering . . . 135
6.2.1 Problem formulation . . . 135
6.2.2 Optimization framework . . . 137
6.2.3 Objective results. . . 139
6.3 BRANE Clust with soft-clustering . . . 145
6.3.1 Problem formulation . . . 145
6.3.2 Optimization framework: alternating clustering and inference. . . 146
6.3.3 Objective results and biological interpretation . . . 149
Contents xv
7 Joint segmentation and restoration with higher-order graphical models
(HOG-Mep) 169
7.1 Background on inverse problems. . . 170
7.1.1 Importance of inverse problems . . . 170
7.1.2 Methodologies for solving inverse problems . . . 170
7.1.3 Variational Bayesian Approximation theory . . . 173
7.2 HOGMep: multi-component signal segmentation and restoration . . . 175
7.2.1 Brief review on image segmentation and/or restoration. . . 175
7.2.2 Inverse problem formulation and priors . . . 177
7.2.3 Variational Bayesian Approximation and algorithm . . . 181
7.3 HOGMep: application to image processing and biological data . . . 184
7.3.1 Joint multi-spectral image segmentation and deconvolution . . . 184
7.3.2 Biological application . . . 194
7.4 Conclusions on HOGMep . . . 196
8 Conclusions and perspectives 199 8.1 Conclusions . . . 199
8.1.1 BRANE strategy: gene networks as graphs and a priori-based optimization 199 8.1.2 HOGMepfor a wide graph-based processing . . . 201
8.2 Perspectives . . . 201 8.2.1 Biological-related perspectives . . . 201 8.2.2 Signal/image-related perspectives . . . 203 List of figures 207 List of tables 211 Bibliography 213
| 1 |
Introduction
1.1
Context and motivations
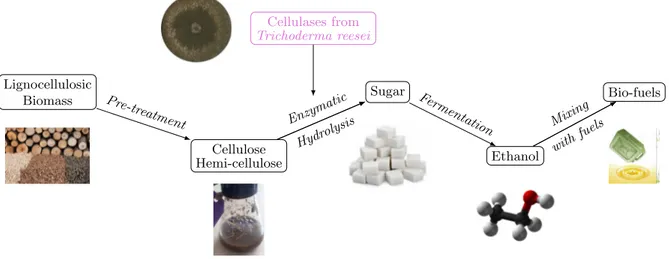
The emergence of industrial bio-processes represents a major challenge, in the context of the energy transition or the “Nouvelle France Industrielle (NFI)” project, for instance. Related re-search activities include production processes for second-generation bio-fuels, making it possible to recycle plant waste by converting lignocellulose (a non-food component, produced by plant walls) into sugars that are ethanol precursors.
In production processes based on lignocellulosic biomass (Figure 1.1), one of the crucial stages — and, above all, one of the most expensive — is the production of cellulases (enzymes) capable of making this conversion competitive. To improve this stage, we need to gain a clearer understanding of enzyme-producing microorganisms, such as Trichoderma reesei , a filamentous fungus. Cellulases from Trichoderma reesei Lignocellulosic Biomass Cellulose Hemi-cellulose Sugar Ethanol Bio-fuels Enzym atic Hydro lysis Pre-treatm ent Ferm
entation Mixing with
fuels
Figure 1.1 ∼ Scheme of second generation bio-fuels process ∼ The costliest step to be improved is highlighted in pink color.
Research protocols focusing on understanding living organisms have significantly been boosted by the emergence of what are known as “omic” technologies. Such data provide unprecedented access, on different scales, to fundamental biological mechanisms, thereby providing an abun-dance of complex information about how cells work. Analysis of the genome (DNA sequences),
the transcriptome (gene expression), or the metabolome (molecules produced by metabolism) are a few examples. Experiments of this type generate high volumes of data, offering a wealth of potential information but demanding cross-disciplinary skills, at the intersection of biotechnolo-gies and algorithmic analysis development, for its effective integration and interpretation (Vert,
2013).
From this “omics” data, a large panel of bioinformatic tools is available. Specifically focusing on transcriptomic data allows us to better understand the genetic mechanisms yielding protein production. These data correspond — for a population of cells placed in various experimental conditions — to gene expression levels. They reflect, in a given experimental condition, which genes are actives and in which level. This kind of data require complex treatments, generally performed in an independent manner, encompassing various tasks at different scales: from the acquisition to the extraction of useful information. Briefly, classical bioinformatic workflows deal with image processing for acquiring data i.e. quantify the gene activity. Afterward, data normalization is performed in order to more rigorously compare gene expression level between experimental conditions. Statistical analysis is then usually carried out in order to detect genes having a particular behavior in at least one of the studied experimental conditions. Additional stages may then be performed in order to deeply explore the data. Notably, gene clustering allows us to group genes sharing similar gene expression levels across various experimental conditions. Grouped genes are expected to share similar genetic functions or to belong to a same biological pathway. Finally, constructing a graph encoding gene regulations is also a task of interest. In such graphs, nodes and edges are respectively derived from genes and their correlations or reg-ulations. The resulting network is called a Gene Regulatory Network (GRN). Inferring GRNs from gene expression data is especially useful for sketching transcriptional regulatory pathways and helps to understand phenotype variations. However, these graphs, involving thousands of genes, are difficult to construct, visualize or analyze, especially when incorporating either exper-imental uncertainties or additional information retrieved from similar organisms. Despite the large number of available GRN inference methods, the problem remains challenging due to the under-determination in the space of possible solutions. Classical inference approaches rely on metric- or model-based strategies for assigning at each edge a weight reflecting the strength of the link between two genes. From these weights, the final curated network is then obtained after selecting only edges deemed relevant.
While all steps of such classical bioinformatic workflows (from data acquisition to data inter-pretation) are essential and cannot be neglected, in this thesis, our main focus was laid on the construction of GRNs. Although weights computation is a crucial step, the criterion defining which edges are relevant also reveals decisive. Our main contributions, summarized in the fol-lowing section, rely on the establishment of novel criteria and the associated graph optimization methods for edge selection improvement in the context of the GRNs.
1.2. Contributions 3
1.2
Contributions
Given all the pairwise gene regulation information available (i.e. edge weights), we propose to determine the presence of edges in the final GRN by adopting an energy optimization for-mulation. To refine inference results by restricting the space of possible solutions, additional constraints are incorporated into our models. Some constraints, reflecting either biological (in-formation about gene interactions) or structural (in(in-formation about node connectivity) a priori , have been considered. Different priors lead to different mathematical properties of the global cost function, for which various optimization strategies can be applied. Optimization strategies are inspired by recent graph optimization works in image processing and computer vision, where pixels and their connectivity are used to interpret images at a higher level. The post-processing network refinements we proposed led to a set of computational approaches named BRANE∗∗∗ for “Biologically-Related A priori for Network Enhancement”. For each of the propose methods, our contributions are threefold: a priori -based formulation, design of the optimization strategy and validation (numerical and/or biological) on benchmark datasets.
⋆ BRANE Cut (Chapter4): it is our first edge selection strategy proposal for GRN refinement. The cost function we designed enforces a modular network arranged around central nodes, while a gene co-regulation a priori is used to constrain the space of possible solutions. When the co-regulation criterion we define is satisfied, a coupled edge inference is favored. The combination of this a priori allows us to formulate the problem as a minimum cut problem (also known as Graph Cuts in computer vision). Thanks to the duality between minimal cut and maximal flow, the proposed formulation can be solved using an efficient maximal flow algorithm pertaining to the class of discrete optimization algorithms. We also performed a numerical and biological evaluation of our proposed approach thanks to benchmark synthetic and real datasets. Comparisons performed with state-of-the-art methods are in favor of BRANE Cut (Pirayre et al.,2015a).
⋆ BRANE Relax (Chapter5): this second edge selection strategy is in the same vein as BRANE Cut, as the cost function we designed also enforces network modularity. Based on a bio-logical postulate we additionally restrain the space of possible solutions by restricting the connectivity degree of particular nodes. The resulting discrete optimization problem is re-laxed into a continuous one. A proximal splitting strategy yielding the use of a projected gradient algorithm is thus used for its resolution. Due to the potential high dimensionality of the problem, acceleration tricks relying on preconditioning and block coordinate strategy are complementary used. Performance of BRANE Relax is demonstrated through benchmark simulated datasets and shows improvement over state-of-the-art methods (Pirayre et al.,
2015b).
While BRANE Cut and BRANE Relax are exclusively focused on edge selection for GRN refinement, the last method we propose was thought to integrate gene clustering and GRN tasks in a jointly manner instead of an independent one. This approach was motivated by the drive to reduce the number of independent treatments classically performed on transcriptomic data, toward a tighter integration of elementary tasks in omics workflows.
⋆ BRANE Clust (Chapter6): the cost function we designed allows us to jointly perform an edge selection and a gene clustering. In this formulation, we choose to promote the modular structure of the final network through the clustering. The resulting formulation relies on a discrete optimization problem for which an efficient alternating optimization procedure is proposed. An explicit solution can be computed for the edge selection sub-problem. After relaxing the gene clustering sub-problem, it can be solved via a random walker algorithm. Numerical performance of BRANE Clust was assessed on synthetic and real benchmark datasets. Significant improvements over state-of-the-art methods are also demonstrated. Biological relevance of both inferred GRN and gene clustering is also evaluated (Pirayre et al.,2018a) .
Although this thesis was focused on the development of generic GRN inference methods, a complete bioinformatic study — from experimental design choice to biological interpretation of the results — was performed on in-house transcriptomic data regarding the fungus Trichoderma reesei . In addition to confirming established knowledge and to providing new insights on the genetic mechanisms engaged during the cellulase production, this bioinformatic study was used as a real case study for BRANE Cut use and blind validation without reference. Some applied results from our endeavor are disseminated inPoggi-Parodi et al.(2014);Pirayre et al.(2018b).
In a ramification of this thesis (Chapter7), we extend our vision to more generic graph-based problems, not necessarily for GRN inference but keeping in mind forthcoming adaptations to biological purposes. We throw in HOGMep, a Bayesian approach developed for joint reconstruc-tion and clustering on multi-component data. A Higher Order Graphical Model (HOGM) is employed on latent label variables for clustering or classification. In addition, a Multivariate Exponential Power (MEP) prior is opted for the signal in a given class. An efficient Variational Bayesian Approximation (VBA) was developed to solve the associated problem. In this pre-liminary work, we firstly demonstrate the performance of HOGMep in an image deconvolution context, in terms of quality of reconstruction (pixel recovery) as well as quality of segmentation (pixel classification) from synthetic and benchmark color images. Initiatory venture into medical (and unstructured) data classification has also been undertaken, with dissemination in Pirayre et al. (2017).
1.3
Publications, communications and codes
1.3.1 International journal papers
⋆ D. Poggi-Parodi, F. Bidard, A. Pirayre, T. Portnoy. C. Blugeon, B. Seiboth, C. P. Ku-bicek, S. Le Crom and A. Margeot
Kinetic transcriptome reveals an essentially intact induction system in a cel-lulase hyper-producer Trichoderma reesei strain
Biotechnology for Biofuels, December 2014, 7:173.
⋆ A. Pirayre, C. Couprie, F. Bidard, L. Duval and J.-C. Pesquet
1.3. Publications, communications and codes 5 cuts for Gene Regulatory Network Inference
BMC Bioinformatics, December 2015, 16:369. ⋆ A. Pirayre, C. Couprie, L. Duval and J.-C. Pesquet
BRANE Clust: Cluster-Assisted Gene Regulatory Network Inference Refine-ment
IEEE/ACM Transactions on Computational Biology and Bioinformatics, May 2018, 15:3.
1.3.2 International conference papers
⋆ A. Pirayre, C. Couprie, L. Duval and J.-C. Pesquet
Discrete vs Continuous Optimization for Gene Regulatory Network Inference In Proceedings of the International Biomedical and Astronomical Signal Processing (BASP) Frontiers Workshop, pp. 23, Villars-sur-Ollon, Switzerland, 25-30 January, 2015.
⋆ A. Pirayre, C. Couprie, L. Duval and J.-C. Pesquet
Fast Convex Optimization for Connectivity Enforcement for Gene Regulatory Network Inference
In Proceedings of the 40th IEEE International Conference on Acoustics, Speech and Signal Processing (ICASSP 2015), pages 1002–1006, Brisbane, Australia, 19-24 April, 2015. ⋆ A. Pirayre, C. Couprie, L. Duval and J.-C. Pesquet
Graph Inference Enhancement with Clustering: Application to Gene Regula-tory Network Reconstruction
In Proceedings of the 23rd European Signal Processing Conference (EUSIPCO 2015), pages 2406–2410 , Nice, France, 31 August - 4 September, 2015.
⋆ L. Duval, A. Pirayre, X. Ning and I. W. Selesnick
Suppression de ligne de base et d´ebruitage de chromatogrammes par p´enalisation asym´etrique de positivit´e et d´eriv´ees parcimonieuses
In Actes du 25th colloque GRETSI, Lyon, France, 8-11 September, 2015. ⋆ A. Pirayre, D. Ivanoff, E. Jourdier, A. Margeot, L. Duval and F. Bidard
Growing Trichoderma reesei on a mix of carbon sources reveals links between development and cellulase production
In 29th Fungal Genetics Conference, Pacific Grove, CA, USA, 14-19 March, 2017. ⋆ A. Pirayre, Y. Zheng, J.-C. Pesquet and L. Duval
HOGMep: Variational Bayes and Higher-Order Graphical Models Applied to Joint image Segmentation and Reconstruction
Accepted (May 2017) to International Conference on Image Processing (ICIP 2017), Bei-jing, China, 17-20 September, 2017.
1.3.3 Other oral communications
⋆ A. Pirayre, C. Couprie, L. Duval and J.-C. Pesquet
inference
GdR MaDICS – One-day Workshop on Emerging Trends in Clustering, Orl´eans, France, 12 June 2015.
⋆ A. Pirayre, C. Couprie, F. Bidard, L. Duval and J.-C. Pesquet
Incorporating Structural A Priori in Gene Regulatory Network Inference us-ing Graph Cuts
International Workshop on Algorithmics, Bioinformatics and Statistics for NGS data anal-ysis (ABS4NGS), Paris, France, 22-23 June 2015.
⋆ A. Pirayre, C. Couprie, F. Bidard, L. Duval and J.-C. Pesquet
BRANE Cut: integrating biological a priori in Gene Regulatory Network in-ference with Graph cuts
Statomique, Paris, France, 9 November 2015.
⋆ A. Pirayre, D. Ivanoff, E. Jourdier, A. Margeot, L. Duval, and F. Bidard
Growing Trichoderma reesei on a mix of carbon sources reveals links between development and cellulase production
1st Trichoderma Workshop, Satellite Meeting of the 13th European Conference on Fungal Genetics, Paris, France, 3 April 2016.
⋆ A. Pirayre, C. Couprie, L. Duval and J.-C. Pesquet
Gene Regulatory Network inference refinement using clustering
GdR ISIS – Apprentissage et/ou traitement du signal et des images sur graphes, Paris, France, 17 June 2016.
1.3.4 Upcoming communications, submitted and in progress
⋆ A. Pirayre, C. Couprie, F. Bidard, L. Duval and J.-C. Pesquet
BRANE Cut : optimisation de graphes avec a priori pour la s´election de g`enes dans des r´eseaux de r´egulation g´en´etique
Submitted (April 2017) to colloque GRETSI, Juan-les-Pins, France, 5-8 September, 2017. ⋆ A. Pirayre, D. Ivanoff, L. Duval, C. Blugeon, C. Firmo, S. Perrin, E. Jourdier, A. Margeot
and F. Bidard
Growing Trichoderma reseei on a mix of carbon sources suggests links between development and cellulase production
Submitted (May 2017) to BMC Genomics. ⋆ Y. Zheng, A. Pirayre, L. Duval and J.-C. Pesquet
Joint image and graph recovery and segmentation with variational Bayes and higher-order graphical models (HOGMep)
Submitted (May 2017) to IEEE Transactions on Computational Imaging.
1.3.5 Available software
1.4. Outlines 7 ⋆ BRANE Clust: http://www-syscom.univ-mlv.fr/~pirayre/Codes-GRN-BRANE-clust.html
1.3.6 Miscellaneous
⋆ Best Poster Presentation Runner-Up Award
At European Student Council Symposium (ESCS’2014), Strasbourg, France, 6 September 2014.
⋆ Selection for the final contest 3MT (3 Minutes Thesis), top 10 among 24
At 23th European Signal Processing Conference (EUSIPCO 2015), Nice, France, 4 Septem-ber 2015.
⋆ Selection for the 3 minutes thesis presentationhttps://www.youtube.com/watch?v=ZUQj9YMPdVU
At Yves Chauvin thesis award ceremony, IFP Energies nouvelles, Rueil-Malmaison, France, 25 November 2015.
1.4
Outlines
This thesis is divided into 8 chapters. Following this introduction, Chapter 2 is devoted to an introductory part to bioinformatics with some recalls concerning biological notions and ex-perimental processes for data acquisition. While not the main scope of this thesis, classical preliminary bioinformatic treatments are presented as they are ineluctable and provide some food for thought in perspectives. Chapter 3 is dedicated to a review of GRN inference meth-ods and the strategy used to evaluate the developed ones, without omitting the presentation of mathematical tools used in this thesis. Chapters 4 to 6 are devoted to our software suite in-cluding BRANE Cut, BRANE Relax and BRANE Clust. In each chapter, chosen a priori , variational formulation and optimization strategy are detailed in addition to the assessment on benchmark datasets. In Chapter7, inverse problems and Bayesian framework are introduced in a preamble of the description and evaluation of HOGMep in both an image processing and biological context. Finally, conclusions and perspectives are draw in Chapter 8.
| 2 |
Methodology
“L’esprit scientifique nous interdit d’avoir une opinion sur des questions que nous ne comprenons pas, sur des questions que nous ne savons pas formuler clairement. Avant tout, il faut savoir poser des probl`emes.”
Gaston Bachelard
This chapter is dedicated to the description of the workflow for dealing with transcriptomic data to infer gene regulatory networks and to discover the main actors responsible for protein pro-duction. We firstly recall some biological notions, necessary to understand the gene regulatory network inference problem. We then expose experimental principles to generate transcriptomic data from DNA microarray or RNA-seq experiments. Normalization and gene selection tasks are detailed before the introduction of gene regulatory network (GRN) concepts. Aspects of GRNs post-processing for network inference enhancement and analysis are also mentioned.
Contents
2.1 Biological prerequisites . . . 10 2.2 Data acquisition and collections . . . 11 2.2.1 DNA microarray principles and data. . . 12 2.2.2 RNA-seq principles and data . . . 15 2.2.3 Benchmark data: simulated and real compendium . . . 17 2.3 Gene expression pre-processing . . . 19 2.3.1 Biases and normalization. . . 19 2.3.2 Differential expression and gene selection . . . 28 2.4 Gene Regulatory Network (GRN) inference . . . 32
2.1
Biological prerequisites
A cell phenotype corresponds to an observable characteristic which is driven by the production of some specific proteins, itself driven by the expression of related genes. While some genes are expressed in a constitutive manner, some others depend on external and internal stimuli. This adaptation suggests the presence of gene expression regulatory mechanisms. Before com-prehending protein production mechanisms related to a specific phenotype, it is necessary to understand protein origin in cells.
In molecular biology, the central dogma, as well a recurrent controversy (Crick,1970;Schreiber,
2005; Stearns, 2010), can be formulated as: one gene, one protein. In the genome, a gene is defined — sensu stricto — as a DNA fragment carrying the instructions for making a protein. This meaningful information is encoded via a specific order of the nucleic bases A, T, C, G: it is the coding sequence which will be transcribed. In addition, a gene is also composed of a promoter containing an initiation sequence as well as regulatory sequences (enhancers and silencers). The promoter is located upstream to the coding sequence. Finally, at the end of the coding sequence, a terminator is found.
When gene expression is promoted, the coding sequence is transcribed into a messenger RNA (mRNA) by an enzyme named RNA polymerase. Except for the nucleic base T, which is replaced by the nucleic base U, the mRNA conserves the same sequence of nucleic bases as the corresponding gene. The mRNA, after a maturation step, is translated into a polymer of amino acids thanks to ribosomes. The synthesized polymer corresponds to the protein and its amino acid sequence is dictated by the sequence of nucleic bases of the mRNA. Figure 2.1 illustrates the protein synthesis process.
DNA Gene X Promoter Promoter Gene X RNA polymerase transcription mRNA Ribosome translation Protein X
Figure 2.1 ∼ Protein synthesis mechanism ∼
Hence, a protein is present in a cell, as well as the corresponding mRNA, if its gene is activated. It is thus obvious that a dependence or association exists between protein production and gene expression regulation. We now explain some bases for gene expression regulation. The main regulatory mechanism involves the action of specific proteins called transcription factors (TFs). They can act alone or in association with other proteins in a complex. They recognize specific sequences (enhancers or silencers) located in the promoter of the genes that they regulate. TFs are responsible for two types of antagonist actions and can be:
2.2. Data acquisition and collections 11 ⋆ activators: they increase the gene expression level. Activators are attached to enhancer
sequences and promote the recruitment of the RNA polymerase.
⋆ repressors: they decrease the gene expression level. Repressors are attached to silencer sequences and block the recruitment of the RNA polymerase.
A same transcription factor may behave as an activator for one gene and as a repressor for an other gene. In addition, two mains complemental regulation strategies exist to control gene expression: epigenetic regulations, which are not directly related to a DNA sequence and post-transcriptional regulations which activate or inactivate a translated protein. These com-plex gene expression regulatory systems, which are all interdependent, make the discovery of gene regulatory pathways difficult. The integration of all these regulatory systems is discussed in Section8.2, for further perspectives. Even if the regulation by TFs is only a part of the gene regulation, its knowledge is crucial to understand how proteins are produced.
When we are interested by the production of proteins (cellulases, for instance), discovering the regulation of corresponding genes is crucial. At the first scale, it is necessary to identify their direct TFs. The behavior (activator or repressor) of the identified TFs is also an essential information to be discovered. But, TFs acting in cascade, the identification of actors regulating these direct TFs is also needed, etc. This scheme results in a pathway and at the scale of several proteins, all the pathways generate a network called Gene Regulatory Network (GRN). In this present work on GRN inference, only TFs (repressors and/or activators) are specifically taken into account. Even for scarcely known organisms and strains, as it is the case for Trichoderma reesei , partial TF information is often available.
Unfortunately, gene regulatory mechanisms, with the actual technologies, cannot be directly observed. Biological experiments, in silico models and knowledge databases complemented by mathematical tools are thus necessary to discover and establish gene regulatory pathways. We now explain what transcriptomic data are and how to generate them (Section 2.2) before to briefly describe bioinformatic processes and workflows handling them (Sections 2.3 and 2.4) toward the GRN and pathways discovery finality.
2.2
Data acquisition and collections
The transcriptome refers to the set of all mRNA expressed in one or a population of cells, in a given experimental condition. Transcriptomic studies require as prerequisites to know where genes are located in the genome. In addition to qualitative information — what genes are expressed? — a transcriptomic study provides quantitative information — in which levels? In transcriptomic, the main postulate suggests that the amount of mRNA reflects the gene activation level and thus the amount of proteins in the studied condition. Hence, producing a set of transcriptomic studies in different experimental conditions allows us to obtain information on condition-dependent gene expression. Due to methodological limitations in transcriptomic data acquisition, comparisons between genes for a given condition cannot be performed. However, expressions over various conditions, for a given gene, may be compared. For instance, it is
possible to detect that gene X is more expressed in condition 1 than in condition 2. This is what we call a differential expression analysis. From transcriptomic data and differential expressions, it may thus be possible to infer gene-gene relationships reflecting regulatory mechanisms. Two main approaches produce transcriptomic data: DNA microarrays and, more recently with the advance of high-throughput sequencing, RNA-seq experiments.
2.2.1 DNA microarray principles and data
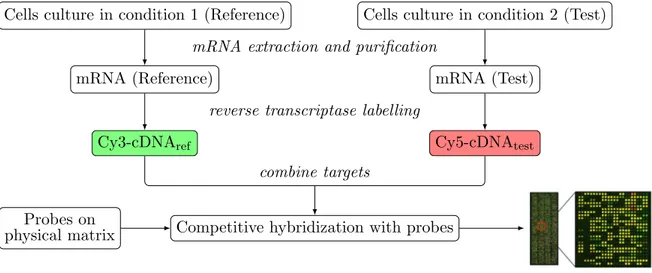
Several DNA microarray designs exist depending on the underlying biological question. In this work, we focus on the two-channel microarray of the Agilent platform used to produce in-house data on Trichoderma reesei . The SurePrint Technology➤ developed by Agilent is the most optimized technique. The popular Affymetrix platform relies on a similar principle. Agilent microarrays are conceived for differential analysis in gene expression. Assuming that we have the expression level for all genes in a reference condition, a two-channel microarray indicates the level of under- or overexpression for the same set of genes in a different condition. Its principle is detailed in Figure2.2.
Cells culture in condition 1 (Reference) Cells culture in condition 2 (Test)
mRNA (Reference) mRNA (Test)
Cy3-cDNAref Cy5-cDNAtest
Competitive hybridization with probes Probes on
physical matrix
combine targets
mRNA extraction and purification
reverse transcriptase labelling
Figure 2.2 ∼Diagram of the principle of two-channel microarray technology ∼
∼ Microarray preparation ∼
A microarray (or chip) is a physical matrix on which small DNA fragments, called probes (or oligonucleotides), from a given organism are immobilized in a random manner, see Figure 2.3(a). Each probe is referenced by its position on the chip (spot) and its nucleic sequence. Each spot contains many copies of the same probe, to facilitate the final detection by fluorescence approach. Probes may come from whole genome (genomic probes) or specific regions i.e. genes (transcriptomic probes). The latter is frequently used for transcriptomic studies as probes matching with genes only are interesting.2.2. Data acquisition and collections 13
∼ Targets preparation ∼
Two cell cultures are necessary: a reference culture (time 0 h of a kinetic, for instance) and a test culture (24 h after the kinetic start, for instance). For each cell culture, mRNAs are extracted and purified. mRNAs have to be reverse transcribed to complementary DNA (cDNA) to make the hybridization with the probes possible. In the same time as cDNAs are synthesized, they are labeled by culture-dependent fluorochromes. The flu-orochromes used are the cyanine molecules Cy3 and Cy5. Traditionally, the fluorochrome Cy3 is used for the reference culture and the Cy5 for the test culture. Separate solutions of Cy3-cDNAref and Cy5-cDNAtest are then mixed yielding a unique solution of target fragments.Microarray technology is based on the hybridization of two complementary single-stranded DNA fragments: probes and targets. Indeed, two complementary fragments naturally hybridize to constitute double-stranded DNA. The complementarity is base-dependent: A↔T and C↔G.
Now, back into the microarray context. On the one hand, a chip with fixed single-stranded DNA probes is available. On the other hand, a solution of single-stranded DNA targets corresponding to a mixed Cy3-cDNAref and Cy5-cDNAtest is also available. This solution is dropped off on
the microarray containing probes and placed in a hybridization oven for one night. During this time, the microarray is spun in optimal conditions (pH, temperature, etc.) to favor hybridization between DNA probes and labeled cDNA targets, see Figure 2.3(b).
∼ Hybridization ∼
The hybridization is termed competitive, as a probe is complementary to both Cy3-cDNAref and Cy5-cDNAtest. For each probe matching a gene, the proportion ofhybridized Cy3-cDNAref and Cy5-cDNAtest reflects the amount of mRNAs and consequently
the gene expression level in the reference and test culture condition, respectively. In other word, if the probe corresponding to a gene is more hybridized with Cy5-cDNAtest than with
Cy3-cDNAref, this implies that the gene is more expressed in the test than in the reference
culture condition. In such a case, we say that the gene is overexpressed in the test condition. By analogy, we will say that a gene is underexpressed in the test condition if the hybridization level for Cy5-cDNAtest is lower than for Cy3-cDNAref. Using this competitive hybridization, it
is thus possible to detect differential gene expression between two conditions.
∼ Detection ∼
The proportions of hybridized targets are recovered using fluorescence of Cy3 and Cy5 fluorochromes, each of them depending on a target type (reference or test). After an overnight hybridization, all non-hybridized or badly-hybridized (non-specific) targets are firstly washed to avoid undesired fluorescence, see Figure 2.3(c). Then, the microarray is scanned and each spot is excited with a laser at respective wavelengths of 550 nm for Cy3 and 650 nm for Cy5. The emitted fluorescence (green for Cy3 and red for Cy5) is then collected via a photomultiplier (PMT) coupled to a confocal microscope. Two gray-scale images are obtained, one for each wavelength. The gray level reflects the emitted fluorescence intensity. Shades of gray are then converted to shades of green and red for the reference and the test image, respectively. Superposing the two colored images yields a unique false-colored image composed of spots from green to red, through yellow. This visualization allows us to observe differential gene expression.overex-T C G A T ∣ A G G T C ∣ T A C G T ∣ (a) Probe immobilization. T≡ C= G= A≡ T≡ ∣ A≡ G= G T≡ C= ∣ T≡ A≡ C= G= T≡ ∣
∗
≀ A G C T A∗
≀ T C A A G⋆
≀ A T G C A (b) Target hybridization. T≡ C= G= A≡ T≡ ∣ A G G T C ∣ T≡ A≡ C= G= T≡ ∣∗
≀ A G C T A⋆
≀ A T G C A (c) Target washing. T≡ C= G= A≡ T≡ ∣ A G G T C ∣ T≡ A≡ C= G= T≡ ∣∗
≀ A G C T A⋆
≀ A T G C A (d) Fluorescence detection. Figure 2.3 ∼ Principle of the hybridization in a microarray ∼(a) DNA probes (base sequences in black) are immobilized on the microarray. (b) Reference and test targets (base sequences in gray) labeled by fluorochromes Cy3 (∗) and Cy5 (⋆), respec-tively, are added for hybridization. (c) Non- and badly-hybridized fragments are washed. (d) Fluorescence detection is then performed by laser excitation.
pressed in the reference culture condition.
⋆ Red-trend spot: Cy5-cDNAtest was mostly hybridized. Corresponding genes are
overex-pressed in the test culture condition.
⋆ Yellow-trend spot: Cy3-cDNAref and Cy5-cDNAtest were hybridized in a relative equal
quantity.
Image processing is then used, including quality assessment and corrections, to quantify color intensities and thus differential gene expressions. For each spot (corresponding to a specific gene), green intensity and red intensity are obtained. The change of expression for a gene is then obtained by computed the red on green intensity ratio. As a side note, mathematical mor-phology has been a frequent tool for microarray data segmentation and quantification (Siddiqui et al.,2002;Angulo and Serra,2003). We refer toKohane et al.(2003);Dougherty et al.(2005);
Scherer (2009) for additional details on microarray signal and image processing.
This presented protocol is used to compare gene expression of only one test condition against a reference one. In a transcriptomic study, various test conditions are experimented, preferen-tially against the same reference condition. To limit fluorochrome-dependent biases, dye-swap experiments are usually performed. For a given reference vs test gene expression comparison, DNA of the reference culture is classically labeled with Cy3 fluorochromes while the DNA of the test culture is labeled with Cy5 fluorochromes. Dye-swap experiments consists in, at the same time, proceeding to the same reference vs test comparison while reversing the fluorochromes (reference DNA are labeled by Cy5 and test DNA by Cy3). In such a case, genetic materials are identical and experiments are called technical replicates.
In order to compare and deal with microarray data, normalizations are needed. Existing experimental biases corrections are presented in Section 2.3.1. Expression changes against the
2.2. Data acquisition and collections 15 reference and across the experimental conditions help us to detect regulatory relationships be-tween genes as exposed in Section2.4.
However, with the advance of high-throughput sequencing — and, in particular the Next Generation Sequencing (NGS) technology — a recent approach named RNA-seq, surpasses DNA microarrays for transcriptomic studies. We now detail the principles of RNA-seq data acquisition and highlight the main differences with DNA microarray data.
2.2.2 RNA-seq principles and data
Next Generation Sequencing (NGS) is a relatively recent technology designed for whole genome sequencing i.e. to determine the linear order of nucleic bases A, T, C, G. But sequencing can also be used to quantify mRNA present in cells. It is called RNA-seq. Several RNA-seq technologies exist. We only expose the Illumina➤ Sequencing technology used to generate IFPEN data on Trichoderma reesei .
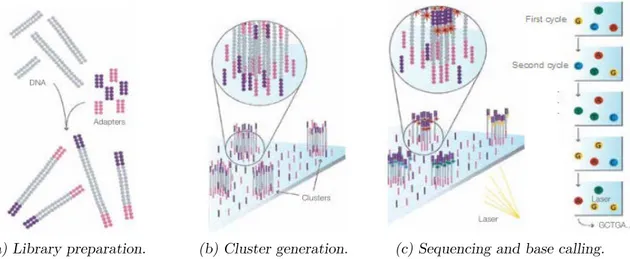
∼ Library preparation ∼
As we aim at quantifying gene expression levels, total RNA are firstly extracted from a cell culture of interest and mRNAs only are purified. They are then reverse transcribed into cDNAs. For practical reasons, cDNAs are fragmented to obtain smaller fragments of the same length (the size of the fragment conditions the technology to use) and an adapter is fixed at both cDNA extremities, see Figure 2.4(a). Here, we assume that the gene activity is reflected in the amount of mRNA, which is proportional to the amount of cDNA fragments.∼ Cluster generation ∼
The cDNA-adapter complexes are then dropped off on a physical support called flow-cell. It contains complementary adapters to those ligated to the cDNAs, allowing the covalent fixation of the cDNAs to the flow-cell. Complexes are then amplified by Polymerization Chain Reaction (PCR). Each channel on the flow-cell is called a cluster and contains multiple copies of the same cDNA, see Figure 2.4(b). Hence, if a gene is highly expressed, a high number of clusters will contain cDNA fragments matching the corresponding gene.∼ Sequencing and base calling ∼
Sequencing can now start. It is based on the natural DNA replication mechanism. An enzyme, called DNA polymerase, fixes the single-strand DNA and recognizes nucleic bases. At each base, the enzyme recruits the complementary base to syn-thesize the novel and complementary strand. In RNA-seq experiments, a DNA polymerase is used with fluorescent nucleotides, each type of nucleotide being associated to a fluorochrome. Sequencing is decoupled in cycles, where at each cycle, only one nucleotide is detected and identified. Hence, at the first sequencing cycle, DNA polymerase and labeled nucleotides are dropped off the flow-cell. In each cluster, the DNA polymerase uses the fluorescent nucleotide complementary to the first nucleotide of the cDNA. The flow-cell is scanned and a laser is used at the appropriate wavelengths to excite the four fluorochromes. In each cluster, thanks to the specificity between fluorescence color and nucleotide, the first base is detected and identified.Sequencing and detection cycles are repeated until the end of the cDNA, see Figure 2.4(c). Im-age processing is needed for the base detection and identification step. Indeed, at each cycle, fluorochromes are excited using the appropriate wavelength and an image is taken. In this im-age, spots are present and correspond to the fluorescence in the cluster. Using image processing techniques, the fluorochrome giving the maximal fluorescence is identified in each cluster, and thus the incorporated nucleic base is identified. This process is called base calling. As we know where the cluster is located in the flow-cell, we can recover the sequence of the corresponding cDNA fragment. Such a sequence is called a sequence read or, simply, a read. Once all reads are obtained, additional processing is needed to quantify gene expression: quality assessment, read alignment, read counting, read count normalization.
(a) Library preparation. (b) Cluster generation. (c) Sequencing and base calling. Figure 2.4 ∼ Illustration of main steps of RNA-seq experiments. ∼
Figure taken from Pub. No. 770-2007-002, Illumina documentation: http: // www. illumina. com/ documents/ products/ techspotlights/ techspotlight_ sequencing. pdf
Before the quantification of mRNAs to be able to conclude on the underlying gene expres-sion levels, quality assessment has to be performed. For a given read, each sequenced base is evaluated using a Phred quality score. It measures the quality of the identification of the nu-cleobases generated by automated DNA sequencing. This score is logarithmically related to the probability of misidentification of a base. If reads are judged of good quality, aligning them to a reference genome is the next step, if an already-sequenced reference genome is available. We recall that a read is the sequence of a cDNA fragment corresponding to a part of an mRNA. The aligning step consists in mapping all sequenced cDNA fragments on the genome. Based on alignment results, the read count for the gene i, is obtained by identifying the number of sequenced cDNA fragments mapping the gene i. The read count reflects the absolute level of gene expression. This protocol is used to obtain each gene expression level for a given condition. As for DNA microarrays, various conditions are tested. This requires normalization steps on read count data to compare experiments between them, see Section2.3.1. Gene expression levels
2.2. Data acquisition and collections 17 obtained from read counts across various experimental conditions allow us to detect potential regulatory relationships between genes.
Why is RNA-seq preferred to microarray for transcriptomic studies? Several technical aspects are in favor of RNA-seq experiments. Firstly, microarrays are limited to known organisms as they require species- or transcript-specific probes, which is not the case in RNA-seq. In addition, supplemental detections can be made in RNA-seq such that novel transcripts, Single Nucleotide Polymorphisme (SNP)s, indels (small insertions or deletions) or isoforms. Secondly, unlike mi-croarray, single or rare transcripts and weakly expressed genes can be detected in RNA-seq. This may be done by increasing the sequencing coverage depth1. Finally, not observable in
RNA-seq, microarrays suffer from constrained dynamic range as gene expression measurements are limited by background and signal saturation. A key goal in transcriptomic studies is to detect condition-dependent changes in gene expression levels (detailed in Section 2.3.2). In the two-channel microarray technology, comparisons between conditions are defined in advance, through the experimental design, leading to relative gene expressions. On the contrary, RNA-seq tech-nologies, providing absolute gene expressions, are thus more flexible and give additional degrees of freedom for the differential analysis.
DNA microarray and RNA-seq are both experimental techniques providing us the activity level of all genes. These data form the basis for the construction of gene regulatory networks. However, when dealing with quasi unknown organisms or a poor share of reliable information, we should first assess the trust one can place in network inference methods. Hence, before introducing the basics of GRN inference in Section 2.4, we evoke benchmark data to which a ground truth is associated.
2.2.3 Benchmark data: simulated and real compendium
When the aim is to develop new methods for inferring gene regulatory networks, a direct use of real data for which no or poor validation is available is not the best strategy. In this case, neither an objective validation nor a rigorous comparison with other GRN inference methods is possible. The lack of benchmark datasets with gold standards was resolved with the Dialogue on Reverse Engineering Assessment and Methods (DREAM) project. From a global viewpoint, the DREAM project assembles a community of researchers to promote open science in the field of biology and medicine. Indeed, they make available open and transparent data for rigorous and reproducible science. They cover a large panel of biological issues (Alzheimer’s disease, prostate cancer, toxicogenetics, etc.) but also yet unsolved bioinformatics problems such as the estimation of model parameters, subclonal reconstruction algorithms or network inference among others. In the GRN inference context, the DREAM project propose three challenges DREAM3 (Prill et al.,
2010), DREAM4 (Marbach et al., 2010) and DREAM5 (Marbach et al., 2012). These specific challenges provide benchmark datasets as well as a standardized assessment methodology with ground truths to accurately compare GRN inference methods. Proposed performance metrics are discussed in Section3.2.2. DREAM3 and DREAM4 challenges contain the same simulated
1
data from in silico networks only while DREAM5 also present a compendium of real data in addition to simulated data. A detailed description of each dataset for the challenges DREAM4 and DREAM5 is provided in Section 3.2.1. Here, we focus on techniques to simulate gene expression data and give some words about real compendium datasets.
∼ Simulated benchmark datasets ∼
Simulated data are based on in silico networks, both generated by the tool GeneNetWeaver (GNW) (Schaffter et al.,2011). A module extraction is firstly performed, from true biological networks (i.e. source networks), to obtain network struc-tures. For this purpose, Marbach et al. (2009) propose to iteratively grow sub-networks from a given node until a fixed size such that the added nodes maximize a modularity index. This modularity Q is defined as the difference between the number of edges within the sub-network and the number of such edges in a randomized graph. Doing this, sub-networks resulting from the described module extraction are organized in a hierarchical modular structure, similarly to source networks. Once the structure is obtained, dynamic models are defined for gene regulation. Both transcription and translation processes are modeled through detailed kinetic models while molecular noise modeling is based on stochastic differential equations (Langevin equations). A supplemental experimental-like noise is added as a mixture of Gaussian and log-normal models seemingly observed in microarrays. These models are then used to generate gene expression data by simulating various biological experiments2: wild type, knockout, knockdown, dual knockdownor multifactorial. Each experiment can be simulated as steady-state or time-series.
From the generated in silico networks and gene expression data, GRN inference methods can be evaluated through objective performance metrics. Indeed, the in silico networks used to generate gene expression data are employed as ground truths for the assessment of predicted networks. Figure2.5 illustrates the pipeline of benchmarking and assessment of GRN inference methods using GNW.
Biological network
Network structures
in silico networks Gene expression data Predicted network module extraction dynamical model simulation network inference assessmen t
Figure 2.5 ∼ GeneNetWeaver pipeline ∼
Benchmarking and assessment of GRN inference methods. Green-labeled edges correspond to step specifically performed by GNW.
In addition to simulated gene expression data, the DREAM project also provide benchmark datasets coming from real experiments for which we briefly give some details.
2