HAL Id: hprints-00326288
https://hal-hprints.archives-ouvertes.fr/hprints-00326288
Submitted on 2 Oct 2008HAL is a multi-disciplinary open access L’archive ouverte pluridisciplinaire HAL, est
Journal self-citations - analysing the JIF mechanism
Tove Faber Frandsen
To cite this version:
Tove Faber Frandsen. Journal self-citations - analysing the JIF mechanism. Journal of Informetrics, Elsevier, 2007, 1 (1), pp.47-58. �hprints-00326288�
Journal self-citations
- analysing the JIF mechanism
Tove Faber Frandsen1
Department of Information Studies Royal School of Library and Information Science
Copenhagen S. Denmark
This paper investigates the mechanism of the Journal Impact Factor (JIF). Although created as a journal selection tool the indicator is probably the central quantitative indicator for measuring journal quality. The focus is journal self-citations as the treatment of these in analyses and evaluations is highly disputed. The role of self-citations (both self-citing rate and self-cited rate) is investigated on a larger scale in this analysis in order to achieve statistical reliable material that can further qualify that discussion. Some of the hypotheses concerning journal self-citations are supported by the results and some are not.
Introduction
The increased attention on JIF as a crucial criterion of evaluation has according to Kaltenborn & Kuhn (2004) led authors and editors more or less voluntarily to adapt their publication strategy to a maximation of JIF. Editors seek to understand the impact factor calculation so that they can manipulate it to their journal’s advantage (Jennings, 2001). Miller (2002), Neuberger & Counsell (2002) and Sevinc (2004) all reported that a manuscript submitted was returned by the editor requesting the
1 The author wishes to thank Ronald Rousseau for his tremendous help. The author also thanks
author to add irrelevant references from that journal. This implies that the risk of editors manipulating JIF by increasing the number of journal self-citations is present. The use and importance of journal self-citations is highly debated. The treatment of self-citations in analyses and evaluations has been discussed heavily and relates to how we should interpret citations. According to Hyland (2003) repeated self-citation accentuates one’s credibility or expertise and may perpetuate one’s interpretations or opinions of specific research findings or general constructs. According to Gami et al. (2004) critics of the impact factor (IF) as a metric of journal importance have noted the bias that results from journal self-citation but little is known about the impact of self-citations. However we can’t just ignore the existence of journal self-citations. According to Van Raan (1998b) self-citations cannot be neglected and it is necessary to perform corrections to avoid distortions. White (2001) also stressed that self-citations are not an insurmountable difficulty as they can be excluded from the analyses. But nevertheless self-citations are most often included in the calculation of JIF and could potentially have an effect on the results. Aksnes (2003) pointed out that on aggregated levels such as on national levels citations do not pose a problem assuming that they level out but at lower levels self-citations could potentially be a serious problem as there are great variances among e.g. disciplines.
Models for interpreting the self-citation rates have been suggested (Rousseau, 1999) and a few investigations exist that relate self-citations to JIF (Smart & Elton, 1982 and Fassoulaki et al, 2000). But the former only included the self-cited rate and the latter consisted of limited data material. The main objective of this analysis is to relate citations to JIF. The role of citations (both citing rate and self-cited rate) will be investigated on a larger scale in this analysis in order to achieve statistical reliable material that can further qualify the discussion.
The paper is structured as follows: The next section surveys the research already existing within this field. The following section then presents and discusses the collected data and the chosen methods, followed by a section with the results of the analysis. The last section contains conclusions and a discussion of the perspectives of the paper.
Overview of the existing literature
A large corpus of earlier research exists regarding self-citations and in order to keep some overview of the research we divide it into theoretically oriented and empirically oriented research. Please note that the focus here is on journal citations and not so much on other variations of citations such as author self-citations, country self-citations and institution self-citations (Eto, 2003). We begin with the theoretically oriented research noting that there are several interesting suggestions on how to evaluate and understand self-citations.
Self-citations have been translated into quantifiable measures in various forms. Rousseau (1999) defined a journal self-citation as a paper published in a journal citing papers published in the same journal. Self-citations and thus also journal self-citations have been classified by several. Lawani (1982) divided self-self-citations into two types called synchronous and diachronous self-citations. The synchronous rate is calculated as the citations to itself relative to the total number of references in the journal. The diachronous rate is calculated as the journal’s number of self-citations relative to the total number of citations received by the journal. According to Lawani (1982, p282) the former is not necessarily an expression of egoism whereas on the other hand the latter is an expression of egoism as we see little or no recognition from other journals. White (2001) questioned this use of the two indicators of self-citations stating that “[w]hile Lawani’s approach is intriguing, he reads egotism, usually a durable quality of personality, into data that are beyond authors’ control and whose proportions can change: a sudden influx of citations from others could turn today’s monster of vanity into a decent, humble fellow overnight. The charge
should perhaps be reserved for failings more clearly personal, such as citing one’s own work when it is irrelevant. I would even argue that abnormally high selfcitation in […] the synchronous rate […] would be a better measure of egotism; at least it would reflect behaviour attributable to the citer. A high diachronous self-citation rate, on the other hand, seems more an indicator of what might be called intellectual isolation (true egotists prefer undiscoveredness). In any case, if egotism is defined as excessive self-citation, the burden of proving excess is on the definer.” Egghe & Rousseau (1990) classified self-citations in two indicators: self-citing rate and self-cited rate. Self-citing rate relates a journal’s self-citations to the total number of references it gives. Self-cited rate relates a journal’s self-citations to the number of times it is cited by all journals, including itself. So basically the only thing differentiating the typologies by Lawani and Egghe & Rousseau is the terminology. Here we choose to use the terminology suggested by Egghe & Rousseau (1990) and the mathematical definition of self-citations based on Garfield (1974) is illustrated by table 1.
Table 1. Journal self-citation table
Cited journals
Citing journals J O
J a b O c -
Journal J cites itself a times; it cites other journals b times. Journal J is cited by other journals c times. The self-citing rate is a/(a+b); the self-cited rate is a/(a+c). Rousseau (1999) furthermore suggested that a high self-cited rate could be an expression of low visibility of the journal. Self-cited rates of leading journals would be expected to be low and the other way around for more peripheral journals. A high self-citing rate on the other hand is a sign of low visibility of the field covered by the
journal and journals with high self-citing rates would tend to be more specialised. He also stressed that one should note that self-citations typically contain a different kind of information than other citations as they often contain intra-journal information (Rousseau, 1999). According to Gami et al. (2004) self-citations serve necessary functions. It allows expanding on previous hypotheses, refer to established study designs and methods, and justify further investigations on the basis of prior results. Hence, he argues, self-citations may be inevitable when the published data are only published in a single journal.
Turning to the more empirically oriented research we note that little work exist that relate self-citations to JIF on a larger scale in order to test some of the models of interpretation suggested. Several empirical analyses focus on journal self-citations and some of these are: Pichappan (1995) indicated that the self-citing rate of a journal is affected not only by the length of existence of the journals, but also by the source articles of the journal cited and citing it. Snyder & Bonzi (1998) showed that motives to self-cite are the same as motives to cite others. Furthermore they showed that there are large differences in the number of self-citations among disciplines but the number is constant within disciplines. Van Raan (1998a) stressed the importance of the size of the data material. It is very unlikely that all authors have the same biases and therefore a large dataset will reduce the differences. Van Raan (1998b) and Moed (2000) showed that the impact of research results are affected by the degree of international cooperation but the increased impact are not exclusively due to self-citations because even after correcting for self-citations the impact is still greater. This finding was also supported by Aksnes (2003).
Rousseau (1999) investigated the amount of self-citations in 10 highly estimated journals and 10 randomly chosen journals. He finds that self-citations are given earlier after publication than non-self-citations. Fassoulaki et al (2000) investigated 6 journals for both self-citing rate and self-cited rate. Although not statistically significant they find a correlation between self-citing rate and JIF. Although
restricted by the limited period of analysis and only including a single journal Peritz & Bar-Ilan (2002) found a highly increasing tendency to journal self-citations. They point to an increased significance of the journal during the period as an explanation. Rousseau & Small (2005) showed an example of a cycle of citations within the same journal issue. These journal self-citations emerged on the basis of an invisible college exchanging preprints. Finally, Tsay (2006) investigated self-citations of the most productive semiconductor journals and found that high self-citing journals are usually older, more productive and higher cited than low self-citing journals.
Data
The analysis in the present paper is a case study based on a number of economics journals. It is necessary to collect a rather homogeneous data set in order to keep the number of variables at a reasonable level. Glänzel & Moed (2002, p178) stressed that JIF is field-specific biased and therefore one way of limiting the data set is to use journals from only one science. A group of economics journals was selected on the basis of criteria set up by Kalaitzidakis et al (2001) which ensured that the journals were scientific and belonged primarily to the social science of economics. Furthermore, the journals had to be indexed throughout the entire period in Social Science Citation Index (SSCI). A sample of 32 journals fulfilling these criteria was selected randomly and is shown in appendix 1.
Preliminary searches conducted before the start of the actual analysis showed that before the mid-1980s the number of observations in the data material is too small so the initial publication period used in the analysis is 1986 as it involves data from 1984-1985 when calculating the synchronous JIF. The last publication period is 2002 with corresponding citation period for the 3-year diachronic JIF of 2002-2004.
An overview of the variables is available in appendix 2 and a short description follows here: the number of citations is used as a dependent variable in four different versions. To extend the indications of the analyses to more than just one
JIF-calculation we calculated four different JIFs. The robustness of the results does not depend on the particular JIF chosen as we employed both synchronous and diachronous JIF. The formulas for calculating both the synchronous and the diachronous JIFs are available in Frandsen and Rousseau (2005). There are two formulations for the general case depending on whether we treat each publication year differently but as we only operate with one publication year we can use either of the formulations. We employed two 2-year synchronous JIFs which means a 2-year publication period and a 1-year citation period is used. This means that the analysis will include the citations over one year to publications from two years, e.g. citations in 1986 to articles published in 1984-85. One was calculated as done by the ISI and one also including the document type letter in the denominator as recommended by Christensen, Ingwersen & Wormell (1997). Furthermore we used a 3-year diachronous JIF and a 5-year diachronous JIF. The length of the citation window must be set in accordance with the degree of obsolescence of articles within the economics literature since we want to include a large percentage of the total number of citations received. Only a few investigations of obsolescence within economics have been made. One of the few is Dorban & Vandevenne (1991) and according to their investigation we only captured 24 per cent of the citations using a citation window of 4 years but in order to perform analyses on relatively recent data we had to compromise and therefore we chose the 5-year citation period as the longest.
The time variable captures a possible development over time. By adding this variable it is possible to capture if JIF in general increases or decreases over time which could be the case if the number of included journals in the citation databases increases or decreases during the period leading to more or less possible journals to cite.
The number of self-citations is described by two related but different measures. The self-citing rate relates a journal’s self-citations to the total number of references it gives. Self-cited rate relates a journal’s self-citations to the number of times it is cited by all journals, including itself. In this analysis we calculate them both. The
self-cited rate is calculated after using the correction technique suggested by Christensen, Ingwersen & Wormell (1997). As we will explain later in the results section there are reasons to believe that the relation between JIF and self-cited rate is not linear per se therefore we also construct a variable describing the relationship as non-linear. That is done by computing a variable as 1 divided by the self-cited rate.
As we wish to control for other factors that might influence the results we add several variables that describe other aspects of the journals included in the analysis. The variables included here are chosen as they are expected to affect the distribution of JIF across journals. Others could have been chosen and that could potentially alter the outcome of the analyses. Future analyses will have to investigate if other factors influence the JIF and we focus on variables describing document types and geographic relations. We record the composition of document types each year. The documents are divided into 7 categories namely: Article, review, letter, note, editorial, book review and other. The categories consist of just the document type indicated in the category label. Only exception is the category other that consists of discussion, item about an individual and that sort of publications. These document types have been aggregated in this category as the dataset revealed so few of them and the use of them varies considerably over the years. Furthermore we register the total number of publications of each journal, the share of documents with scientific content (article, review, letter and note) and the number of documents included by the ISI (article, review and note).
A variable describes the geographical location of the journal and is constructed by determining the place of publication. We are primarily interested in the few journals not originating from North America in order to describe the geographical periphery of science. This geographic location of a journal is determined by using Ulrich´s international periodicals directory. When using Ulrich’s for determining the geographic location it can be problematic for journals published by e.g. Elsevier who
are registered in Ulrich’s as being published in The Netherlands while the reality may be different. But for this analysis we have to rely on the directory as it can be almost impossible to establish a certain geographic location. Should all journals without certain geographic location have been discarded from the analysis it would have left us with very limited material as can be seen in Frandsen (2005). The second variable concerning geographical relations is constructed in order to record the languages of the journals and is computed as the share of documents not written in English. We could also have added a variable on the geographic location of the authors publishing in the journal but as the main focus point here is not geographic relations we restrict the variables on geographic relations to the two mentioned here.
Different estimation equations were used in order to analyse the data material. A minor analysis took place before the central main analysis. But both of these analyses consisted of variables already available through the main analysis. Furthermore we analysed the degree of self-citing rates in order to see if the degree of self-citing could be explained by some of the other variables describing the journals. We analysed self-citing rate as the dependent variable and the estimation equation we used is as follows:
Self-citing ratei,t =
β0 +
β1 (total number of documentsi,t) +
β2 (documents included in the ISI-JIFi,t) +
β3 (geographic location of journali,t) +
β4 (trendt) +
β5 (scientific content share of totali,t) +
β6 (share of non-English languagei,t) +
β7 (articlei,t) +
β8 (reviewi,t) +
β10 (notei,t) +
β11 (editoriali,t) +
β12 (bookl reviewi,t) +
β13 (otheri,t) +
ui,t
i denotes the journal whereas t denotes the time period. β0 denotes the constant
ui,t denotes the error term.
Finally we analysed the data set using various forms of JIFs as the dependent variable. We wanted to be able to understand and explain the actual JIF-value of each journal. The estimation equation we used is as follows:
JIFi,t =
β0 +
β1 (self-cited ratei,t) +
β2 (self-citing ratei,t) +
β3 (geographic location of journali,t) +
β4 (documents included in the ISI-JIFi,t) +
β5 (total number of documentsi,t) +
β6 (share of non-English languagei,t) +
β7 (articlei,t) +
β8 (reviewi,t) +
β9 (letteri,t) +
β10 (notei,t) +
β11 (editoriali,t) +
β12 (book reviewi,t) +
β14 (trendt) +
β15 (scientific content share of totali,t) +
ui,t
i denotes the journal whereas t denotes the time period. β0 denotes the constant
ui,t denotes the error term.
We have to bear in mind that we cannot compare the coefficients from one JIF regression to another as they cannot be compared across different analyses. But it gives us an opportunity to see which variables explain the JIF statistically significant and to see if the picture depicted is the same for all JIF types analysed.
For these analyses the three Dialog Classic implementations of Arts & Humanities Citation Index (A&HCI), Science Citation Index (SCI) and Social Sciences Citation Index (SSCI) have been used. All three citation databases have been used, as citations received from journals outside the home discipline are just as relevant for this study as those from within the home discipline. In the analysis we only included citations from journals covered by ISI.
The analyses below consists of different statistical analyses of the data material. Multivariate linear regression analysis of the statistical relations between the dependent and the independent variables gives information on statistically significant relations having controlled for otherwise hidden relations with other variables. Furthermore, we are given the slope coefficients and a p-value for the linear relationship. Pearson’s r2 reveals information about the degree of correlation
between the dependent and the independent variables when controlling for the effects of the other variables. The analyses have been made in Microsoft Excel and SPSS.
Results
Before scrutinising the linear regression analyses and interpreting the coefficients it must be emphasised that when we interpret the coefficients we say: Increasing a given independent variable by e.g. 0.3 is interpreted as leading to an increase in the dependent variable by 0.3 all other things equal. However, that is not to be understood deterministic. It is only statistical tendencies in the data set and not predictors for the future.
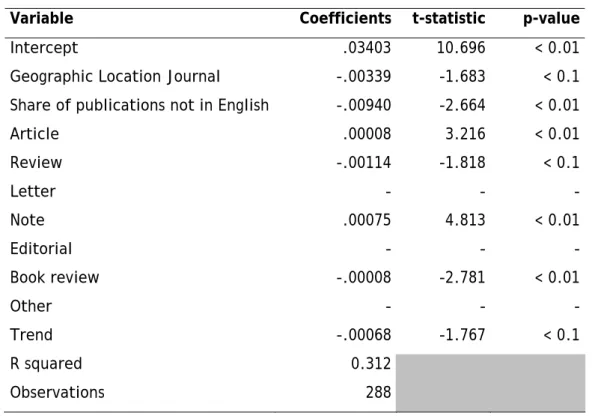
Table 3 is a transcript of the output of the linear regression. First of all we notice that the R-square is not very large which means that this model is not an especially good fit. The R-square is .312 which means that we can explain 31 per cent of the variation in the dataset. That is not impressive but the regression can still provide insight into the self-citing rates. Please note that non-significant variables are not included in the table.
Table 3. Multivariate linear regression analysis. Dependent variable is self-citing rate.
Variable Coefficients t-statistic p-value
Intercept .03403 10.696 < 0.01
Geographic Location Journal -.00339 -1.683 < 0.1 Share of publications not in English -.00940 -2.664 < 0.01
Article .00008 3.216 < 0.01 Review -.00114 -1.818 < 0.1 Letter - - - Note .00075 4.813 < 0.01 Editorial - - - Book review -.00008 -2.781 < 0.01 Other - - - Trend -.00068 -1.767 < 0.1 R squared 0.312 Observations 288
First of all we can see that some document types influence the self-citing rate negatively and others positively. Journals containing many articles and notes will tend to get a higher self-citing rate. On the other hand journals consisting of many book reviews and reviews will tend to have a lower self-citing rate. This is an expected finding as these document types (and all document types in general) contain references primarily to other document types than those two types as shown by Moed & Van Leeuwen (1995).
Furthermore, we can see in the table that the geographic location of the journal influence the self-citing rates negatively. The coefficient of -.00339 is interpreted as journals from outside North America having a self-citing rate that is .00339 lower than other journals. The language variable also contributes. Journals not written in English have lower self-citing rates as they have a self-citing rate that is .00940 lower than journals written in English. These two variables affect the self-citing rate negatively and can perhaps be explained the same way as the importance of composition of document types. There might be a tendency to citing these peripheral areas less than main stream research which also can be detected in the self-citing rates. Journals containing many of these documents will – just as the rest of the scientific community – cite them less. But that is beyond the scope of these analyses to investigate.
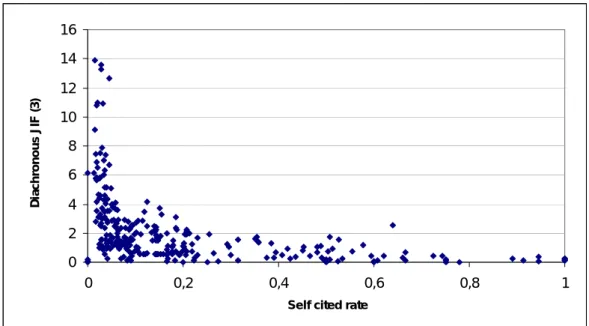
A few remarks need to be made concerning self-cited rates as the relationship between JIF and self-cited rate may not be described best as linear which is default when we employ a linear regression. Figure 1 is an illustration of the relationship between the 3-year diachronous JIF and self-cited rate. In that figure it is evident that the relationship cannot be viewed as linear.
0 2 4 6 8 10 12 14 16 0 0,2 0,4 0,6 0,8 1
Self cited rate
D ia c h ronous J IF ( 3 )
Figure 1. Self-cited rate and the 3-year diachronous JIF.
This is just an illustration of the relationship between the 3-year diachronous JIF and self-cited rate. To extend the point to all different types of JIFs we define four different linear regression models. All with self-cited rate as independent variable and JIF as dependent. A short summary is available in table 4.
Table 4. Multivariate linear regression analysis of JIF and independent variable is self-cited rate. JIF R square Coefficient of dependent variable P value of coefficient Synchronous JIF excl. letter 0.187 -1.994 < 0.01 Synchronous JIF incl. letter 0.188 -1.974 < 0.01
Diachronous 3-year JIF 0.196 -4.274 < 0.01
Diachronous 5-year JIF 0.210 -10.774 < 0.01
As we can see the relationship is statistically significant for all four JIFs and in all four cases the coefficient is negative. Furthermore it is clear that the r-square of all
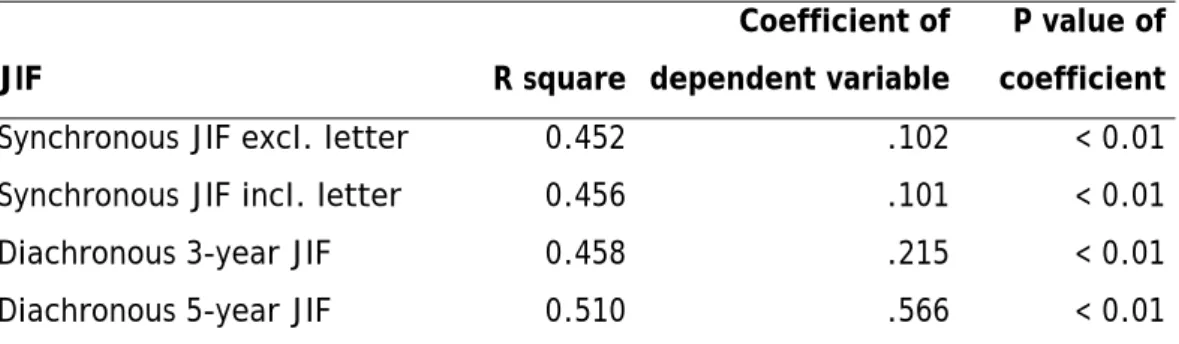
types of JIF is not very high. Therefore we try to describe the relationship non-linearly by employing the transformed self-cited rate. The results of the new regressions can be seen in table 5.
Table 5. Multivariate linear regression analysis of JIF and independent variable is transformed self-cited rate.
JIF R square
Coefficient of dependent variable
P value of coefficient
Synchronous JIF excl. letter 0.452 .102 < 0.01
Synchronous JIF incl. letter 0.456 .101 < 0.01
Diachronous 3-year JIF 0.458 .215 < 0.01
Diachronous 5-year JIF 0.510 .566 < 0.01
First of all we note the much higher R square which indicates that this is a much better fit. We also note that the coefficients are no longer negative but that is due to the changing of the variable. In the further analysis we therefore choose to describe the relationship between JIF and self-cited rate as non-linear by employing the transformed version of the variable.
Finally we analyse the data set using various forms of JIFs as the dependent variable as it could indicate which variables explain the JIF statistically significant and to see if the picture depicted is the same for all JIF types analysed.
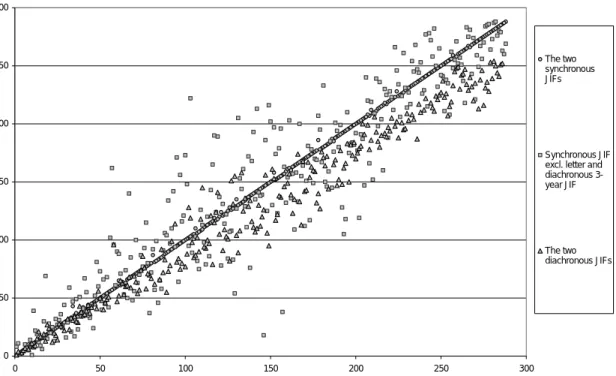
In order to preserve an overview over the analyses we start out by describing the differences between the four models in order to be able to single one of the models out and describe it further. It will be time consuming and more or less purposeless to describe all four models as we show now. To illustrate the close relatedness of the four models we have constructed figure 2 in which we can see the rank of each journal according to JIF. As we have 32 journals times 9 time periods in the dataset we end up with ranks from 1 to 288. The circles in the figure illustrate the
correlation between the two synchronous JIFs and as they are the two JIFs most similar in description they form an almost straight line. The squares in the figure compare one of the synchronous JIFs with one of the diachronous JIFs and as we can see it is not a straight line but they are closely related. The triangles in the figure illustrate the correlation between the two diachronous JIFs and again we see a close relation. This intra-disciplinary ranking with little difference between different JIFs is in accordance with results found by Garfield (1998b), Moed et al (1999) and Stegmann (1999). 0 50 100 150 200 250 300 0 50 100 150 200 250 300 The two synchronous JIFs Synchronous JIF excl. letter and diachronous 3-year JIF
The two diachronous JIFs
Figure 2.Correlation between journal rankings of selected models.
As the four models are so closely related we choose to describe only one and in cases where the models differ we describe the differences. So in the following the 3-year diachronous JIF is the main focus point. First of all we start out by presenting the
results of the linear regression model and in the following we concentrate on each element of the model.
Table 6. Multivariate linear regression analysis of 3-year diachronous JIF.
Variable Coefficients t-statistic p-value
Intercept .438 1.530 0.127
Geographic location of journal -1.198 -6.413 < 0.01 Share of publications not in English -.816 -2.439 < 0.05
Self-citing rate 19.910 3.727 < 0.01
Self-cited rate (transformed) .187 15.305 < 0.01 Scientific content (share of total) -.0179 -6.612 < 0.01 Document types included in ISI-JIF -.007 -3.107 < 0.01 Total number of documents .0171 8.472 < 0.01
R squared .626
Observations 288
We start by describing the influence by the time periods as described in the model. The trend variable is not statistically significant in the four models at the 0.1 level. That gives us an indication that we will not benefit from including in it the model. In future research and maybe including further data it might prove to be statistically significant but future research will have to cast light on that element. For the time being we can only conclude that the variable is not significant and therefore JIF is not increasing or decreasing in general over the years.
We tried running the model including all the document types but the high number of variables included weakened the model considerably and very few turned out to contribute to the understanding of JIF. Therefore we only include the document types in aggregated forms. First of all we can see that the total number of documents significantly contributes to increasing the JIF. The coefficient of .0171 is to be understood like this: if a journal editor manages to increase the total number
of documents published in the journal each year by 10 we will see an increase in JIF by 0.171. This finding is in accordance with Rousseu & Van Hooydonk (1996) who also found a positive correlation between the number of published articles and the impact factor.
The distribution of the total number of documents on document types show us that decreasing the share of documents containing the highest degree of scientific material will increase the JIF. The coefficient is -.0179 and statistically significant at the 0.01 level. This means that journals with a scientific content share of 0.1 greater than another journal will have a JIF -.00179 lower all other things equal. This aspect is further enlightened by the variable of document types included in the ISI calculation of JIF as it is also significant at the 0.01 level and the coefficient is negative. The coefficient of -0.007 means that if we increase the number included in the ISI calculation of JIF by 100 the JIF decreases by 0.7. Both variables are significant which indicates that it is not only a matter of the actual numbers of documents with scientific content it is also a matter of the share these documents comprise when we consider the total number of documents.
We notice that the variable describing the geographic origin of the journal is statistically significant at the 0.01 level. The coefficient of -1.198 should be interpreted as non-North American originated journals have JIFs that are 1.198 lower. Strong American dominance has been widely recognised as noted by e.g. Van Dalen (1999) reporting that 44 per cent of the Nobel Prize winners in economics are born outside the US, but all of these have begun their award winning work in America. There is a large export of economics researchers from the rest of the world to the United States (and Canada). Hodgson and Rothman (1999) examined the institutional background of editors and authors of 30 economic journals and also found strong American dominance. Even though the dominance is recognised this does not make the phenomenon any less interesting. Almost all economics journals describe themselves as being international and accept manuscripts from all over the
world. As manuscripts allegedly are judged purely on their academic quality such a strong American dominance should not necessarily prevail. While North American and other journals in principle publish the same types of articles, the analysis here clearly shows that there is a difference in the degree of which these articles are cited, even when controlling for a number of factors. Such a result need to be taken into account when rankings of journals are constructed for evaluation purposes since publication in European journals will affect citation numbers downwards.
The other variable concerned with geographical relations is statistically significant and that is the variable describing the share of documents not written in English. The variable is significant at the 0.05 level and a coefficient of –.816 tells us that increasing the share of documents not written in English will decrease the JIF. Increasing the share by 0.1 (meaning that 10 per cent more of the documents are not written in English) decreases the JIF by 0.0816. However, it should be noted that according to Archambault et al. (2006) the SSCI selection of journals favours English and the bias affects citation analysis.
The self-citing rate variable is statistically significant at the 0.01 level and the coefficient is positive. The coefficient of 19.910 should be understood as follows: if the share of self-citations is increased by 0.1 which means that 10 per cent more of the references in the journal are to the journal itself, the JIF will increase by 1,991. The self-cited rate variable is also significant at the 0.01 level. The coefficient is positive but that is due to the fact that we have transformed the original variable. This means that a positive coefficient of the transformed self-cited rate is to be understood as a negative coefficient of the self-cited rate.
As we are analysing journal self-citations as a means to a better understanding of the mechanism of JIF we will put the positive correlation between JIF and self-citing rate into perspective. We also have to be aware of the self-cited rate variable as this further complicates things. Inherent in the mathematical definitions there is a close
relationship between the two self-citation rates. Using the notation in table 1 we can differentiate the self-citing rate with respect to a and the self-cited rate with respect to a and we find that they will both increase if a (for self-citing rate) is increased which means that an increase in the number of self-citations all other things equal will lead to increased self-citing rates and self-cited rates.
Although inherent in the mathematical definition it is a paradox that an increase in the citing rate leads to an increase in JIF but it also leads to an increasing self-cited rate which is related to a lower JIF. This implies that JIF cannot easily by manipulated by increasing the number of self-citations in the journal. The findings can be seen as a defence of JIF as an indicator of quality as this is how we would want the rewarding system to work. Journals acknowledged to a large extent by other journals are exponents of high quality whereas journals primarily acknowledged by themselves are not. Interpreting the results as this we can also support Lawani’s theory that self-citing rate is not an expression of egoism whereas on the other hand the self-cited rate is an expression of egoism as we see little or no recognition from other journals.
However, they could also be seen as an example of the center-periphery issues in scholarly communication. It has been stated by Whitley (1991) that economics is dominated by a core of journals which maintain a particular view of economics. The periphery is engaged in alternative perceptions of economics and is not allowed to gain a foothold by the self reinforcing hierarchy. Interpreting the results using this perspective we see a number of journals with low JIFs and high self-cited rates which we can determine as being the periphery in the set of economics journals in this analysis. They are perhaps not focused on main stream research topics and/or using a heterodox theoretical approach. The potential number of citing and cited journals is low and thus the journal is more or less isolated in the periphery of economics. On the other hand we find a number of journals with high JIFs and low self-cited rates. They are focused on main stream topics and / or using widely accepted theoretical
approaches. Their potential number of citing and cited journals is high and thus they are a part of the dominant core maintaining the hierarchy.
How the results should be interpreted is beyond the scope of this analysis as it would require an in-depth analysis based on more qualitative investigations into structure of economics.
Conclusion
In this paper JIF-mechanism is investigated by focusing on journal self-citations as the treatment of these in analyses and evaluations is highly disputed. First of all we have to stress that this paper only a relatively small number of journals from only one social science. Furthermore, a number of variables are selected to be included in the study but adding more or others could potentially modify the picture depicted here.
Bearing in mind that we cannot generalise the results we can conclude that increasing the self-citing rate increases JIF. The self-citing rate is to some extent determined by the profile of the journal and has to do with the composition of document types, geographical location, language and a development over time. Furthermore, we can conclude that due to the mathematical definitions the self-citing rate and the self-cited rate are positively related. Finally, we can conclude that the transformed self-cited rate is positively correlated with JIF which is to be interpreted as an increase in the self-cited rate is related to a decrease in JIF.
Applying one perspective of analysis we can see this as a defence of JIF as is provides support to the hypothesis that JIF is capturing the impact and quality of journals. Journals acknowledged to a large extent by other journals are exponents of high quality whereas journals primarily acknowledged by themselves are not. This also gives support to Lawani’s theory that self-citing rate is not an expression of egoism whereas on the other hand the self-cited rate is an expression of egoism as we see
little or no recognition from other journals. However, there are other models of interpretation of the data. An alternative is to see this as a contribution to the center-periphery discussion in scholarly communication as it could be describing the characteristics of the highly cited core within economics and the low cited and isolated periphery.
Although many of the findings are as we expected we hereby provide the statistical analyses to support the hypotheses. Hopefully, this can qualify the debate on JIFs and journal self-citations.
Literature
Aksnes, D.W. (2003). A macro study of self-citations. Scientometrics, 56(2), 235-246. Archambault, É., É. Vignola-Gagné, G. Côté, V. Larivière & Gingras, Y. (2006). Benchmarking scientific output in the social sciences and humanities: The limits of existing databases. Scientometrics, 68(3), 329-342.
Barrett, C. B; Olia, A. & Von Bailey, D. (2000). Subdiscipline-specific journal rankings: Whither Applied Economics. Applied Economics, 32, 239-252.
Christensen, F. H.; Ingwersen, P. & Wormell, I. (1997). Online determination of the journal impact factor and its international properties. Scientometrics, 40(3), 529-540.
Craddock, N; O’Donovan, M. C. & Owen, M. J. (1996). Introducing Selfcite 2.0-career enhancing software. British Medical Journal, 313, 1659-1660.
Davis, J. B. (1998). Problems in using the Social Sciences Citation Index to rank economics journals. The American Economist, 42(2), 59-64.
Dorban, M. & Vandevenne, A. F. (1991). Bibliometric analysis of bibliographic behaviours in economic sciences. Scientometrics, 25(1), 149-165.
Egghe, L. & Rousseau, R. (1990). Introduction to informetrics. Quantitative methods in library, documentation and information science. Amsterdam: Elsevier Science Publishers.
Eto, H. (2003). Interdisciplinary information input and output of a nano-technology project. Scientometrics, 58(1), 5-33.
Fassoulaki, A.; Paraskeva, A.; Papilas, K. & Karabinis, G. (2000). Self-citations in six anaesthesia journals and their significance in determining the impact factor. British Journal of Anaesthesia, 84(2), 266-269.
Frandsen, T. F. & Rousseau, R. (2005). Article impact calculated over arbitrary periods. Journal of the American Society for Information Science and Technology, 56(1), 58-62.
Frandsen, T. F. (2005). Journal interaction: a bibliometric analysis of economics journals. Journal of Documentation, 61(3).
Gami, A. S.; Montori, V. M.; Wilczynski, N. L. & Haynes, R. B. (2004). Author self-citation in the diabetes literature. Canadian Medical Association Journal, 170(13), 1925-1927.
Garfield, E. (1974). Journal Citation Studies. XVII. Journal Self-Citation Rates-There's a Difference, Current Contents, 52, December 25, 1974.
Garfield, E. (1998). Long-term vs. short-term journal impacts: does it matter? The Scientist, 12(3); 10-12.
Glänzel, W. & Moed, H.F. (2002). Journal impact measures in bibliometric research. Scientometrics, 53, 171-193.
Hodgson, G. & Rothman, H. (1999). The editors and authors of economics journals: a case of institutional oligopoly? The Economics Journal, 109, 165-186.
Hyland, K. (2003). Self-citation and self-reference: credibility and promotion in academic publication. Journal of the American Society for Information Science and Technology , 54, 251-9.
Jennings, C. (2001). Citation data: the wrong impact? Cortex Forum, 37(4), 585-589. Kalaitzidakis, P.; Mamuneas, T. & Stengos, T. (2001). Rankings of Academic Journals and Institutions in Economics. Forthcoming: European Economic Review.
Kaltenborn, K. F. & Kuhn, K. (2004). The journal impact factor as a parameter for the evaluation of researchers and research. Revista Espanola de Enfermedades Digestivas, 96(7), 460-476.
Laband, D. N. & Piette, M. (1994). The relative impact of Economics Journals: 1970-1990. Journal of Economic Literature, 32, 640-666.
Laband, D. N. (2002). Contribution, attribution and the allocation of intellectual property rights: economics versus agricultural economics. Labour Economics, 9, 125-131.
Lawani, S. M. (1982). On the heterogeneity and classification of author self-citations. Journal of the American society for Information Science, 33, 281-284.
Lipetz, B. (1999). Aspects of JASIS authorships through five decades. Journal of the American Society for Information Science, 50(11), 994-1003.
Miller, J. B. (2002). Impact factors and publishing research. Scientist,16:11.
Moed, H. F. (2000). Bibliometric indicators reflect publication and management strategies. Scientometrics, 47(2), 323-346.
Moed, H. F. & Van Leeuwen, T. N. (1995). Improving the accuracy of Institute for Scientific Information’s journal impact factors. Journal of the American Society for Information Science, 46(6), 461-467.
Moed, H. F.; Van Leeuwen, T. N. & Reedijk, J. (1999). Towards appropriate indicators of journal impact. Scientometrics, 46, 575-589.
Neuberger, J. & Counsell, C. (2002). Impact factors: uses and abuses. European Journal of Gastroenterology & Hepatology ,14(3), 209-211.
Peritz, B. C. & Bar-Ilan, J. (2002). The sources used by bibliometrics-scientometrics as reflected in references. Scientometrics, 54(2), 269-284.
Pichappan, P. (1995). A dual refinement of journal self-citation measures. Scientometrics, 33(1), 13–21.
Rousseau, R. (1999). Temporal differences in self-citation rates of scientific journals. Scientometrics, 44(3), 521-531.
Rousseau, R. (2005). Impact factors and databases as instruments for research evaluation. In: University Evaluation & Research Evaluation (Qiu Junping, ed.), p. 255-262.
Rousseau, R. & Small, H. (2005). Escher Staircases dwarfed. ISSI Newsletter, 1(4), 8-10.
Rousseau, R. & Van Hooydonk, G. (1996). Journal production and journal impact factors. Journal of the American Society for Information Science, 47(10), 775-780. Sevinc, A. (2004). Manipulating impact factor. An unethical issue or an editor’s choice? Swiss Medical Weekly, 134, 410.
Smart, J. C. & Elton, C. F. (1982) Consumption factor scores of psychology journals: Scientometric proporties and qualitative implications. Scientometrics, 4(5), 349-360. Smith, R. (1997). Journal accused of manipulating impact factor. British Medical Journal, 314, 461. [Available at http://bmj.com/cgi/content/full/314/7079/461/d.] Snyder, H. & Bonzi, S. (1998). Patterns of self-citation across disciplines (1980-1989). Journal of Documentation, 55(5), 431-435.
Stegmann, J. (1999). Building a list of journals with constructed impact factors. Journal of Documentation, 55(3), 310-324.
Tsay, M.-Y. (2006). Journal self-citation study for semiconductor literature: Synchronous and diachronous approach. Information Processing & Management, 42(6), 1567-1577.
Van Raan, A. F. J. (1998a). In matters of quantitative studies of science the fault of theorists is offering too little and asking too much. Scientometrics, 43(1), 129-139. Van Raan, A. F. J. (1998b). The impact of international collaboration on the impact of research results. Scientometrics, 42(3), 423-428
White, H. (2001). Authors as citers over time. Journal of the American Society for Information Science and Technology, 52(2), 87-108.
Appendix 1 Journals included in this study
Nr. Journal name
1 American Economic Review
2 American Journal of Economics and Sociology 3 Brookings Papers on Economic Activity
4 Bulletin of Indonesian Economic Studies 5 Cambridge Journal of Economics
6 Desarollo Economico – Revista de Ciencas Sociales
7 Developing Economies
8 Eastern European Economics 9 Econometrica 10 Economic History Review
11 Economic Journal
12 Economica
13 Economics Letters
14 Ekonomiska Samfundets Tidskrift 15 European Economic Review
16 Explorations in Economic History
17 International Economic Review
18 Jahrbücher Für Nationalökonomie und Statistik
19 Journal of Econometrics
20 Journal of Economic Issues 21 Journal of Economic Literature 22 Journal of Economic Theory 23 Journal of political Economy 24 Kyklos
25 Oxford Economic Papers 26 RAND Journal of Economics 27 Review of Economic Studies
28 Review of Economics and Statistics 29 Scandinavian Journal of Economics 30 South African Journal of Economics
31 World Development
32 World Economy
Appendix 2.
Overview of variables
Variable Values Synchronous JIF – excl letter The number of citations to a journal in a
given year to the publications in that journal in the previous two years divided by the number of articles, reviews and notes.
given year to the publications in that journal in the previous two years divided by the number of articles, reviews, letters and notes.
Diachronous JIF – 3-years The number of citations to the publications from one year in a journal given in 3 years divided by the number of articles, reviews, letters and notes.
Diachronous JIF – 5-years The number of citations to the publications from one year in a journal given in 5 years divided by the number of articles, reviews, letters and notes.
Time period 1=1986; 2=1988; 3=1990; 4=1992;
5=1994; 6=1996; 7=1998; 8=2000; 9=2002.
Self-citing rate The total number of references to a
journal by itself in a given year divided by the number total number of references in the journal that year.
Self-cited rate The total number of citations to a
journal in a given year given by the journal itself divided by the total number of citations to the journal in that year. Both numerator and denominator are corrected when computed.
Transformed self-cited rate 1 divided by self-cited rate.
Article The number of articles published by a
journal in a given year.
Review The number of reviews published by a
Letter The number of letters published by a journal in a given year.
Note The number of notes published by a
journal in a given year.
Book review The number of book reviews published
by a journal in a given year.
Editorial The number of editorials published by a
journal in a given year.
Others The number of other document types
published by a journal in a given year.
Total The total number of publications
published by a journal in a given year. Share of document types with scientific
content
Number of reviews, notes, letters and articles divided by the total number of documents.
Number of publications included in the ISI calculation of JIF
Number of reviews, notes and articles. Geographic location of journal 0=North America; 1=Other countries Number of non-English language
publications
The number of publications written in a non-English language in a given year in a journal.
Share of non-English language publications
The number of documents written in a non-English language divided with the total number of publications.