Série Scientifique
Scientific Series
Montréal Février 1997
97s-05
Can Capital Markets Create
Incentives for Pollution Control?
Paul Lanoie, Benoît Laplante,
Maité Roy
Ce document est publié dans l’intention de rendre accessibles les résultats préliminaires de la recherche effectuée au CIRANO, afin de susciter des échanges et des suggestions. Les idées et les opinions émises sont sous l’unique responsabilité des auteurs, et ne représentent pas nécessairement les positions du CIRANO ou de ses partenaires.
This paper presents preliminary research carried out at CIRANO and aims to encourage discussion and comment. The observations and viewpoints expressed are the sole responsibility of the authors. They do not necessarily represent positions of CIRANO or its partners.
CIRANO
Le CIRANO est une corporation privée à but non lucratif constituée en vertu de la Loi des compagnies du Québec. Le financement de son infrastructure et de ses activités de recherche provient des cotisations de ses organisations-membres, d’une subvention d’infrastructure du ministère de l’Industrie, du Commerce, de la Science et de la Technologie, de même que des subventions et mandats obtenus par ses équipes de recherche. La Série Scientifique est la réalisation d’une des missions que s’est données le CIRANO, soit de développer l’analyse scientifique des organisations et des comportements stratégiques.
CIRANO is a private non-profit organization incorporated under the Québec Companies Act. Its infrastructure and research activities are funded through fees paid by member organizations, an infrastructure grant from the Ministère de l’Industrie, du Commerce, de la Science et de la Technologie, and grants and research mandates obtained by its research teams. The Scientific Series fulfils one of the missions of CIRANO: to develop the scientific analysis of organizations and strategic behaviour.
Les organisations-partenaires / The Partner Organizations
•École des Hautes Études Commerciales. •École Polytechnique.
•McGill University. •Université de Montréal.
•Université du Québec à Montréal. •Université Laval.
•MEQ. •MICST. •Avenor.
•Banque Nationale du Canada. •Bell Québec.
•Fédération des caisses populaires de Montréal et de l’Ouest-du-Québec. •Hydro-Québec.
•La Caisse de dépôt et de placement du Québec. •Raymond, Chabot, Martin, Paré.
•Société d’électrolyse et de chimie Alcan Ltée. •Téléglobe Canada.
•Ville de Montréal.
Correspondence Address: Benoît Laplante, The World Bank, Policy Research Department, *
1818 H Street, N.W., Washington, D.C. 20433, United States. École des Hautes Études Commerciales and CIRANO †
The World Bank ‡
Can Capital Markets Create Incentives
for Pollution Control?
*Paul Lanoie , Benoît Laplante , Maité Roy
† ‡ §Résumé / Abstract
Il a été observé que, par rapport au compromis entre les coûts et les bénéfices du contrôle de la pollution, les entreprises maximisant leurs profits peuvent choisir de ne pas investir leurs ressources dans la réduction de la pollution puisque la pénalité imposée par le législateur est considérablement plus faible que les coûts de l’investissement nécessaire. Récemment, les législateurs se sont engagés dans une stratégie délibérée qui a pour objet de rendre disponibles, aux agents économiques (investisseurs et consommateurs), des informations portant sur la performance environnementale des entreprises. Dans cet article, nous analysons le rôle que le marché des capitaux joue dans la création de tels incitatifs. Les résultats obtenus d’études américaines et canadiennes indiquent que le marché des capitaux réagit à la publication d’information, et que les grands pollueurs sont plus affectés que les petits. Ces résultats semblent être fonction de la capacité pour le marché des capitaux de classer et de comparer les entreprises selon leur performance environnementale et de la crédibilité du législateur quant aux actions coercitives qu’il peut entreprendre.
It has been observed that upon trading-off the costs and benefits of pollution control, profit-maximizing firms may choose not to invest their resources in pollution abatement since the expected penalty imposed by regulators falls considerably short of the investment cost. Regulators have recently embarked on a deliberate strategy to release information to markets (investors and consumers) regarding firms’ environmental performance in order to enhance incentives for pollution control. In this paper, we analyze the role that capital markets may play to create such incentives. Evidence drawn from American and Canadian studies indicates that capital markets react to the release of information, and that large polluters are affected more significantly from such release than smaller polluters. This result appears to be a function of the regulator’s willingness to undertake strong enforcement actions as well as the possibility for capital markets to rank and compare firms with respect to their environmental performance.
Mots Clés : Environnement, marchés financiers, réglementation
Keywords : Environment, Financial Markets, Regulation JEL : Q28
1. Introduction
A large number of authors have pointed out the lack of appropriate monitoring activities and weak enforcement pertaining to the implementation
of environmental regulations.1 Resources devoted to monitoring activities
allow regulators to perform only a limited number of those activities.2 Given
these limited resources, regulators have indicated a desire to direct their monitoring resources towards those plants most likely to be out of
compliance.3 Moreover, when compliance with the standards is found to be
lacking, it is generally acknowledged that fines or penalties (as imposed by regulators and courts) are too low (compared to pollution abatement costs) to
act as effective deterrents.4 For example, O’Connor (1994) writes:
In several of the countries studied here,5 the
monitoring problem is compounded by weak enforcement. In short, when violators of standards are detected, if penalised at all they often face only weak sanctions. (...) polluters are exempted from fines either on grounds of
1 We define monitoring as the set of activities aimed at verifying the status of compliance
of a specific polluter with the applicable standards; among others, these activities include inspections of a polluter’s facilities and sampling (see Magat and Viscusi (1990) for a description of the various types of inspections undertaken by the USEPA). We define enforcement as the set of actions and penalties that can be used by a regulator to penalize non-compliance with the regulation. Monitoring and enforcement together determine the expected penalty of non-compliance with the regulation. A profit-maximizing firm would compare this expected penalty with the expected cost of abating pollution to determine the course of action that maximizes profits.
2 Russell (1990) writes: “What is missing is a commitment of resources to check up on
whether those covered by the law and regulations are doing (or not doing) what is required of (or forbidden to) them.” (p. 243)
3 See Silverman (1990) and Canada (1992). Strictly speaking, such a strategy would
ignore however that the nature and amount of damages caused by a unit of pollution are in most cases a function of the characteristics of the local environment in which this unit is released. Dion, Lanoie and Laplante (1997) have shown that in fact the potential for environmental damages partly explains the regulator’s inspection strategy in the pulp and paper industry in Quebec. Furthermore, along with Deily and Gray (1991, 1996), they show that monitoring and enforcement activities are also a function of variables such as local labor market conditions (e.g. local unemployment rate), and the visibility of the plant in the local area.
4
See Russell (1990) and Saxe (1989). Fundamental to the penalty is the recovery of any economic benefit which accrued as the result of the violation of environmental law. The EPA uses a computer model (called BEN) to estimate a violator’s economic benefit from avoiding compliance. It is based on an opportunity cost argument: by delaying compliance with the standard, the money that should have been spent on pollution control can be invested on other revenue-generating activities. BEN therefore calculates the difference between the present value of compliance versus non-compliance (see Libber (1991) for more details). It is not clear however that these penalties indeed recover the economic benefits gained by violators (General Accounting Office, 1991). In Canada, the recovery of economic benefit is not a common practice (see Ontario, 1993).
financial hardship or because the violators wield undue political influence. Perhaps the most pervasive problem is that, even when fines are levied, they are frequently so low in real terms that they have little if any deterrent value. (p. 94)6
More recently, the USEPA found that some of the largest industrial states may not be enforcing federal laws governing air and water pollution:
Environmental Protection Agency officials say they have found that Pennsylvania and some other big industrial states are reporting only a handful of major pollution violations, suggesting that inspectors in those states may be turning a blind eye to pollution problems. (New York
Times, December 15, 1996)
If indeed the expected penalty for non-compliance, as imposed by environmental regulators and courts were so low, one would have difficulties to explain the generally high level of compliance with regulation in developed countries, and the very large variance in the environmental performance of plants in developing countries. Hence there must be other incentives than those provided by regulators and courts that could explain a polluter’s environmental performance. As such, the potential role and impact of local communities and markets (including consumers and investors) are
the object of increasing scrutiny.7
Once the role and potential impact of these agents are properly acknowledged, once the conditions under which the action of these agents may be effective are identified, fines and penalties imposed by regulators and courts may not appear to be in many circumstances the most appropriate or effective incentives for pollution
6 While we do not wish to argue that the experience of these East Asian countries is directly
comparable and similar to the North American experience, there are nonetheless more similarities than may appear at first glance. For example, Deily and Gray (1991) have found in the US steel industry that plants with a higher probability of closing as a result of having to comply with the environmental regulation are subject to a lesser amount of monitoring and enforcement activities. In other words, for the purpose of monitoring and enforcement, regulators target plants that may have a greater capacity to invest in pollution control or pay the fines and penalties associated with being out of compliance. In Canada, courts have used a number of mitigating factors to justify the imposition of small penalties on polluters violating environmental regulations. These include: the accused is a small company, expressed remorse and desire to avoid similar offenses in the future, has a strong sense of community in which it takes some pride, may have to shut down the factory with a loss of jobs and dire and severe financial consequences to the accused and to its employees, etc. (Canada, 1988).
7 Afsah, Laplante and Wheeler (1996) have recently developed a new paradigm for controlling
industrial pollution in developing countries which explicitly includes, as sources of incentives, local communities, and markets.
control. In fact, the USEPA has recently pointed out that “EPA’s job should grow from primarily the “enforcer” to include greater emphasis on helping citizens make informed choices in their daily lives” (EPA, 1991, p.2).
Hence, while there is a growing concern that fines and penalties imposed on agents out of compliance are not severe enough to have a
deterrence effect,8 some authors have challenged the conclusion that
polluters therefore have no incentives to comply with environmental standards. In particular, in view of the increasing facility of access and exchange of information, markets (both consumers and investors) bear an increasing amount of attention as to their capacity to generate incentives for
pollution control.9 A significant amount of research and experiments remain
to be performed in order to identify the circumstances under which the activities of these agents may be effective, the conditions under which the incentives they generate may substitute for or complement “typical enforcement practices”, and the proper role of the regulator to empower these agents. In this paper, our purpose is to discuss and examine how investors have reacted to the release of public information regarding the environmental performance of specific plants, as observed and measured by fluctuations on
the stock market.10 While some of this information is revealed through
regular coverage by newspapers, it also includes a deliberate use and release of information by regulators regarding the environmental performance of individual plants.
In the next section, we discuss the nature of the role of capital markets with respect to providing incentives for pollution control. In section III, we briefly describe the methodology typically used to measure the reaction of investors to the release of environmental information. In section IV, we review the results of the studies that have examined the reaction of investors to the announcement of environmental incidents (such as lawsuits, fines, accidents, etc.), or list of polluters (e.g. Toxics Release Inventory). We
8
Russell (1990) writes: “Efforts to monitor regulated behavior appear to have been inadequate to the task - a very difficult task in many instances - and typical enforcement practices appear to have been insufficiently rigorous.” (p. 243; italics ours). On the difficulty of the task, see General Accounting Office (1987, 1993, 1994).
9 While the current paper focuses exclusively on the role of information to generate
incentives for pollution control, the ever greater easiness of access to information suggests numerous other applications. For example, the medical license board of Massachusetts now gives public access to disciplinary records and malpractice histories of physicians in the state; it has also been suggested that airlines give public access to their safety records: number of crashes, safety violations, etc. (The Economist, January 11, 1997); the Government of Philippines is currently putting in place a rating system to compare and publicly reveal the performance of concessionaires providing water supply to the various quarters of Manila.
10 A related but different question of interest is whether or not firms with good
environmental performance have a higher market valuation than plants with bad environmental performance, other things being equal. On analysis of this nature, see Cormier et al. (1993) and the references therein.
also present the results of a new study that examines the reaction of investors to the publication of lists of firms in British Columbia that either fail to comply with environmental regulations or that are of concern to the Ministry of the Environment of British Columbia. We conclude in section V.
2. The role of capital markets
Unanticipated events, or new information may lead capital markets
to revise their expectations regarding the profitability of an enterprise. Changes in markets values thus provide estimates of changes in the net present value of expected profits as a result of the event, or new information, relative to the situation where the event would not have occurred or the information would not have been available.
It has been argued earlier that penalties imposed by regulators and courts are generally set too low to act as effective deterrents and prevent violation of environmental regulations. For example in the United States, the EPA pursues civil enforcement actions (as opposed to administrative penalties or criminal enforcement actions) to respond to the more serious or recalcitrant violators. In FY1990, civil penalties totalled $ 61 329 237 imposed in 1 400 cases, for an average penalty of $ 43 806. In FY1991, civil penalties were $ 72 835 251 in 1 419 cases; the average penalty increased to $ 51 330. The average penalty imposed under the Clean Water Act has steadily increased since 1986 to reach $ 405 436 in 1991. The maximum civil penalty imposed in FY1990 was $ 15 000 000 and $ 6 184 220 in FY 1991. In Canada, data on the number of prosecutions, convictions, and
penalties are sparse and not necessarily comparable across provinces.11
Nonetheless, it is interesting to note that penalties in Canada are typically much lower than in the United States. In Alberta, 14 prosecutions were initiated by the Attorney General’s Office in 1990; total fines levied were $ 37 275 against 8 companies. In Ontario, total fines levied increased from $ 605 668 in 1985-86 to $ 3 633 095 in 1992. Given the number of convictions, average penalties increased from $ 9 330 to $ 14 250. Despite the increase (as noted by Saxe, 1989), fines remain low. In British Columbia, 79 convictions were obtained over the period April 1 - September 30, 1992;
average fines were then slightly less than $ 3 000.12 More recently, over the
period October 1 1995 to March 30 1996, total fines of $ 219 200 were levied in British Columbia on 116 convictions for an average of less than $ 2 000 (the maximum fine was $ 20 000 and there were 59 fines of $ 500 or smaller). Criminal actions, in which the regulator typically seeks imprisonment of the defendant(s), remain rare events.
11
Upon completing an extensive study of the environmental regulation in the Canadian pulp and paper industry, Sinclair (1991) writes “the data available on prosecutions are limited” (p. 102).
Given the small size of those penalties, markets are more likely to revise their estimates of the present value of a firm only to the extent that the information leads them to revise their expectations regarding future production costs (including the pollution control costs) or the ability of the firm to generate revenues at the levels originally expected. It is interesting to note that this information may concern solely a given enterprise or may directly or indirectly allow a comparison of the environmental performance of an enterprise to the performance of other firms (such as lists of firms ranked in one way or another by their environmental performance). Information of both nature, which we may call individual information and
collective information respectively, may affect expectations regarding
production costs and revenues. However, we would argue that individual information is more likely to have a relatively larger impact on expectations of production costs (as opposed to revenues), while collective information is more likely to have a larger impact on expectations of revenues (as opposed to production costs).
Indeed, in most cases individual information takes the form of an announcement of an event that is generally not favourable to the enterprise such as a violation of regulation, the announcement of an incident causing damages to the environment (such as a spill), the announcement of a lawsuit against the enterprise, etc. As mentioned earlier, given the size of the penalties imposed by courts and regulators, it is unlikely upon such an announcement, that changes in market values, if any, would solely reflect expectations regarding the size of a potential penalty. These changes are more likely to reflect expectations that the firm may be the target of closer scrutiny and further enforcement actions, that citizens and community groups may pressure the firm to reduce its emissions (even below environmental standards), and as a result that it may have to invest large resources (financial and others, e.g. time) in pollution control. We would therefore expect changes in market value, if any, to be larger (potentially
much larger) than traditional penalties imposed by courts and regulators.13 A
further question of interest therefore is whether or not these large observed changes in market value, caused by the provision of new information, provide enough incentives for investments in pollution control.
While individual information may also lead consumer groups to boycott the good(s) produced by the enterprise, thus leading to a revision of the expectations on future revenues, the degree of substitution that is taking place may be limited due to the absence of information regarding the environmental performance of other enterprises. On the contrary, collective information which compares firms with bad performance to those with good
13
Though in a different context, Jarrell and Peltzman (1985) found that capital markets penalizes producers of recalled drugs and cars far more than the direct costs.
performance is more likely to allow this substitution to take place since it gives an alternative to those consumers who wants to substitute away from the firms with a bad environmental performance. Moreover, since pollution
efficiency is often associated to overall production efficiency,14 collective
information indirectly (and perhaps imperfectly) allows a comparison of the overall efficiency of the enterprise. This explains why we expect collective information to have a greater impact on expectations of future revenues than
individual information.
Whether or not markets react to the release of new information regarding the environmental performance of firms (whether individual or
collective information) remains ultimately an empirical issue. In the next
section, we briefly discuss the methodology used to measure market reactions. In section IV, we present a number of empirical studies and discuss the results of those studies in view of the hypotheses developed above.
3. Event-study methodology
The methodology used in this field of research is akin to event-study analyses which is based on the assumption that the capital market is sufficiently efficient to evaluate the impact of new information (events) on
expected future profits of the firms.15 The reaction to the announcement of
an event is obtained by predicting a “normal” return for each firm during an “event window” (usually the day prior to the event, the day of the event, and a number of days after the event), and then subtracting this predicted normal return from the actual return observed on those days following the announcement of the event. Normal returns are generated by estimating a
version of the Capital Assets Pricing Model (CAPM):16
(1) Rit = −(1 βi)Rft+βiRmt+eit
where Rit is the rate of return on security i for day t; Rft is the rate of return
on a risk-free asset; Rmt is the rate of return of a market index (such as the
Dow Jones market index); bi is the estimated parameter; and eit is the error
term for security i on day t. The CAPM model is estimated for each firm over
14 See Porter and van der Linde (1995).
15 The methodology was originally developed by Fama et al. (1969) and Fama (1976). This
methodology has been used to analyze the reaction of investors to numerous events of a different nature: product liability suits (Viscusi and Hersch,1990), airline crashes (Borenstein and Zimmerman, 1988; Chance and Ferris,1987), workplace safety violations (Fry and Lee, 1989), etc. Henderson (1990) notes that in 1987 and 1988, 14 event studies were published in the Journal of Finance, and 26 in the Journal of Financial Economics.
16 A number of alternative models can be used to test the robustness of the results (for
example, the single-index market model or the market adjusted returns model). Typically, these alternative tests yield results of a similar nature as those obtained by using CAPM. See Henderson (1990) for further details and discussion.
a number of days before the event window (usually between 120 and 210 days).
In absence of unexpected information, the relationship between the firm's return, the market's return and the return of the risk-free asset should be unchanged. Hence, these returns can be used to forecast the normal return for the firm. A prediction error is generated when unexpected information affects the return for the firm without affecting the market's return and the risk-free asset’s rate of return. The prediction error, commonly referred to as
the abnormal return (AR) for security i at time t (ARit), is computed as the
following:
(2) ARit =Rit−Rft−β$i(Rmt−Rft)
The day the event is announced is referred to as day 0, and all other days are measured relative to day 0. The average abnormal return is then computed across firms: (3) AARt Nt ARit i Nt = =
∑
( /1 ) 1where Nt is the number of securities in a given subsample. A statistical test
(t-test) is then used to determine the level of significance of abnormal returns for a given subsample. The test uses the estimated standard error of the returns computed for the estimation period:
(4) t=AARt/s AAR$( t)
where s AAR$( t) is the estimated standard error of abnormal returns during
the estimation period.
4. Empirical analyses
Following these lines of argument, a number of papers have investigated, using the event-study methodology, how capital markets can provide incentives for pollution control. Muoghalu et al. (1990) examine the impact of environmental enforcement measures related to the American RCRA (Resource Conservation and Recovery Act) and the Superfund Acts on firms’ financial value. Their sample consists of 128 initial lawsuits against firms and 74 case settlements (involving a fine) announced in the print media (generally the Wall Street Journal) between 1977 and 1986. The event-study results indicate that stockholders suffer on average a statistically significant loss of 1.2 percent in market value at the filing of the lawsuit, with no significant abnormal returns at the disposition of the suit. Interestingly, they compute that the abnormal losses due to announcements
of lawsuits translate into an average loss of 33.3 million $ in equity value. Given the small penalties typically imposed by courts and regulators, this result confirms our hypothesis that losses of market value, if any, are likely to be significantly larger than the traditional penalties.
Lanoie and Laplante (1994) perform a similar analysis with 9 announcements of lawsuits and 13 announcements of suit settlements in Canada during the period 1982-1991. Interestingly, they find results that contrast with those of Muoghalu et al.; i.e., they observe abnormal losses between 1.65% and 2% when the firm is found guilty (and fines are imposed), but no losses when lawsuits are initiated. This difference may be due to the conciliating approach that Canadian environmental authorities have traditionally adopted in comparison with their American counterparts (see Marchant, 1990). As pointed out earlier, it is also interesting to note that the recovery of economic benefits realised as a result of non-compliance is not a common practice in Canada while it is explicitly incorporated in the assessment of penalties in the United States. The fact that Canadian shareholders do not react to the announcement of lawsuits may indicate little or no worry as to the outcome of the legal procedure, while American environmental authorities seem to have been more successful in designing enforcement mechanisms in which a lawsuit can impose a credible threat on investors. Note that the information used in these two studies would classify as individual information.
In contrast with the preceding research, two studies have analysed the deliberate provision of information to the markets (by regulators or third parties), and its impact on firms’ value. This information is based on rankings of polluters and can thus be qualified as collective information. Shane and Spicer (1983) use studies conducted by the Council of Economic Priorities (CEP) of firms’ environmental performance in four industries (paper, power, steel, and oil) to analyse the reaction of investors to the release of the results of those studies. They examine eight studies released by the CEP between 1970 and 1975. They find that firms’ market value is adversely affected by the release of this information. Perhaps more interestingly, they also find that firms identified as serious polluters suffered greater loss of market value than those with a better ranking. Given these results, these authors conclude that investors use the information to discriminate between companies on the basis of their environmental performance records.
Hamilton (1995) examine how financial markets have reacted to the
first edition of the “Toxic Release Inventory” (TRI) in June 1989. The TRI
reports information on manufacturing facilities, with 10 or more employees, that produce or use above a threshold amount of chemicals on a list of over 300 toxic chemical substances identified by EPA. For each chemical, the facility submits a form listing releases to the environment broken down by emission pathways: air, land, underground injection, etc. Furthermore, the
TRI data contains information on facility name and parent ownership so that media coverage can link operating facilities with their parent company. Firms are ranked from large to small polluters on the basis of their absolute levels of emissions, thus allowing a direct comparison of their environmental performance.
The event-study conducted by Hamilton is based on a sample of 436 enterprises reporting TRI pollution figures. Unsurprisingly, most of these enterprises (75% of the sample) are in the manufacturing sector (chemicals, paper, primary metals, petroleum and textiles) with 12% in the chemical industry. Results show that these firms experienced negative, statistically significant abnormal returns between 0.2 and 0.3 % upon the first release of the information. These abnormal returns translated into an average loss of $4.1 million in stock value on the day the pollution figures were released, with firms in the primary metals industry experiencing a smaller loss of market value (presumably because these firms were already perceived as large polluters by the market). He also find that the larger the number of chemicals a firm reported to produce or handle at its facilities, the larger the loss the firm suffered in its market value: for each additional chemical,
Hamilton measures a loss of $236,000.17 While we are not aware of any
studies linking a firm’s loss of market value, as a result of TRI, with its environmental performance, these results nonetheless partly support former EPA director’s claim that “(...) the Toxics Release Inventory is fast becoming one of the most powerful tools we have to reduce toxic emissions.” (New
York Times, October 13, 1991)
New results
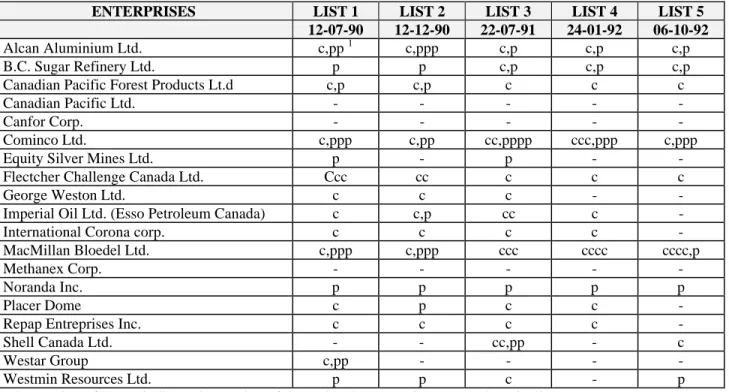
Since July 1990, every six months or so the Ministry of the Environment of British Columbia (BC, Canada) publishes a list of polluters identified into two categories: (1) firms that are currently not complying with an environmental standard or permit; and (2) firms that are of concern to the Ministry because their environmental performance is near the regulatory threshold, or because their level of pollution is abnormally high in a sector of activity which is not regulated. Since these lists do not provide a ranking of enterprises, and do not allow for a comparison of their environmental performance, we classify this information as individual information.
In the following, we examine the impact of the first five lists of polluters on the equity value of firms appearing on these lists. Our analysis complement that of Hamilton (1995) in two different ways: (1) it is based on a Canadian list providing a different set of informations than those released
17 Referring to the TRI, J.S. Naimon of the Investor Responsibility Research Center is
quoted as saying: “(...) companies that emit a lot of toxic waste do not have good financial indications in the long term.” (New York Times, October 13, 1991)
in the TRI; and (2) we investigate how investors treat the information about firms appearing successively on more than one list, while Hamilton focused exclusively on the first release of the TRI.
Table 1 presents a list of 19 firms quoted on the stock market and appearing on any of these first five lists. This table shows whether a firm has been identified as “out-of compliance” or as “of concern”. Furthermore, it indicates that multi-plants firms may appear more than once on the same list if many of their plants are either non-complying or of concern.
We use the SIMM (single-index market model) version of the standard event-study technique to analyze investors’ reaction to the publication of the lists. A three days event window (DAY -1, DAY 0 and DAY +1) is considered, where DAY 0 refers to the publication date of the
list18 . We first look at the whole sample of firms appearing on each list.
Then, we examine more specifically the firms that are of concern versus those that are out-of-compliance, and the firms that have appeared once on a given list versus those that have appeared several times. Finally, to investigate how investors react to successive appearances on different lists, we perform an analysis in which only firms that appeared on all lists (whether being of concern or out-of compliance) are considered.
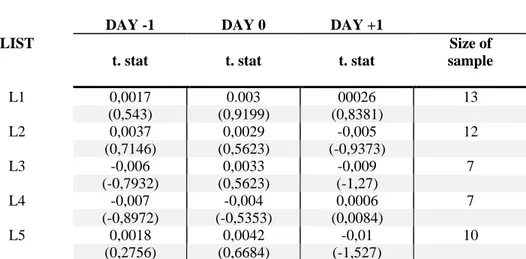
Table 2 reports the results obtained using the whole sample of firms at the publication of each list. There is no statistically abnormal loss on any day of the event window for any of the list. Contrary to what was observed by Hamilton (1995) and Shane and Spicer (1983), this suggests that appearing on the BC polluters’ list has no impact on a firm’s equity value.
A number of reasons may explain this result. First, it may be that BC’s lists of polluters do not provide new or unexpected information to investors. Canada is a much smaller market than the United States, with only a very few large public enterprises. The first release of the TRI provided a set of detailed information on releases of a large number of severe pollutants, information more likely to be unknown to the investors than that provided by the BC list. Moreover, it is important to note that in any given list, the Ministry of the Environment does not systematically report all firms out of compliance or of concern ot the Ministry. A firm may be out of compliance (or of concern) and yet never appear on the lists, or appear only after a number of lists have been published: not being listed is not necessarily an indication of good environmental performance. As we have noted before, this feature of the BC’s lists of polluters do not allow investors to rank firms according to their environmental performance. Furthermore, given the characteristics of the economy of British Columbia, unsurprisingly the companies listed in BC’s lists are mostly in the primary sector (resources) of
18 Certain companies were discarded in the analysis because of confounding events such as an announcement of dividend pay-off, profits, merger, take-over or new share emissions.
the economy; therefore, any potential decline in demand resulting from an adversarial reputation effect may be less important than in Hamilton's sample which covered firms in a broader set of activities. Finally, investors may believe that appearing on BC’s lists does not represent any significant threat for the companies involved. Given our earlier discussion, the difference between the American results and those presented here may again indicate that American environmental authorities have been more successful in designing policy mechanisms that create a credible threat for firms.
Table 3a and Table 3b provide a more detailed analysis in which different categories of firms are distinguished. In Table 3a, firms that are out-of-compliance and those that are of concern are analyzed separately. One could expect that firms out of compliance would be under a more important threat than those of concern. On the other hand, the fact that firms are of concern for the environmental authorities could be new information to the market; this could have more impact on the value of firms reported under this heading. As shown in Table 3a however, no statistically significant abnormal losses can be detected in either category.
In Table 3b, we distinguish between firms that appear once on a given list and those that appear more than once. One would expect that for environmental authorities, the pressure to take actions against a polluter may be "cumulative" so that firms appearing more than once on a given list could experience more important abnormal losses. The results seem to confirm this hypothesis. Indeed, we obtain statistically abnormal losses on day -1 and day +1 for firms appearing more than once on the second list: -0.1 % on day -1 and -1 % on day +1. Such abnormal negative returns for firms appearing several times on the second list may indicate that investors required strong signals about a firm’s bad environmental performance before revising the expected value attributed to this firm.
Table 4 provides further evidence that investors may have reacted in the way we just described. In this Table, we consider a sample of firms that have appeared on every list so as to investigate how investors handle the information contained in successive appearances on the list. There were two such firms. Again, the only significant abnormal loss appears for the second list on day +1 (a loss of 2 %) suggesting that investors needed strong indications before changing their expectations. No abnormal losses beyond the second list may mean that appearing on the list has a once-for-all effect, and that successive appearance does not provide significant new information.
5. Concluding remarks
It has been observed that upon trading-off the costs and benefits of pollution control, profit-maximizing firms may choose not to invest their resources in pollution abatement since the expected penalty imposed by regulators falls considerably short of the investment cost. This however
ignores that markets and communities can also create incentives for pollution control to the extent that they possess information regarding a polluter’s environmental performance. Regulators have recently embarked on a deliberate strategy to release information to markets (investors and consumers) and communities regarding firms’ environmental performance in order to enhance incentives for pollution control.
In this paper, we analyze the role that capital markets may play to create such incentives. Evidence drawn from American and Canadian studies indicates that capital markets react to the release of information, and that large polluters are affected more significantly from such release than smaller polluters. Hence, regulatory agencies can use, in addition to traditional regulatory measures, information-oriented approaches so as to harness the power of communities and markets to put pressure on polluters. This result however appears to be a function of the regulator’s willingness to undertake strong enforcement actions (United States Vs Canada), as well as the possibility for capital markets to rank and compare firms with respect to their environmental performance (Council of Economic Priorities and TRI Vs British Columbia’s lists of polluters).
Further research in this area will indicate the circumstances under which the release of information can create incentives for pollution control by empowering the agents that can bear pressure on polluters. In particular, current research will indicate whether or not capital markets in developing
countries can create incentives for pollution control.19 Further research
should also indicate whether or not this information not only has an impact on market valuation, but ultimately whether or not it affects a polluter’s environmental performance.
19
Research is currently taking place in Argentina, Chile, Indonesia, Mexico, and Philippines.
References
Afsah, S., Laplante, B. and D. Wheeler (1996), Controlling industrial
pollution: a new paradigm, World Bank, Policy Research Department,
Working Paper No. 1672, Washington, D.C.
Borenstein, S. and M.B. Zimmerman (1988), “Market incentives for safe commercial airline operation”, American Economic Review, 78, 5, 913-935.
Canada (1988), Prosecutions under the pollution control and habitat
protection provisions of the Fisheries Act, Fisheries pollution reports,
Volume 4, Environment Canada and Fisheries and Oceans Canada, Ottawa, Ontario.
______ (1992), The Green Plan: a framework for discussion on the
environment, Ministry of the Environment, Ottawa, Ontario.
Chance, D.M. and S.P. Ferris (1987), “The effect of aviation disasters on the air transport industry: a financial market perspective”, Journal of
Transport Economics and Policy, 21, 2, 151-165.
Cormier, D., Magnan, M. and B. Morard (1993), “The impact of corporate pollution on market valuation: some empirical evidence”, Ecological
Economics, 8, 135-155.
Deily, M.E. and W.B. Gray (1991), “Enforcement of pollution regulations in a declining industry”, Journal of Environmental Economics and
Management, 21, 260-274.
________________________ (1996), “Compliance and enforcement: air pollution regulation in the U.S. steel industry”, Journal of
Environmental Economics and Management, 31, 96-111.
Dion, C., Lanoie, P. and B. Laplante (1997), “Monitoring of pollution regulation: do local conditions matter?”, World Bank, Policy Research Department, Working Paper No. 1701, Washington, D.C.
Environmental Protection Agency (1991), “Environmental education”, EPA
Journal, 17, 4.
Fama, E.F., Fisher, L., Jensen, M.C. and R. Roll (1969), “The adjustment of stock prices to new information”, International Economic Review, 10, 1, 1-21.
Fry, C.L. and I. Lee (1989), “OSHA sanctions and the value of the firm”, The
Financial Review, 24, 599-610.
General Accounting Office (1987), Hazardous waste: facility inspections are
not thorough and complete, Report RCED-88-20, Washington, D.C.
_____________________ (1991), Environment enforcement: penalties may
not recover economic benefits gained by violators, Report
RCED-91-166, Washington, D.C.
_____________________ (1993), Environmental enforcement: EPA cannot
ensure the accuracy of self-reported compliance monitoring data,
Report RCED-93-21, Washington, D.C.
_____________________ (1994), Toxic substances: EPA needs more
reliable source reduction data and progress measures, Report to the
Chairman, Subcommittee on Health and the Environment, Committee on Energy and Commerce, House of Representatives, Washington, D.C. Hamilton, J.T. (1995), “Pollution as News: Media and Stock Market
Reactions to the Toxic Release Inventory Data”, Journal of
Environmental Economics and Management, 98-103.
Henderson, G. V. (1990), “Problems and solutions in conducting events
studies”, Journal of Risk and Insurance, 42, 282-306.
Jarrell, G. and S. Peltzman (1985), “The impact of product recalss on the wealth of sellers”, Journal of Political Economy, 93,3, 512-536.
Lanoie, P. and B. Laplante (1994), “The market response to environmental incidents in Canada: a theoretical and empirical analysis”, Southern
Economic Journal, 60, 657-672.
Libber, J.D. (1991), “Penalty assessment at the environmental protection agency: a view from inside”, National Environmental Enforcement
Journal, 6, 3, 3-11.
Magat, W.A. and W.K. Viscusi (1990), “Effectiveness of the EPA’s regulatory enforcement: The case of industrial effluent standards”,
Marchant, G.E. (1990), “Environmetal protection in North America: A comparative of the regulatory approach in Canada and the United States”, Mimeo, Harvard Law School, Cambridge.
Muoghalu, Michael I., Robison, H. David and John L. Glascock (1990), “Hazardous waste lawsuits, stockholder returns, and deterrence”,
Southern Economic Journal, October 1990, 357-70.
O’Connor, D. (1994), Managing the Environment with Rapid
Industrialisation: Lessons from the East Asian Experience, Development
Centre of the Organisation for Economic Co-operation and Development, Paris.
Ontario (1993), Offences against the environment: environmental
convictions in Ontario, 1992, Ministry of the Environment, Toronto,
Ontario.
Porter, M. E. and C. van der Linde (1995), “Toward a new conception of the Environment-Competitiveness Relationship”, Journal of Economic
Perspectives, 9, 4, 97-118.
Russell, Clifford S. (1990), “Monitoring and enforcement”, in Public
Policies for Environmental Protection, edited by P. R. Portney,
Washington D.C.: Resources for the Future, pp. 243-74.
Saxe, D. (1989), “Fines go up dramatically in environmental cases”,
Canadian Environmental Law Reports, 3, 104-121.
Shane, P.B. and H.H. Spicer (1983), “Market response to environmental information produced outside the firm”, The Accounting Review, LVIII, 521-538.
Silverman, S.L. (1990), “Federal enforcement of environmental laws”,
Massachusetts Law Review., 75, 95-8.
Sinclair, W.F. (1991), “Controlling effluent discharges from Canadian pulp and paper manufacturers”, Canadian Public Policy, 17, 1, 86-105. Viscusi, W.K. and J. Hersh (1990), “The market response to product safety
Table 1: Public enterprises identified in the lists of polluters
ENTERPRISES LIST 1 LIST 2 LIST 3 LIST 4 LIST 5 12-07-90 12-12-90 22-07-91 24-01-92 06-10-92
Alcan Aluminium Ltd. c,pp 1 c,ppp c,p c,p c,p
B.C. Sugar Refinery Ltd. p p c,p c,p c,p
Canadian Pacific Forest Products Lt.d c,p c,p c c c
Canadian Pacific Ltd. - - - -
-Canfor Corp. - - - -
-Cominco Ltd. c,ppp c,pp cc,pppp ccc,ppp c,ppp
Equity Silver Mines Ltd. p - p -
-Flectcher Challenge Canada Ltd. Ccc cc c c c
George Weston Ltd. c c c -
-Imperial Oil Ltd. (Esso Petroleum Canada) c c,p cc c
-International Corona corp. c c c c
-MacMillan Bloedel Ltd. c,ppp c,ppp ccc cccc cccc,p
Methanex Corp. - - - -
-Noranda Inc. p p p p p
Placer Dome c p c c
-Repap Entreprises Inc. c c c c
-Shell Canada Ltd. - - cc,pp - c
Westar Group c,pp - - -
-Westmin Resources Ltd. p p c - p
1
The number of letters indicate the number of times that the enterprise appeared on the list
Table 2: Whole sample results
DAY -1 DAY 0 DAY +1
LIST Size of
t. stat t. stat t. stat sample
L1 0,0017 0.003 00026 13 (0,543) (0,9199) (0,8381) L2 0,0037 0,0029 -0,005 12 (0,7146) (0,5623) (-0,9373) L3 -0,006 0,0033 -0,009 7 (-0,7932) (0,5623) (-1,27) L4 -0,007 -0,004 0,0006 7 (-0,8972) (-0,5353) (0,0084) L5 0,0018 0,0042 -0,01 10 (0,2756) (0,6684) (-1,527)
Table 3a
Plants out of compliance Plants of concern DAY -1 DAY 0 DAY +1 DAY -1 DAY 0 DAY +1
LIST Size of Size of
t. stat t. stat t. stat sample t. stat t. stat t. stat sample
L1 -0,002 0,01486** 0 4 0,0179* 0,0064 0,0097 3 (-0,2694) (2,123) (0,05831) (1,92) (0,6777) (1,033) L2 0,0079 -0,004 0,0039 4 0,01014 0,01277 -0,003 4 (1,028) (-0,5575) (0,5074) (1,11) (1,399) (-0,3323) L3 -0,002 -0,0125 0 4 -0,0136 0,0026 -0,0308 1 (-0,1111) (-0,6513) (-0,0341) (-0,2761) (0,0538) (-0,656) L4 0,01149 -0,007 -0,009 2 0,0015 -0,004 0,0056 1 (0,7123) (-0,4538) (-0,532) (0,1043) (-0,2595) (0,3896) L5 -0,002 0,0013 -0,007 4 -0,003 0,0013 -0,0144 3 (-0,265) (0,1528) (-0,8416) (-0,2965) (0,1351) (-1,485)
* Statistically significant at the 90% level.
Table 3b
Firms appearing once Firms appearing more than once DAY -1 DAY 0 DAY +1 DAY -1 DAY 0 DAY +1
LIST Size of Size of
t. stat t. stat t. stat sample t. stat t. stat t. stat sample
L1 0,0048 0,011096* 0,00406 7 0,00381 0 -0,0022 6 (0,7902) (1,814) (0,6622) (0,5021) (-0,051) (-0,2851) L2 0,0086 0,00263 0,0009 7 -0,0011* 0 -0,01091* 5 (1,333) (0,4052) (0,1426) (-1,677) (-0,007) (-1,712) L3 -0,003 -0,01159 -0,0035 4 -0,0067 0,006 -0,01012 3 (-0,1426) (-1,6174) (-0,1885) (-0,8977) (0,7953) (-1,347) L4 0,0059 -0,0053 -0,001 2 -0,01183 -0,004 0,0009 5 (0,5241) (-0,4748) (-0,05241) (-1,38) (-0,4156) (0,1042) L5 -0,003 0,0017 -0,01026 7 0,015537 0,0091 -0,0039 2 (-0,4383) (0,2495) (-1,504) (1,501) (0,8876) (-0,3767)
* Statistically significant at the 90% level.
TABLE 4
ENTREPRISES APPEARING ON THE FIRST FIVE LISTS
DAY -1 DAY 0 DAY +1
LIST
t. stat t. stat t. stat
L1 0,004622 0,002476 0,011362 0,4706 0,2519 1,149 L2 -0,00592 0,008302 -0,020457** -0,571 0,8019 -1,969 L3 -0,010403 0,009997 -0,014264 -1,079 1,034 -1,48 L4 -0,01294 -0,0044 -0,00159 -1,145 -0,3889 -0,1407 L5 0,009816 0,024394* -0,00933 0,7527 1,893 -0,7249
* Statistically significant at the 90% level.
Vous pouvez consulter la liste complète des publications du CIRANO et les publications elles-mêmes
%
sur notre site World Wide Web à l'adresse suivante :
Liste des publications au CIRANO %%
Cahiers CIRANO / CIRANO Papers (ISSN 1198-8169)
96c-1 Peut-on créer des emplois en réglementant le temps de travail ? / par Robert Lacroix 95c-2 Anomalies de marché et sélection des titres au Canada / par Richard Guay,
Jean-François L'Her et Jean-Marc Suret 95c-1 La réglementation incitative / par Marcel Boyer
94c-3 L'importance relative des gouvernements : causes, conséquences et organisations alternative / par Claude Montmarquette
94c-2 Commercial Bankruptcy and Financial Reorganization in Canada / par Jocelyn Martel 94c-1 Faire ou faire faire : La perspective de l'économie des organisations / par Michel Patry Série Scientifique / Scientific Series (ISSN 1198-8177)
97s-08 Living on a Noisy and Dusty Street: Implications for Environmental Evaluation / Tagreed Boules, Robert Gagné et Paul Lanoie
97s-07 The Location of Comparative Advantages on the Basis of Fundamentals Only / Thijs ten Raa et Pierre Mohnen
97s-06 GARCH for Irregularly Spaced Financial Data: The ACD-GARCH Model / Eric Ghysels, Joanna Jasiak
97s-05 Can Capital Markets Create Incentives for Pollution Control? / Paul Lanoie, Benoît Laplante et Maité Roy
97s-04 La régie des services informatiques : Le rôle de la mesure et des compétences dans les décisions d’impartition / Benoit A. Aubert, Suzanne Rivard et Michel Patry 97s-03 Competition and Access in Telecoms: ECPR, Global Price Caps, and Auctions / Marcel
Boyer
97s-02 L’économie des organisations : Mythes et réalités / Marcel Boyer
97s-01 Fixed Wages, Piece Rates, and Intertenporal Productivity: A Study of Tree Planters in British Columbia / Harry J. Paarsch et Bruce Shearer
96s-34 Structural Change and Asset Pricing in Emerging Markets / René Garcia et Eric Ghysels 96s-33 Monitoring of Pollution Regulation: Do Local Conditions Matter? / Catherine Dion, Paul
Lanoie et Benoit Laplante
96s-32 Technological Learning and Organizational Context: Fit and Performance in SMEs / Élisabeth Lefebvre, Louis A. Lefebvre et Lise Préfontaine
96s-31 Piece Rates, Fixed Wages, and Incentive Effects: Statistical Evidence from Payroll Records / Harry J. Paarsch et Bruce Shearer
96s-30 R&D Spillover and Location Choice under Cournot Rivalry / Ngo Van Long et Antoine Soubeyran