HAL Id: dumas-01959076
https://dumas.ccsd.cnrs.fr/dumas-01959076
Submitted on 3 Jan 2019HAL is a multi-disciplinary open access archive for the deposit and dissemination of sci-entific research documents, whether they are pub-lished or not. The documents may come from teaching and research institutions in France or abroad, or from public or private research centers.
L’archive ouverte pluridisciplinaire HAL, est destinée au dépôt et à la diffusion de documents scientifiques de niveau recherche, publiés ou non, émanant des établissements d’enseignement et de recherche français ou étrangers, des laboratoires publics ou privés.
Determination of predonation single kidney GFR in
living kidney donor transplantation to predict renal
allograft function and donor functional gain
Morgane Heitz
To cite this version:
Morgane Heitz. Determination of predonation single kidney GFR in living kidney donor transplan-tation to predict renal allograft function and donor functional gain. Human health and pathology. 2018. �dumas-01959076�
AVERTISSEMENT
Ce document est le fruit d'un long travail approuvé par le
jury de soutenance et mis à disposition de l'ensemble de la
communauté universitaire élargie.
Il n’a pas été réévalué depuis la date de soutenance.
Il est soumis à la propriété intellectuelle de l'auteur. Ceci
implique une obligation de citation et de référencement
lors de l’utilisation de ce document.
D’autre part, toute contrefaçon, plagiat, reproduction illicite
encourt une poursuite pénale.
Contact au SID de Grenoble :
bump-theses@univ-grenoble-alpes.fr
LIENS
LIENS
Code de la Propriété Intellectuelle. articles L 122. 4
Code de la Propriété Intellectuelle. articles L 335.2- L 335.10
http://www.cfcopies.com/juridique/droit-auteurUNIVERSITE GRENOBLE ALPES
FACULTÉ DE MÉDECINE DE GRENOBLE
Année 2018
Determination of predonation single kidney GFR
in living kidney donor transplantation to predict
renal allograft function and donor functional gain
THÈSE PRESENTÉE POUR L’OBTENTION DU TITRE DE
DOCTEUR EN MÉDECINE DIPLÔME D’ÉTAT
Spécialité Néphrologie
HEITZ Morgane
THÈSE SOUTENUE PUBLIQUEMENT
A LA FACULTÉ DE MÉDECINE DE GRENOBLE*
Le 11 Octobre 2018
Devant le Jury composé de :
Président du jury :
M. le Professeur Lionel ROSTAING (Néphrologue)
Directrice de thèse :
Mme le Docteur Rachel TETAZ (Néphrologue)
Membres :
M. le Professeur Christophe MARIAT (Néphrologue)
M. le Professeur Jean Jacques RAMBEAUD (Urologue)
M. le Docteur Nicolas TERRIER (Urologue)
*La faculté de Grenoble n’entend donner aucune approbation ni improbation aux opinions émises dans les thèses ; ces opinions sont considérées comme propres à leurs auteurs
6
REMERCIEMENTS
A Monsieur le Professeur ROSTAING Lionel, merci d’avoir étayer ma curiosité médicale vers ce sujet de thèse inédit. Je suis particulièrement reconnaissante envers votre investissement auprès des internes grenoblois, merci de votre disponibilité et de vos conseils toujours pertinents. Recevez toute ma gratitude et mon profond respect.
A Madame le Docteur TETAZ Rachel, merci d’avoir accompagné ce travail au quotidien, merci de ta disponibilité sans faille, merci de tes encouragements qui m’ont permis d’avancer dans ce long parcours.
A Monsieur le Professeur RAMBEAUD Jean-Jacques, vous avez initié au CHU de Grenoble, l’évaluation précise des donneurs grâce à la scintigraphie, sans vous cette étude n’aurait pu voir le jour. Vous me faites l’honneur d’apporter votre expérience chirurgicale au jugement de ce travail. Veuillez accepter ma respectueuse considération.
A Monsieur le Professeur MARIAT Christophe, vous me faites l’honneur d’apporter un œil néphrologique extérieur pour juger ce travail, veuillez trouver ici l’expression de mes sincères remerciements et de mon profond respect.
A Monsieur le Docteur TERRIER Nicolas, merci de m’avoir permis de découvrir l’aspect chirurgical de la transplantation rénale qui m’était alors inconnu. Merci de votre engagement au quotidien afin de renforcer les liens indispensables entre néphrologues et urologues.
A Audrey Soler, la meilleure des secrétaires sans qui ce travail ne serait pas ce qu’il est aujourd’hui ! Merci à toute l’équipe en charge des donneurs vivants
A Matthieu Roustit, du CIC, pour l’aide statistique
7
TABLE OF CONTENTS :
REMERCIEMENTS ... 6 ABBREVIATIONS... 9 ABSTRACT ... 10 RESUME ... 11 1. INTRODUCTION ... 172. MATERIALS AND METHODS ... 20
1. Population ... 20 2. Patients characteristics ... 21 3. Statistical analysis ... 22 3. RESULTS ... 24 1. Flow chart ... 24 2. Donors ... 25
1. Predonation donors’ characteristics ... 25
2. Follow-up results ... 27
3. Factors influencing donor functional gain ... 28
3. Recipients... 30
1. Baseline characteristics ... 30
2. Follow-up results ... 32
3. Factors influencing graft function ... 33
4. DISCUSSION ... 36
5. CONCLUSION ... 41
8
Determination of predonation single kidney GFR in
living kidney donor transplantation to predict
renal allograft function and donor functional gain
9
ABBREVIATIONS
GFR: glomerular filtration rate
skGFR: single kidney GFR m GFR: measured GFR e GFR: estimated GFR
51Cr-EDTA: 51Cr-ethylene-diamine tetra-acetic acid DMSA: dimercaptosuccinic acid
99Tm-DTPA : 99Tm-diethylenetriamine pentaacetic acid LKD: living kidney donor
MDRD: Modification of Diet in Renal Disease
CKD-EPI: Chronic Kidney Disease - Epidemiology Collaboration ESRD: End-stage renal disease
10
ABSTRACT
Currently, two main objectives are discussed about living kidney transplantation. On the first hand, providing the best graft function and on the other hand, ensuring the safety of donation. In our study, we hypothesized that the single kidney GFR (skGFR) of the transplanted kidney might predict the graft function and the skGFR of the remaining kidney also predict the donor functional gain. We conducted a prospective monocentric study in Grenoble-Alpes University Hospital including 20 couples of donors and recipients who had a DMSA renal scintigraphy and 51Cr-EDTA clearance in predonation evaluation in order to calculate their skGFR. All patients underwent renal function assessment by 51Cr-EDTA clearance one-year after transplantation to measure graft function and donor functional gain. All donors had predonation normal renal function. At one-year post transplantation, the median m GFR of graft was 50ml/min/1.73m2 (range 46-56) and the donor m GFR was 59ml/min/1.73m2 (range 55-74). The median functional gain was 20ml/min/1.73m2 (range 12-22). No statistically correlation could have been established between skGFR of the transplanted kidney with the graft function at one-year (R2=0.096, p=0.7). For the donor, functional gain was not associated with predonation skGFR of the remaining kidney (R2=0.17, p=0.5). A statistically difference was shown between donor functional gain (18±10) and recipient gain (delta between sk GFR before and after transplantation) (7±16) (p=0.02). Furthers studies with more statistical power have to been done in order to highlight the influencing factors of the renal function post transplantation.
11
RESUME
Les deux enjeux majeurs en transplantation rénale avec donneur vivant sont d’une part d'assurer une fonction du greffon la plus optimale possible et d’autre part, de permettre au donneur de conserver une bonne fonction rénale. Nous avons émis l’hypothèse que le DFG séparé du futur rein transplanté influençait la fonction du greffon et de la même façon, le DFG du rein restant pouvait être prédictif du gain fonctionnel chez le donneur. Nous avons réalisé une étude prospective monocentrique au CHU Grenoble-Alpes incluant 20 couples donneurs-receveurs ayant bénéficié en pré don d’une évaluation par scintigraphie au DMSA et d’une clairance mesurée au 51Cr-EDTA afin de calculer leur DFG séparé rein par rein. Tous ont bénéficié d’une nouvelle mesure à un an post transplantation du DFG par 51Cr-EDTA. Tous les donneurs avaient en pré don une fonction rénale normale. A un an post transplantation, les DFG médian des receveurs était à 50ml/min/1.73m2 (range 46-56) et celui des donneurs à 59ml/min/1.73m2 (range 55-74). Le gain fonctionnel médian était de 20ml/min/1.73m2 (range 12-22). Dans notre étude, la valeur du DFG séparé n'était pas associée à la fonction du greffon ni corrélée au gain fonctionnel du donneur (R2=0.2 et 0.17, p=0.4 et 0.5 respectivement). L'âge, l'IMC, le DFG total pré don, le volume du rein n'étaient pas non plus associés à la fonction du greffon ou au gain fonctionnel du donneur. Les receveurs avaient un gain post transplantation significativement plus élevé que les receveurs. La poursuite d’études est nécessaire pour préciser au mieux les facteurs pré don permettant d’assurer une bonne fonction rénale post transplantation.
1. INTRODUCTION
Because of the increasing shortage of deceased donors, living kidney donor (LKD) transplantation has become an attractive alternative to decrease time waiting for a transplant. The quality of a deceased-donor renal transplant can be predicted from factors, such as donor age, cause of death, cold ischemia time … (1,2). Because of the increasing number of marginal donors, clinicians have developed a predictive score for graft viability to stratify the risk of patients receiving graft with poor outcomes. For living-donor organs, potential markers for quality include donor kidney function, age, kidney volume… (3,4). However, the published results are often equivocal and are mainly derived from indirect observations and small cohorts.
The most well-known study of LKD function as an influencing factor on graft outcome was conducted by Norden et al. who showed that the hazard ratio for graft loss was double when predonation measured glomerular filtration rate (m GFR) was < 80 mL/min/1.73m2 (5). However, Young et al. analyzed 2057 living-donor transplantations and found no difference in graft outcomes between predonation estimated GFR (e GFR) > 80 or < 80mL/min/1.73m2 (1). Other studies have reported similar results with measured GFR, which is the gold standard to assess kidney function (2,6,7).
The gold standard GFR measurement in living donors is, currently, clearance of exogenous markers such as 51Cr-EDTA (51Cr-ethylene-diamine tetra-acetic acid) or inulin clearance (which is no performed in France). Nonetheless, due to the complexity of measurements, many transplant centers use only e GFR assessed using the Cockcroft-Gault, MDRD (Modification of Diet in Renal Disease) or CKD-EPI (Chronic Kidney Disease - Epidemiology Collaboration)
18
formula derived from serum creatinine. Van Londen et al. in 2018 compare GFR from living donors using equations and measured values, they confirmed that the equations underestimated GFR as previously shown by Tent et al. (8–10).
Currently, KDIGO Guidelines 2017 suggest that donor’s GFR should be estimated from serum creatinine as an initial assessment, but should then be confirmed in one or more measurements, depending on availability among 51Cr-EDTA, iohexol or 99Tm-DTPA (99 Tm-diethylenetriamine pentaacetic acid) clearance. Estimated GFR, using a combination of serum creatinine and cystatin C, measured creatinine clearance or repeat e GFR from creatinine are used in most developing countries. The guidelines recommend that a donor with a GFR of <60mL/min/1.73m2 should not donate, but the report does not specify if it is e GFR <60 or m GFR <60. Conversely, if GFR is > 90mL/min/1.73m2, then a person can donate. However, the decision to approve a donor candidate with GFR between 60 to 89mL/min/1.73 m2 should be assessed in relation to the transplant program’s acceptable risk threshold (11).
The first aim of our study was to determine the GFR of a potential single donated kidney to predict good renal function in the recipient after transplantation. We could then assess LKD accurately, especially for a donor with limited GFR before donation, i.e. 60 to 90mL/min/1.73m2. In the literature, many previous studies have used total e GFR and only a few takes renal asymmetry into account to predict graft function.
The second aim of this study is to predict a long-term optimal donor kidney function after donation. Unilateral nephrectomy in healthy donors does not usually lead to clinically significant damage to the remaining kidney (12). Until now, the life expectancy of kidney donors appears to be even longer than general population.(13) Nevertheless, recent studies have criticized this assumption, saying that the control group labelled as “the general
19
population” were chosen from a non-donor population that may have health criteria. These reports have shown an increased risk of medical complications, notably end-stage renal disease (ESRD) within 15 years of kidney donation compared to healthy non-donor population. Mjoen et al. reported an increase 11-fold relative risk compared to the healthy non donor population. Muzaale et al. found a relative risk of 8-fold. Although the relative risk of ESRD increases after donation, absolute risk of ESRD remains lower than the general population.(14–16) Screening of donors should be highly meticulous.
Immediately after donation, donor GFR declines because of the immediate loss of ≈50% of renal mass. There is compensatory hyperfiltration of the remaining kidney, which results in a reduced GFR of only 30%. Ibrahim et al. showed in 2009, that at 12 years post transplantation, m GFR was 76% of the e GFR at donation. 85% of donor m GFR was >60ml/min/1.73m2, 32% had hypertension and 12% had microalbuminuria.(17) Consequently, a donor that had a total GFR of > 90ml/min/1.73m2 could expect to have a one-year post donation total GFR of > 60ml/min/1.73m2. This is called the functional gain.
Two mechanisms involved in functional gain are described, one is defined as an increase in kidney volume and the other as an increase of renal plasma flow.(18) Thus, the predonation parameters (such as kidney volume and pulse wave velocity) seem to be factors that have influenced functional gain in previous studies.(19,20) Ibrahim et al. studied other characteristics in a population of 4187 living donors. Older age, high body mass index (BMI), low predonation GFR and high blood pressure were reported as being factors that affected the long-term function of the remaining kidney. However, the biological parameters that theses researchers used are not the current gold standard with measured GFR to evaluate
20
donor kidney function. Moreover, no vascular or morphologic characteristics were taken into account.(17)
A single kidney GFR is more accurate at evaluating renal function evaluation and can be measured by different methods, the gold standard is scintigraphy, but CT-scan (computed-tomography-scan) may also be used. The aim of this study was to predict the relationship between predonation single kidney GFR and subsequent renal allograft function as well as the donor functional gain at one-year post transplantation.
2. MATERIALS AND METHODS
1. Population
We designed a prospective and monocentric study that included all successive donor-recipient couples that underwent living kidney donor transplantation between December 2015 and July 2017. The study was conducted in Grenoble-Alpes University Hospital (France). Sixty-three couples (living kidney donors and their recipients) underwent ABO and HLA compatible renal transplantation. At the predonation evaluation, only 24 donors had a measured GFR with 51 Cr-EDTA and were included in our prospective study. None had a history of kidney disease, diabetes mellitus or cardiovascular events.
Recipients aged <18 or those that had lost their graft for any reason within one-year of transplantation were excluded as we focused on analyzing the functional effect of donated kidney on the recipient, irrespective of other immune or non-immune factors.
Written consent was obtained from each patient. We obtained approval for this study of the local ethics committee.
21
2. Patients characteristics
The patient’s demographic and biologic parameters were collected before and during follow-up at 3 months and one-year after transplantation. Body surface area (BSA) was calculated using Dubois method. The CKD-EPI formula was chosen to estimate GFR because this equation shows a lower bias in healthy populations and has greater precision than the MDRD equation.(21) The e GFR was calculated from serum creatinine measured using an enzymatic method. In addition, it was completed by 51Cr-EDTA measurement of GFR, adjusted to the recipient BSA at one-year to assess graft function and adjusted to the donor BSA for the predonation evaluation and to calculate functional gain. Kidney volume was measured by a CT-scan in all donors using the ellipsoid equation.(6)
All patients had a DMSA (dimercaptosuccinic acid) scintigraphy as recommended by the urologist community (22) and the specific contribution of each kidney to overall GFR (single kidney GFR) was then evaluated. We used the percentage of each kidney uptake to calculate the single kidney GFR (skGFR). We used the method described by Gates in 1983, right sk GFR= (% right uptake) x (total donor m GFR), conversely, left sk GFR= (% left uptake) x (total donor m GFR).(23)
The endoscopic (laparoscopic) approach was the surgical technique for living-donor nephrectomy in our centre according to the European Association of Urology guidelines. The guidelines recommend the removal of the left kidney because of the longer length of the left renal vein.(24)
All recipients received immunosuppression induction of anti-thymocyte globulin or basiliximab according to their immunologic risk. The maintenance immunosuppressive regimen consisting of either tacrolimus, mycophenolate-mofetil (MMF) and prednisone or tacrolimus, everolimus and prednisone. After three months of transplantation, the second
22
regimen provides lower doses of tacrolimus compared to standard therapy (i.e. 3-5 µg/L vs 5-8 µg/L of tacrolimus) and circulating doses of everolimus are maintained between 4 and 6 ng/ml. A graft biopsy was performed systematically in our center at three months post transplantation and was analyzed by the same experienced renal pathologist who gave a score according to the semi qualitative chronic Banff classification to define the rejection or not. Physiopathologically, the donor functional gain (in ml/min/1.73m2) at one-year was defined as the difference between skGFR of the remaining kidney before and after donation (gain= sk GFR post donation- predonation skGFR of the remaining kidney). In analyses, we chose to take into account a comprehensive list of factors that had been previously correlated: age, BMI, total GFR or volume of the remaining kidney (skGFR/volume). We hypothesized that the skGFR of the remaining kidney divided by the volume of this kidney (skGFR/volume in ml/min/cm3) reflected renal functional reserve at the time of donation and/or hypertrophy capacity as described by Courbebaisse et al. This has been shown to be a negative predictive factor for functional gain (donors with a lower skGFR/volume should have a greater functional gain than those with a higher skGFR/volume).(19)
We calculated in the same way, the recipient “gain” as skGFR post transplantation – predonation sk GFR of the donated kidney. Then, we analyzed the impact of immunosuppression regimen and difference of donor age on this gain.
3. Statistical analysis
Statistical analyses were performed using SPSS software. Continuous data are presented as median (interquartile). Qualitative parameters were formulated using percentages. All data were normally distributed (Shapiro-Wilk and Kolmogorov-Smirnov test). Univariate analyses were performed using Spearman’s correlation and Student’s t test methods for
23
categorical/ordinal and continuous data, respectively. The Wilcoxon test was performed to compare two paired samples and the Mann-Whitney test was also performed to compare two independent samples. Multivariable linear regression models were made to study independent associations of donor and recipient variables with m GFR. All tests were realized with a threshold of 5%.
24
3. RESULTS
1. Flow chart
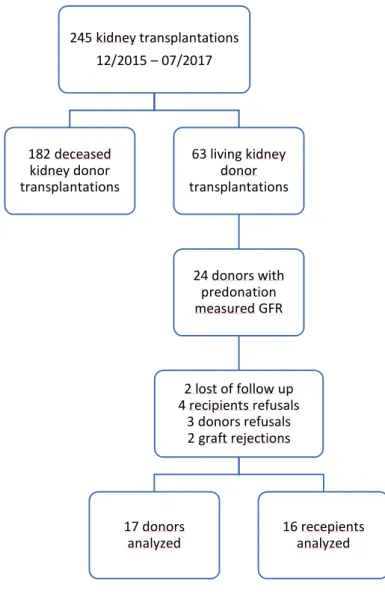
Among these 24 donors-recipients couples, two recipients were excluded from the analyses due to graft loss caused by acute rejection (confirmed with a transplant biopsy and Banff criteria), two couples were lost of follow up because the donors lived in other countries and could not undergo the one-year post transplantation examinations. Three donors and four recipients refused to take part in the follow-up protocol. Overall, 17 donors and 16 recipients were included in our complete analysis (Figure 1).
Figure 1 : flow chart
245 kidney transplantations 12/2015 – 07/2017 182 deceased kidney donor transplantations 63 living kidney donor transplantations 24 donors with predonation measured GFR 2 lost of follow up 4 recipients refusals 3 donors refusals 2 graft rejections 17 donors
25
2. Donors
1. Predonation donors’ characteristics
The donors’ characteristics are summarized in Table 1 and Figure 2. Median age was 61 years (range 53-70) and 45% were female. Of the total, 20% had hypertension, none had a history of kidney disease, proteinuria, diabetes mellitus or cardiovascular events. 15% were obese, median BMI was 27 (range 25-28). Although total kidney function of all donors was normal before donation, median creatinine was 75µmol/L (range 66-80) and e GFR (CKD-EPI formula) was 88ml/min/1.73m2 (range 82-95). Total donor m GFR, adjusted for donor BSA, ranged from 81 to 96ml/min/1.73m2 and the median was 87ml/min/1.73m2. Median m GFR for males was 87 and was 81ml/min/1.73m2 for females. Relative contribution of DMSA scintigraphy of the transplanted kidney to overall kidney function was 49% (range 48-51%). All patients had symmetric kidneys. Only one donor donated his right kidney, all others gave their left kidney for surgical reasons independently of GFR. skGFR of the remaining kidney was a little higher (at 1.5ml/min/1.73m2) compared to the donated kidney’s GFR, but this was not clinically significant. The median skGFR of the donated kidney was measured at 42ml/min/1.73m2 (range 39-48) and 43ml/min/1.73m2 from the CKD-EPI formula (range 40-47). The volume of the remaining kidney calculated on CT-scan was 130 cm3 (range 114-151), the median skGFR of the remaining kidney/volume was 0,34 ml/min/cm3(range 0.31-0.39). Few complications were reported, only one hemorrhage occurred during a donor nephrectomy, blood transfusions were not required. The median cold ischemia time was 79 min (range 70-110), as short as previously described in living kidney donor transplantation.
26
Table 1. predonation donor’s characteristics
age (years) 60 (53-70) female 45% BSA (m2) 1.86 (1.78-1.98) BMI 27 (25-28) hypertension 20% cardiac disease 0 diabete 0 renal function
serum creatinine (µmol/l) 75 (66-80) e GFR (CKD-EPI, ml/min/1.73m2) 88 (82-95) total m GFR (ml/min) 100 (92-113) total m GFR/donor BSA (ml/min/1.73m2) 87 (81-96) skGFR of the remaining kidney/donor BSA (ml/min/1.73m2) 42 (39-48) volume (cm3) 130 (114-151) DMSA uptake on scintigraphy of the transplanted kidney (%) 49 (48-51)
Table 1 : predonation donors characteristics, BSA : body surface area, BMI: body mass index, e GFR: estimated glomerular filtration rate, m GFR: measured glomerular filtration rate, skGFR: single kidney glomerular filtration rate. DMSA: dimercaptosuccinic acid. Continuous data are expressed with median (interquartile) and categorical data with percentage.
27 Figure 2 : Predonation donors characteristics. All data are normally distributed. skGFR : single kidney glomerular filtration rate.
2. Follow-up results
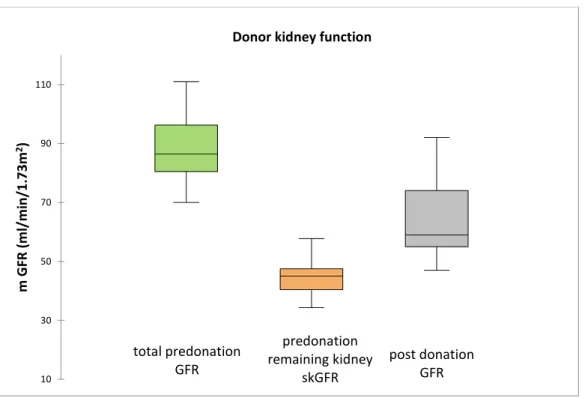
After nephrectomy, creatinine increased and GFR was reduced, as expected. At three months, median creatinine was at 116µmol/L (range 108-131) and e GFR was 50ml/min/1.73m2 (range 41-62). At one-year after nephrectomy, median creatinine was 108µmol/L (range 99-127) and e GFR was 53ml/min/1.73m2 (range 47-62). Median m GFR was 59ml/min/1.73m2 (range 55-74) (Figure3). Median measured functional gain at one-year was +20ml/min/1.73m2 (range 11-22) or +40% (12-94%) compared to the initial skGFR at predonation. Of the donors, 47% had a GFR superior at 60ml/min/1.73m2 and 53% had GFR between 45 and 60 ml/min/1.73m2 (theoretical chronic kidney disease, stage 3A). No donors had a mGFR <30 ml/min per 1.73 m2 (theoretical CKD stages 4 and 5). At one-year post transplantation, none had significant proteinuria (median 0.08g/L). 7 donors (35%) had controlled hypertension (all had systolic
0 0,5 1 1,5 2 2,5 3 3,5 4 4,5 5 30 40 50 60 70 80 90 N um be r o f d on or s Age (years) 0 1 2 3 4 5 6 7 70 120 170 220 N um be r o f d on or s
Volume of the remaining kidney (cm3)
0 0,5 1 1,5 2 2,5 3 3,5 4 30 35 40 45 50 55 60 N um be r o f d on or s Transplanted kidney skGFR (ml/min/1.73m2) 0 1 2 3 4 5 6 30 35 40 45 50 55 60 N um be r o f d on or s Remaining kidney skGFR (ml/min/1.73m2)
28
pressure <150mmHg and diastolic pressure <90 mmHg) but only 3 patients needed anti-hypertensive drugs. 2 patients took one medication and one had 3 treatments, one more than before the donation.
Figure 3: donor kidney function before and after donation. skGFR: single kidney glomerular filtration rate. In each plot, the boxes extend between the first and third quartiles, the line within the boxes represents the median value, and lower and upper whiskers extend between the minimum and maximum values.
3. Factors influencing donor functional gain
In the univariate analysis (Table 2), total m GFR and skGFR of the remaining kidney were positively correlated with the donor functional gain but the results were not statistically significant (R2=0.1 and 0.2 respectively, p= 0.6 and 0.5). Age and BMI were not statistically associated with graft function (R2= 0.1, 0.4 and p=0.5, 0.06 respectively). Donor kidney function was not correlated with the skGFR of the remaining kidney/volume (R2=-0.7, p=0.7).
total predonation GFR predonation remaining kidney skGFR post donation GFR 10 30 50 70 90 110 m G FR (m l/ m in /1 .7 3m 2)
29
Table 2. Association between donor functional gain and predonation variables Univariate analysis R2 p-value total m GFR(ml/min/1.73m2) 0.1 0.6 skGFR of the remaining kidney (ml/min/1.73m2) 0.2 0.5
age 0.1 0.5
BMI 0.4 0.06
skGFR of the remaining kidney/volume (ml/min/cm3) -0.72 0.7
Table 2 : univariate analysis, Pearson correlation (coefficient R2) between functional gain and
total GFR, skGFR, age, BMI and remaining kidney sk GFR/volume.
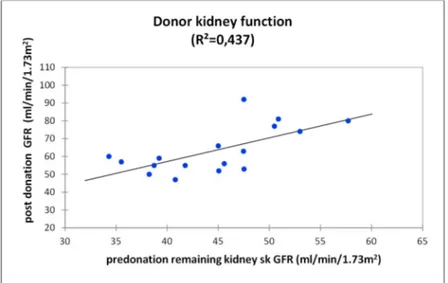
When we assessed renal function using linear regression, we found that higher skGFR was correlated with higher GFR after donation (R2=0.437 p=0.5) (Figure 4).
Figure 4: relationship between predonation skGFR of the remaining kidney and post donation GFR for donors using linear regression. R2=0.437 p=0.5
Multivariate analyses of age, BMI, total GFR, skGFR of the remaining kidney and sk GFR/volume were not statistically associated.
20 30 40 50 60 70 80 90 100 110 30 35 40 45 50 55 60 65 po st d on at io n G FR ( m l/ m in /1 .7 3m 2)
predonation remaining kidney sk GFR (ml/min/1.73m2)
Donor kidney function (R²=0,437)
30
3. Recipients
1. Baseline characteristics
Table 3 summarizes the baseline characteristics for recipients. Median age was 54 years (range 38-67) and median BMI was 24 (range 20-26). 50% of recipients were females. Glomerulonephritis was the main cause of ESRD (40%). Of the total, 71% had hypertension, 10% were diabetics, 57% have been dialyzed and 43% have received a transplant before starting dialysis. In addition, 80% had received induction immunosuppression of anti-thymocyte globulin whereas only 20% received basiliximab. For maintenance
immunosuppression, 50% received an association of tacrolimus, everolimus and prednisone and the remaining 50% were treated by tacrolimus, mycophenolate mofetil and prednisone. No surgical major complication was reported during transplantation. No acute rejection, death or graft loss occurred during the follow-up.
31
Table 3. recipients characteristics
age (years) 54 (38-67)
gender (female/male) 50%
BSA (m2) 1.73 (1.59-1.91)
BMI 24 (20-26)
hypertension 71%
underlying kidney disease
GN 40% DN 5% vascular nephropathy 10% pre-emptive transplantation 43% induction immunosuppression ATG 80% Basiliximab 20% mismatch HLA 4 (3-6) immunosuppression regimen tacrolimus+mycophenolate-mofetil 50% tacrolimus+everolimus 50%
Table 3 :recipients characterisitcs, BSA: body surface area, BMI: body mass index, GN: glomerulonephritis, DN: diabetic nephropathy, ATG: anti thymoglobuline, HLA: human leukocyte antigen. Continuous data are expressed with median and categorical data with percentage.
32 2. Follow-up results
Median creatinine at three months post transplantation was 110µmol/L (range 91-132) and e GFR was 56ml/min/1.73m2 (range 46-73). At one-year post transplantation, median creatinine was 120µmoL/l (range 105-135) and e GFR was 49ml/min/1.73m2 (range 43-64). Median m GFR using 51 Cr-EDTA clearance was 50ml/min/1.73m2 (range 46-56) (Figure 5).
Figure 5: recipients kidney function. In each plot, the boxes extend between the first and third quartiles, the line within the boxes represents the median value, and lower and upper whiskers extend between the minimum and maximum values.
total predonation GFR predonation transplanted kidney skGFR post donation GFR 10 30 50 70 90 110 m G FR (m l/ m in /1 .7 3m 2)
33
Patients receiving tacrolimus and everolimus achieved low dose of tacrolimus since the third month after surgery and at one-year post transplantation their median tacrolimus level was 3.7 (range 3-3.9) and median everolimus level was 5.7 µg/l (range 5.2-6). Those receiving tacrolimus+mycophenolate-mofetil had a median tacrolimus level of 6.2µg/L (range 5.9-7.2).
3. Factors influencing graft function
In the univariate analysis (Table 4, Figure 6), donor age and total m GFR at pre donation seemed to be predictive factors (R2= -0.2 et 0.2 respectively) but there was no significant correlation (p=0.4 and 0.4 respectively). However, skGFR was not correlated with graft function at one-year post transplantation (R2=0.09, p=0.7). Mean m GFR at one-year was better for female donor at 59 compared to 46ml/min/1.73m2 for male donor (p=0.2).
Table 4. Association between graft function at one-year and predonation variables Univariate analysis R2 p-value total m GFR(ml/min/1.73m2) 0.2 0.4 sk GFR of the transplanted kidney (ml/min/1.73m2) 0.09 0.7
age -0.2 0.4
Table 4 : Univariate analysis, Pearson correlation for m GFR (measured GFR), skGFR (single kidney GFR) and age
34
Figure 6 : Pearson correlation. A) predonation sk GFR of the transplanted kidney and graft GFR; B) predonation total m GFR and graft function, C) donor age and graft function
Recipients receiving a tacrolimus and everolimus immunosuppression regimen had a mean m GFR of 47ml/min/1.73m2, which was lower than for those received tacrolimus and mycophenolate-mofetil (53ml/min/1.73m2) but this was not statistically significant(p=0.4). We calculated a recipient “gain”, as the delta value between predonation sk GFR of the transplanted kidney and the skGFR post transplantation. Our results found a statistically significant difference between donor functional gain (18±10) and those of the recipients (7±16) (p=0.02). This finding might results from specific graft injuries (immunologic, ischemic,…) blocking compensatory mechanisms. In our study, patients that received everolimus were not associated with lower “graft gain” than those received tacrolimus+mycophenolate-mofetil (p=0.5). 0 1 2 3 4 5 6 20 30 40 50 60 lo g po st d on at io n sk G FR
A) transplanted kidney predonation skGFR (ml/min/1.73m2) R2=0.09, p=0.7 0 1 2 3 4 5 6 50 70 90 110 130 B) predonation total m GFR (ml/min/1.73m2) R2=0.2, p=0.4 0 1 2 3 4 5 6 30 50 70 90 C) age R2=-0.2, p=0.4
35
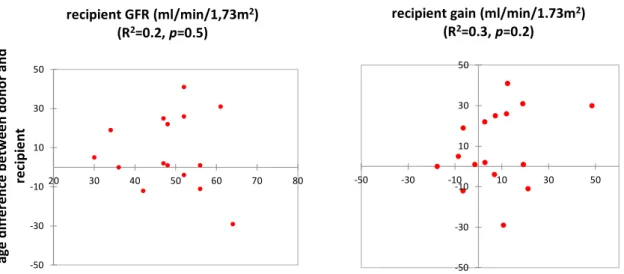
The donors age aforementioned was not associated with graft function (R2=-0.2, p=0,4) and we added in the analysis, the difference between donor age and recipient age, it was statistically non-significant. Great difference (parents who gave to children) was not associated with lower allograft GFR or lower recipient gain at one-year (R2=0.2 and 0.3, p=0.5 and 0.2, respectively). (Figure°7)
In multivariable linear regression, age, total GFR, skGFR of the transplanted kidney, gender and everolimus therapy were not significantly associated with graft function (p=0.5).
-50 -30 -10 10 30 50 -50 -30 -10 10 30 50
recipient gain (ml/min/1.73m2) (R2=0.3, p=0.2) -50 -30 -10 10 30 50 20 30 40 50 60 70 80 ag e di ff er en ce b et w ee n do no r a nd re ci pi en t recipient GFR (ml/min/1,73m2) (R2=0.2, p=0.5)
Figure 7 : Pearson correlation: age difference between donor and recipient influencing recipient GFR or recipient gain at one-year
36
4. DISCUSSION
Living kidney donor transplantation has been until now the main treatment for ESRD patients and has provided the best renal outcomes compared to deceased-donor kidney transplantation or remaining in dialysis. The aim for the transplant community is to reduce time on the waiting list, consequently, the number of “bordeline” living donors had increased. Good renal function in recipients and the long-term safety of donors are the two new challenges. The “bordeline” donor characteristics (i.e. old age, obesity, high blood pressure or low GFR) have been previously studied as graft function influencing factors. The new KDIGO recommendations report that we must select donors with a total GFR of > 90ml/min/1.73m2 (but it is not specified if this is e GFR or m GFR). These recommendations are traditionally designed to predict a good graft function but considerations about the donors are equally meaningful. Currently, ESRD risk calculators are available to all clinicians on a website to assess ESRD risk and to potentially help make a decision of weither to accept or decline a potential living donor (http://www.transplantmodels.com/esrdrisk).(14) This screening strategy, which uses ESRD risk calculators, was accepted in the 2017 KDIGO recommendations. Thus, evaluation of renal function is a cornerstone when assessing living donors to predict organ quality and to ensure the safety of donation. This study hypothesized that a lower sk GFR in the transplanted kidney predicted a worse renal allograft outcome and a lower sk GFR in the remaining kidney predicted a lower donor functional gain, however, our results were not statistically significant and thus do not confirm our hypotheses.
The merit of our study is its methodology. It was a prospective study that included all couples where the donors underwent predonation GFR measurements. We also took into account all other previously well-known influencing factors such as age, sex, BMI, total GFR or m GFR of
37
the remaining kidney/volume for the donors and the recipient’s use of everolimus. The follow-up lasted one year, and not only three months, to ensure that described compensatory mechanisms were fully achieved. Previous data confirm that functional gain is maximal after the first year and then remains stable.(18) We also avoided a main limitation found in many previous studies on renal function, the estimation of GFR using a formula that is known to underestimate m GFR.(10) All our selected patients were evaluated using a gold-standard exogenous marker, 51Cr-EDTA, to measure GFR before and after transplantation. The significant lower recipients graft “gain” after transplantation compared to donors ones could be explained by the greater specific graft injuries, such as immunologic attack or cold ischemia. Also, we chose to study the impact of two immunosuppression regimen. Although our results did not find a statistically difference between maintenance immunosuppression groups (p=0.5), neither everolimus+low dose of tacrolimus or high dose of tacrolimus+mycophenolate-mofetil had a negative impact on graft function. Indeed, the 2 aforementioned mechanisms which result in donor fonctional gain (increase in kidney volume and renal plasma flow) are related to immunosuppression drug. Everolimus is an anti-proliferative drug which interrupts the mTOR (mammalian target of rapamycin) intracellular signaling pathway, which is pivotal in multiple processes, including cell growth and proliferation, cellular metabolism, and angiogenesis. Everolimus could be negatively associated with graft function because the recipient m TOR pathway was inhibited and the transplanted kidney might fail to adapt to the increased metabolic demands in the recipients. In tacrolimus+mycophenolate-mofetil group, this may have been due to a higher anti-calcineurin inhibitors exposure (i.e. 3-5 µg/L vs 5-8 µg/L of tacrolimus), these higher levels result in afferent arterioles vasoconstriction involving in renal plasma flow decrease. Our results are reassuring because patients with new immunosuppression regimen with
38
everolimus+low dose of tacrolimus did not have lower gain than those with classic immunosuppression (tacrolimus+mycophenolate-mofetil).
Despite our attempts to define the impact of sk GFR, there were several limitations to our study. Firstly, the limited number of patients included and thus a lack of statistical power. Few donors had predonation 51Cr-EDTA clearance. Only those with a borderline predonation estimated GFR (≈90ml/min/1.73m2) were eligible for a measurement of GFR in our center. Secondly, our follow-up was not long enough, larger studies that show an association between predonation GFR and graft function have longer follow-up times (5 years or 10 years). Thirdly, our aim was to take into account the asymmetry of kidneys, but in our study no donor had asymmetric kidney in the scintigraphy results. In our population, we only selected patients amongst donors that actually donated a kidney and did not include all potential donors. When assessing eligibility, some were excluded because of asymmetry or because of a low GFR. It would be interesting to study donors that have >10% asymmetry and to measure their single-kidney GFR to assess if they could be accepted or not in the single-kidney-transplantation program. Overall, our findings are reassuring, all donors were strictly selected using accurate criteria to assess kidney function. Among the 20 donors, at predonation assessment, none had proteinuria or microalbuminuria, 20% had hypertension, 15% were obese (BMI>30) and none had diabetes mellitus. After one-year, we found that the most donors showed no change in symptoms after donation and three had developed new hypertension but without the need of treatment and among those who had predonation hypertension, only one were treated with one more drug than before donation.
We describe a usual donor functional gain of + 40% and skGFR of the remaining kidney did not correlate with functional gain. This is line with the results of Gaillard et al., who reported that
39
the lower predonation total m GFR in 2007 living donors (comparison between three groups of total m GFR<80, 80-89 or >90ml/min/1.73m2) did not predict a lower functional gain in GFR. The three groups had lost 30% of baseline GFR at 5 years post donation and had identical life-time risk of ESRD.(25) Secondly, our results also do not support the hypothesis of a “nephron mass” which posits that kidneys with a higher GFR have a larger “renal reserve“ and thus may have better renal function. Gaillard et al. in the same study determined life-time renal reserve (total m GFR divided by the number of expected remaining years of life) and found no difference in renal reserve between the three groups of baseline GFR.(25) Besides well-known factors, such as age, gender, predonation total and single kidney function, the use of the snGFR (single nephron GFR) is now being considered. The snGFR has been calculated as total GFR divided by the number of nephrons (calculated from cortical volume of both kidneys assessed on CT-scan and a renal biopsy determines glomerular density). snGFR does not change according to age, size or gender but only with the number of functional nephrons (26). After a nephrectomy, the number of functional nephron does not decrease in the remaining kidney and functional gain is related to glomerular hypertrophy. Gaillard and Courbebaisse et al. proposed that functional gain was linked to an increase in snGFR by increasing renal plasma flow and increasing hydrostatic pressure. Consequently, this could result in renal injury, named in animals models as “remnant kidney syndrom”.(27) This hypothesis was studied by Lenihan et al. who analyzed physiological parameters (ultrafiltration coefficient, hydrostatic pressure…) and found a post donation constant glomerular pressure, that did not lead to glomerular injury. The author conclude that donors are protected from the “remnant kidney syndrom” and that the increase of snGFR was attributed to an increased ultrafiltration coefficient.(18)
40
Our findings agree with the literature, the skGFR was measured using different methods, the gold standard is the scintigraphy, but CT-scan or currently MRI are exams of great interest.(28,29) However, scintigraphy remains expensive, time-consuming and is not available in all hospitals. It also exposes subjects to radiation.(30) Due to these limitations, CT-scan has been investigated as an alternative method to assess split renal function. Moreover, renal cortical volume reflects nephron endowment of the donor and is associated with an increased filtration surface and consequently, the greater ultrafiltration coefficient as described by Lenihan et al.(18) However, we chose to study the m GFR of the remaining kidney/volume, which was a priori directly correlated with functional gain. We did not find the same association, this was perhaps because of the lack of statistical power or because this variable takes into account total kidney volume and not only just cortical volume.
Another variable of interest was assessment of unilateral plasma flow (effective renal plasma flow or ERPF) using 99m-DTPA scintigraphy. Chang et al. used this as a proxy indicator for functioning renal mass in each kidney. They did not find correlation between high predonation ERPF and better graft function.(31) Until now, data on the influence of skGFR have been heterogeneous and are sometimes positively or not associated with renal outcome after transplantation either for the donors or recipients. Further multicentric and longer studies with greater number of patients are needed to determine the real role of accurate assessment of renal function especially, for skGFR.
41
5. CONCLUSION
In this time of high donor demand, living kidney donor transplantation is a good alternative to decrease the time on the waiting list, especially for end-stage-renal disease patients not yet in dialysis. It provides the best renal outcomes compared with either deceased donor kidney transplantation or remaining in dialysis.The donor predonation renal function is a cornerstone in donor choice because, according to the KDIGO 2017 recommendations, potential donors are excluded if total GFR is <60 mL/min/1.73 m2. In this context, accurate assessment of renal function using new variables, such as skGFR, are needed to predict good graft function and ensure safety of donation. Our prospective study has shown that the predonation measured skGFR of the transplanted kidney had no influence on renal allograft function at one-year post transplantation. Similarly, there was no association between measured skGFR of the remaining kidney and donor functional gain at one-year. Age, total GFR, BMI, volume of the kidney were not predictive factors for a change in renal function among living kidney donors or recipients. As expected, functional gain was significantly higher for donors than recipients without impact of recipient immunosuppression regimen. This study reassured about the donation, strict selection of donors, ensured a good functional gain. Acknowledging that donor and recipient outcomes were multifactorial, these results suggest further powerful studies are needed that use more detailed predonation screening to include variables such as donor snGFR or renal plasma flow... Of course, the safety of the donor must also remain a priority, particularly for younger donors.
43
6. BIBLIOGRAPHY
1. Young A, Kim SJ, Garg AX, Huang A, Knoll G, Prasad GVR, et al. Living kidney donor estimated glomerular filtration rate and recipient graft survival. Nephrol Dial Transplant. 2014 Jan 1;29(1):188–95.
2. Issa N, Stephany B, Fatica R, Nurko S, Krishnamurthi V, Goldfarb DA, et al. Donor Factors Influencing Graft Outcomes in Live Donor Kidney Transplantation: Transplantation. 2007 Mar;83(5):593–9.
3. Lezaic V, Naumovic R, Marinkovic J, Jaksic E, Djukanovic L. Donor Kidney Glomerular Filtration Rate and Post-Transplant Graft Function. Am J Transplant. 2004 Oct 1;4(10):1669–74.
4. Saxena AB, Busque S, Arjane P, Myers BD, Tan JC. Preoperative renal volumes as a predictor of graft function in living donor transplantation. Am J Kidney Dis Off J Natl Kidney Found. 2004 Nov;44(5):877–85.
5. Nordén G, Lennerling A, Nyberg G. Low absolute glomerular filtration rate in the living kidney donor: a risk factor for graft loss. Transplantation. 2000;70(9):1360–1362.
6. Poggio ED, Hila S, Stephany B, Fatica R, Krishnamurthi V, Del Bosque C, et al. Donor Kidney Volume and Outcomes Following Live Donor Kidney Transplantation. Am J Transplant. 2006 Mar 1;6(3):616–24.
7. Hawley CM, Kearsley J, Campbell SB, Mudge DW, Isbel NM, Johnson DW, et al. Estimated donor glomerular filtration rate is the most important donor characteristic predicting graft function in recipients of kidneys from live donors. Transpl Int Off J Eur Soc Organ Transplant. 2007
Jan;20(1):64–72.
8. Tent H, Rook M, Stevens LA, Son WJ van, Pelt LJ van, Hofker HS, et al. Renal Function Equations before and after Living Kidney Donation: A Within-Individual Comparison of Performance at Different Levels of Renal Function. Clin J Am Soc Nephrol CJASN. 2010 Nov;5(11):1960. 9. Rule AD, Gussak HM, Pond GR, Bergstralh EJ, Stegall MD, Cosio FG, et al. Measured and
estimated GFR in healthy potential kidney donors. Am J Kidney Dis Off J Natl Kidney Found. 2004 Jan;43(1):112–9.
10. van Londen M, Wijninga AB, de Vries J, Sanders J-SF, de Jong MFC, Pol RA, et al. Estimated glomerular filtration rate for longitudinal follow-up of living kidney donors. Nephrol Dial Transplant Off Publ Eur Dial Transpl Assoc - Eur Ren Assoc. 2018 Jun 1;33(6):1054–64. 11. Lentine KL, Kasiske BL, Levey AS, Adams PL, Alberú J, Bakr MA, et al. KDIGO Clinical Practice
Guideline on the Evaluation and Care of Living Kidney Donors: Transplantation. 2017 Aug;101:S7–105.
12. Goldfarb DA, Matin SF, Braun WE, Schreiber MJ, Mastroianni B, Papajcik D, et al. Renal outcome 25 years after donor nephrectomy. J Urol. 2001 Dec;166(6):2043–7.
13. Fehrman-Ekholm I, Elinder CG, Stenbeck M, Tydén G, Groth CG. Kidney donors live longer. Transplantation. 1997 Oct 15;64(7):976–8.
44 14. Grams ME, Sang Y, Levey AS, Matsushita K, Ballew S, Chang AR, et al. Kidney-Failure Risk
Projection for the Living Kidney-Donor Candidate. N Engl J Med. 2016 Feb 4;374(5):411–21. 15. Muzaale AD, Massie AB, Wang M-C, Montgomery RA, McBride MA, Wainright JL, et al. Risk of
end-stage renal disease following live kidney donation. JAMA. 2014 Feb 12;311(6):579–86. 16. Mjøen G, Hallan S, Hartmann A, Foss A, Midtvedt K, Øyen O, et al. Long-term risks for kidney
donors. Kidney Int. 2014 Jul;86(1):162–7.
17. Ibrahim HN, Foley R, Tan L, Rogers T, Bailey RF, Guo H, et al. Long-term consequences of kidney donation. N Engl J Med. 2009 Jan 29;360(5):459–69.
18. Lenihan CR, Busque S, Derby G, Blouch K, Myers BD, Tan JC. Longitudinal study of living kidney donor glomerular dynamics after nephrectomy. J Clin Invest. 2015 Mar 2;125(3):1311–8. 19. Courbebaisse M, Gaillard F, Tissier A-M, Fournier C, Le Nestour A, Corréas J-M, et al. Association
of mGFR of the Remaining Kidney Divided by Its Volume before Donation with Functional Gain in mGFR among Living Kidney Donors. Clin J Am Soc Nephrol CJASN. 2016 Aug 8;11(8):1369–76. 20. Fesler P, Mourad G, du Cailar G, Ribstein J, Mimran A. Arterial stiffness: an independent
determinant of adaptive glomerular hyperfiltration after kidney donation. Am J Physiol Renal Physiol. 2015 Mar 15;308(6):F567-571.
21. Lujan PR, Chiurchiu C, Douthat W, de Arteaga J, de la Fuente J, Capra RH, et al. CKD-EPI instead of MDRD for candidates to kidney donation. Transplantation. 2012 Sep 27;94(6):637–41. 22. Shokeir AA, Gad HM, el-Diasty T. Role of radioisotope renal scans in the choice of nephrectomy
side in live kidney donors. J Urol. 2003 Aug;170(2 Pt 1):373–6.
23. Gates GF. Split renal function testing using Tc-99m DTPA. A rapid technique for determining differential glomerular filtration. Clin Nucl Med. 1983 Sep;8(9):400–7.
24. Rodríguez Faba O, Boissier R, Budde K, Figueiredo A, Taylor CF, Hevia V, et al. European
Association of Urology Guidelines on Renal Transplantation: Update 2018. Eur Urol Focus. 2018 Mar;4(2):208–15.
25. Gaillard F, Courbebaisse M, Kamar N, Rostaing L, Bello AD, Girerd S, et al. The age-calibrated measured glomerular filtration rate improves living kidney donation selection process. Kidney Int. 2018 Sep 1;94(3):616–24.
26. Denic A, Mathew J, Lerman LO, Lieske JC, Larson JJ, Alexander MP, et al. Single-Nephron Glomerular Filtration Rate in Healthy Adults. N Engl J Med. 2017 Jun 15;376(24):2349–57. 27. Gaillard F, Courbebaisse M. Évaluation de la fonction rénale chez les donneurs vivants de rein.
Néphrologie Thérapeutique. 2018 Apr;14:S67–72.
28. Lange D, Helck A, Rominger A, Crispin A, Meiser B, Werner J, et al. Renal volume assessed by magnetic resonance imaging volumetry correlates with renal function in living kidney donors pre- and postdonation: a retrospective cohort study. Transpl Int Off J Eur Soc Organ Transplant. 2018;31(7):773–80.
45 29. Gardan E, Jacquemont L, Perret C, Heudes P-M, Gourraud P-A, Hourmant M, et al. Renal
cortical volume: High correlation with pre- and post-operative renal function in living kidney donors. Eur J Radiol. 2018 Feb;99:118–23.
30. Miyazaki C, Harada H, Shuke N, Okizaki A, Miura M, Hirano T. 99mTc-DTPA dynamic SPECT and CT volumetry for measuring split renal function in live kidney donors. Ann Nucl Med. 2010 Apr 1;24(3):189–95.
31. Chang S-S, Hung C-J, Lin Y-J, Chou T-C, Chung P-Y, Lin Y-S, et al. Association between preoperative allograft function (effective renal plasma flow) and the change in glomerular filtration rate among living-donor kidney transplant recipients. Transplant Proc. 2012 Jan;44(1):248–53.