TH `
ESE
TH `
ESE
En vue de l’obtention du
DOCTORAT DE L’UNIVERSIT ´
E DE TOULOUSE
D´elivr´e par : l’Universit´e Toulouse 3 Paul Sabatier (UT3 Paul Sabatier)
Pr´esent´ee et soutenue le 28/04/2017 par :
Jun ZHOU
Optimisation des proc´edures de d´epart et d’arriv´ee dans une zone terminale Optimal Design of SIDs/STARs in Terminal Maneuvering Area
JURY
HAMSABALAKRISHNAN Professeur Rapporteur
ADNANYASSINE Professeur Rapporteur
PIERREMARECHAL Professeur Examinateur
VALENTINPOLISHCHUK Professeur Examinateur
SONIACAFIERI Professeur Directeur de th`ese
MOHAMMEDSBIHI Enseignant-chercheur CoDirecteur de th`ese
´
Ecole doctorale et sp´ecialit´e :
MITT : Domaine Math´ematiques : Math´ematiques appliqu´ees Unit´e de Recherche :
Laboratoire ENAC Directeur(s) de Th`ese :
Sonia CAFIERIet Mohammed SBIHI Rapporteurs :
R´esum´e
L’objectif de cette th`ese est de proposer une m´ethodologie d’optimisation des routes de d´epart et d’arriv´ee dans une zone terminale autour d’un a´eroport, dite Terminal Maneuvering Area (TMA). En effet, les d´eparts d’un a´eroport se font suivant des routes, dites Standard Instrument Departure (SID), qui relient les pistes aux points de sortie de la TMA. Les arriv´ees sur un a´eroport se font suivant des routes, dites Standard Terminal Arrival Routes (STAR), qui relient les points d’entr´ee de la TMA aux pistes. La conception de ces SID/STAR s’inscrit dans le cadre de la conception de l’espace a´erien, qui est un probl`eme tr`es critique, `a cause notamment des pr´evisions de forte croissance du trafic a´erien et de la congestion qui en r´esulte.
Selon diff´erentes ´etudes, le trafic a´erien mondial va subir une croissance de 4 `a 5% par an au cours des 20 prochaines ann´ees. Cette forte augmentation aura comme cons´equence la saturation de l’espace a´erien, particuli`erement celui entourant les a´eroports. Pour faire face `a cette augmen-tation du trafic, de nouveaux a´eroports et/ou pistes peuvent ˆetre construits. Cependant, ce type de solutions conduit habituellement `a des coˆuts et `a des d´elais de construction ´elev´es. La con-ception efficace des routes SID/STAR constitue alors un autre levier pour augmenter, `a moindre coˆut, la capacit´e des TMA, et ainsi r´eduire la congestion autour des a´eroports. Dans cette optique, cette th`ese s’int´eresse au probl`eme de conception optimale des SID/STAR, en prenant en compte la configuration et l’environnement autour des a´eroports, et les diff´erentes contraintes op´erationnelles sous-jacentes. L’´evitement des obstacles et la s´eparation des routes en constituent les contraintes principales.
Nous proposons une formulation math´ematique conduisant `a un probl`eme d’optimisation com-binatoire, ainsi que des m´ethodes de r´esolution ad hoc efficaces pour le probl`eme. Dans notre approche, une route est mod´elis´ee en 3D par deux ´el´ements: une courbe dans le plan horizontal, form´ee par une succession d’arcs de cercles et de segments, et un cˆone associ´e dans le plan vertical, contenant tous les profils de mont´ee (ou de descente) des vols sur cette route. Quant aux obstacles, ils sont mod´elis´es par des cylindres.
Pour la r´esolution du probl`eme, nous proc´edons en deux ´etapes. Nous consid´erons dans un pre-mier temps la conception d’une route de longueur minimale ´evitant les obstacles. Nous proposons une approche d’optimisation globale d´eterministe, bas´ee sur une m´ethode de type Branch and Bound (B&B). Dans ce B&B, les strat´egies de branchement sont li´ees `a la forme des routes et aux mani`eres d’´eviter des obstacles (contournement dans le sens horaire ou anti-horaire, ou imposition d’un palier sous un obstacle dans le plan vertical).
Dans un deuxi`eme temps, nous nous int´eressons `a la conception de plusieurs routes. Dans ce cas, la difficult´e principale est d’assurer la s´eparation des routes. Nous proposons deux approches pour y faire face. Dans la premi`ere approche, bas´ee sur la m´ethode B&B d´evelopp´ee pour une route, nous construisons les routes s´equentiellement suivant un ordre fix´e `a l’avance (par exemple, suivant la charge du trafic). Plus pr´ecis´ement, nous construisons d’abord les routes individuellement `a l’aide de la m´ethode de B&B, d´efinie pr´ec´edemment. Ensuite, les routes sont d´evi´ees localement autour des zones de conflit (zones o`u les routes ne se sont pas s´epar´ees). Pour effectuer la d´eviation des
routes, des obstacles fictifs cylindriques enveloppant les zones de conflits sont introduits et ensuite ´evit´es `a l’aide de la m´ethode B&B d´efini pr´ec´edemment. Comme les routes obtenues par cette approche d´ependent fortement de l’ordre de construction des routes, nous proposons une seconde approche utilisant le recuit simul´e pour construire les routes simultan´ement. Des obstacles fictifs cylindriques sont aussi introduits, pour envelopper les zones de conflit, et ensuite ´evit´es suivant des strat´egies s´electionn´ees al´eatoirement dans la m´ethode de recuit simul´e.
Notre approche est valid´ee sur un ensemble de probl`emes tests g´en´er´es artificiellement et sur des probl`emes correspondants `a des TMA existantes (Paris CDG et Zurich). Dans le premier en-semble de probl`emes tests, diverses configurations de TMA (nombre et disposition des obstacles, pistes, positions des points d’entr´ee et de sortie de TMA) sont consid´er´ees. Les routes obtenues sont continues et lisses, adapt´ees aux op´erations de mont´ee continue (CCO) et aux op´erations de descente continue (CDO). Dans les tests effectu´es sur des TMAs r´eelles, le choix de Paris CDG et de Zurich a permis de confronter notre approche, d’une part, `a une TMA comportant de nombreux points d’entr´ee/sortie, et d’autre part, `a une TMA comportant de nombreux obstacles. Les r´esultats montrent une r´eduction de la longueur totale des routes par rapport aux SID/STAR publi´ees, ce qui est int´eressant du point de vue de la r´eduction de la consommation de carburant. Par ailleurs, les tests sur la TMA de Zurich montrent que notre approche peut ˆetre appliqu´ee efficacement en pr´esence de nombreux obstacles, comme les montagnes entourant l’a´eroport de Zurich.
Abstract
The objective of this thesis is to propose a methodology for the optimization of departure and arrival routes in the airspace surrounding airports, named Terminal Maneuvering Area (TMA). The air traffic departing from and arriving to airports follows pre-designed routes named Standard In-strument Departure (SID) routes, that connect the runways to the TMA exit points, and Standard Terminal Arrival Routes (STAR), that connect the TMA entry points to the runways. The design of SIDs/STARs falls into the area of airspace design problems, that are very critical, mainly due to the predictions of air traffic growth and the consequent traffic congestion.
In fact, according to several studies, the world-wide air traffic is projected to grow 4 to 5 percent annually in the next 20 years. This sharp increase leads directly to the capacity insufficiency of the airspace surrounding airports. In order to adapt the capacity of TMAs to the increased traffic demand, new airports and runways can be constructed. However, this kind of solution usually leads to high construction costs and long construction times. Designing SIDs/STARs more efficiently is another possible way to increase the capacity of TMA airspace, and so to reduce the congestion around airports. In this thesis we propose an optimal design of SIDs/STARs, taking into account the configuration and environment around airports, and the related operational constraints, in particular the avoidance of obstacles and the separation between routes.
We propose a mathematical formulation leading to a combinatorial optimization problem, as well as efficient ad hoc resolution methods for the problem. More precisely, each route is modeled in 3D, consisting of two components: a curve in the horizontal plane which is composed by a succession of arcs of circles and segments, associated with a cone in the vertical plane that contains all ascent (or descent) profiles of the aircraft flying on this route. Moreover, the obstacles as well as their protection area are modeled in cylinder shape.
This route design problem is solved in two steps. In the first step, we deal with the design of one optimal route avoiding obstacles with respect to minimum route length. We propose a deterministic global optimization approach based on a Branch and Bound (B&B) method. In this B&B, the branching strategies are related to the form of a route, and are tailored to the ways the obstacles are avoided (bypassing clockwise or counter-clockwise, or imposing a level flight below an obstacle in the vertical plane).
In the second step, the problem of designing multiple routes is considered. The main difficulty in this case is to ensure the pairwise separation between routes. We propose two approaches to deal with the design of multiple routes. The first is a B&B-based approach, where routes are generated sequentially in a given order (for example, in a decreasing order of the traffic load). We first build routes individually using the B&B method defined previously. Then, the routes are deviated locally around the conflicting zones (zones where routes lose the minimum separation norm). In order to carry out the route deviation, fictitious obstacles in cylinder shape enveloping the conflicting zones are introduced, and then avoided by using the B&B. The quality of a solution provided by the B&B-based approach depends on the routes generation order. Thus another method building routes simultaneously is proposed, that is the Simulated Annealing (SA) method. Fictitious obstacles in
cylinder shape are also introduced to envelop conflicting zones, and their avoidance strategies are randomly selected in the SA method.
Our approach is validated on a set of artificially generated problems as well as on two problems corresponding to existing TMAs (Paris CDG and Zurich). Concerning the first set of test problems, several configurations of TMA (number and layout of obstacles, runways, positions of the TMA entry/exit points) are considered. We show that we obtain continuous and smooth routes which are suitable for Continuous Climb Operation (CCO) and Continuous Descent Operation (CDO). Concerning the tests performed on real data, the choice of the TMAs of Paris CDG and Zurich allows us to test our approach, on the one hand, on a TMA with numerous TMA entry/exit points, and on the other hand, on a TMA with many obstacles. The simulation results show a gain in the total route length compared with the published standard charts, that can be promising in terms of reducing jet fuel consumption. Furthermore, tests on the TMA of Zurich show that our approach can be applied effectively in a TMA in the presence of several obstacles, such as the mountains surrounding the Zurich airport.
Acknowledgements
I would like to take this chance to express my sincere thanks to the people who have guided and helped me to accomplish my dissertation, as well as to the people who have supported me and shared the pleasant time during my PhD study. Because of you, I could have learned a lot of things in the professional area and got so many shining memories.
First of all, I wish to give my deepest gratitude to my supervisors, Sonia Cafieri and Mohammed Sbihi, for their excellent guidance, caring and encouragements. They not only taught me vast math-ematical knowledge, but also showed me the correct way of working, always be rigorous, be active and be patient. Their advice on both research and on my career have been invaluable. I would also like to thank Daniel Delahaye, for accepting me into the optimization group and being my advisor during my internship. He always provided me guidelines and inspired me with new ideas whenever I got lost in the research. I was fortunate to have the chance to work with them and I hope that we can continue to collaborate in the future.
Many thanks also to my committee members for their interest in my work. Thanks to the reporters, Hamsa Balakrishnan and Adnan Yassine, for their precious advice and feedback that were helpful to improve my manuscript and presentation. Thanks to the examiners, Pierre Mar´echal and Valentin Polishchuk, for all the interesting discussions during and after my defense, as well as for their precise remarks that inspired me to ameliorate my current work. Thank you all for letting my defense be an enjoyable moment.
My deep appreciation goes out to my university, the Civil Aviation University of China (CAUC), especially to my institute, the Sino-European Institute of Aviation Engineering (SIAE), for selecting me to study in France, and providing me the scholarship through the collaboration with China Scholarship Council (CSC) during the 5 years and a half (including 2 years of engineering study). Thanks for giving me such an excellent opportunity to expand my view and experience a totally different and attractive culture.
I greatly acknowledge Serge Roux for all the helps and supports that he provided. Thanks for resolving the infinite problems of my computer, teaching me to use Xtraj and Gnuplot, helping me to generate nice videos to illustrate the results, as well as developing the interface to visualize the route design. There are so many things that I could not have accomplished without him.
My grateful thanks also goes out to Ji Ma. Thanks for accompanying me during my depression days and bringing me the joy with her sense of humor. She could not have realized how important that meant to me. Also thank her for sharing so many unforgettable memories with me during our trips to Portugal, Spain and Switzerland. I am also very thankful to Tambet Treimuth, for helping me dealing with the problems of Java and explaining me the algorithms. I also thank him for taking charge of the massive labor that I distributed to him in order to prepare the party after my defense.
I wish equally to thank other members in the Z-building. Thanks to St´ephane Pueshmorel for his help to efficiently provide the documents for my PhD inscription every year. Thanks to Marcel Mongeau for giving us good advice in the selection of journal. Thanks to Alana Moore for interesting discussions and feedback on the manuscript for publication. Thanks to Gilles Baroin for
his help in formatting the figures for publication. Thanks to Andrija Vidosavljevic for his useful and professional suggestions after the repetition of my defense which helped a lot to improve my presentation.
I would also like to say a heartfelt thank you to other PhD students, for bringing me so many happy and wonderful moments. Thanks to Romaric Breil for inviting us constantly for a coffee break, and organizing the PhD students for a dinner together from time to time. Thanks to Man Liang for the interesting discussions that provide me some guidelines for my future work. Thanks to Arianit Islami for bringing the delicious chocolates, providing me the priceless slides in the ATM domain, and sharing me his working experience. Thanks to Ruixin Wang for inviting me to jogging and helping me sending my packages back to China. Thanks to Paolo Scala for his sense of humor and sharing the picnic at Pech David. Thanks to Florian Mitjana for organizing the seminars among PhD students. Also thanks to him for scaring me from time to time when I was sleepy, this was a good way to wake me up. Thanks to Ning Wang for sharing with me the experience to come to France at the first time. Thanks to Isabelle Santos for teaching me piano and taking me for a pleasant flight. Thanks to Imen Dhief for sharing the delicious dessert and her culture. Thanks to Vincent Courjault-Rad´e for practicing chinese and enjoying the chinses snacks. Thanks to Marina Sergeeva and Cl´ement Bouttier for our splendid visit to Marseille during the conference ROADEF2015. Thanks to Karim Legrand for the long discussion on the route design problem and giving me many advice from the professional point of view. Thanks to J´er´emie Chevalier for the interesting discussion and the precise remarks on my manuscript.
I greatly appreciate some graduated PhD students for helping me to adapt to the environment and making good examples for me. Thanks to Supatcha Chaimatanan for all the interesting chats when we were office-mate and the patient discussion to explain me her method, also for bring me so many tasty Thai food. Thanks to Olga Rodionova for making delicious salad for our picnic and visiting Montreal together during the conference Cors/Informs2015. Thanks to Brunilde Girardet for explaining me the Fast Marching Method during my internship and providing me her Java code. Thanks to Laureline Guys for preparing the delicious pancakes. A special thank you goes out to Daichi Toratani for his positive altitude to everything and for his excellent guidance to visit Tokyo. Finally, I would like to specially acknowledge my boyfriend and my family. I am grateful for their love, sacrifice and tolerance. Thanks for always believing in my abilities and encouraging me during the challenging period. Words can not express how grateful I am to them.
To anyone that I may have forgotten. I apologize and thank you as well. I wish a bright future to you all.
Contents
R´esum´e 3 Abstract 5 Acknowledgements 7 Contents 10 List of Figures 15 List of Tables 18 Abbreviations 19 Introduction 21 1 Problem Context 251.1 Current Air Traffic Management (ATM) system and its future trends . . . 25
1.2 Controlled airspace and Air Traffic Service (ATS) route . . . 29
1.3 Departure and arrival routes in Terminal Maneuvering Area (TMA) . . . 32
1.4 Optimization problems and methods . . . 34
1.5 Objectives and contributions of this thesis . . . 40
2 Literature Review 43 2.1 Path planning methods . . . 43
2.1.1 Roadmap based methods . . . 44
2.1.2 Path shape based methods . . . 47
2.2 Route design in ATM . . . 51
2.2.1 Route design in 2D . . . 52
2.2.2 Route design in 3D . . . 54
2.3 Related problem of trajectory planning . . . 57
2.4 Conclusion . . . 58
3 Problem Modeling 61 3.1 Input data . . . 61
3.2 Obstacle and route modeling . . . 61
3.2.1 Obstacle modeling . . . 62
3.2.2 Route modeling . . . 64
3.3.1 Decision variables . . . 66
3.3.2 Constraints . . . 67
3.3.3 Objective function . . . 71
3.4 Conclusion . . . 71
4 Designing One Route Using Branch and Bound 73 4.1 Building one route . . . 73
4.1.1 Building a horizontal curve γiH . . . 73
4.1.2 Building a vertical cone γiV . . . 75
4.2 Designing one optimal route using Branch and Bound (B&B) . . . 77
4.2.1 Branching strategy . . . 78
4.2.2 Lower bound computation . . . 81
4.2.3 B&B tree exploration strategies . . . 82
4.2.4 Step-by-step illustration . . . 83
4.3 State space reduction by using convex hull filter . . . 83
4.4 Simulation results . . . 85
4.5 Conclusion . . . 93
5 Designing Multiple Routes 95 5.1 Conflict detection method . . . 95
5.1.1 Horizontal detection . . . 95
5.1.2 Vertical detection . . . 97
5.2 B&B-based approach . . . 97
5.2.1 Overview of the method . . . 97
5.2.2 Clustering conflicting cells and generating fictitious obstacles . . . 98
5.2.3 Route deviation strategies . . . 100
5.2.4 Step-by-step illustration . . . 105
5.3 Simulated Annealing (SA) approach . . . 108
5.3.1 Description of the method . . . 108
5.3.2 Step-by-step illustration . . . 110
5.4 Conclusion . . . 111
6 Simulation Results 113 6.1 Description of the simulation context (parameters, color legend and symbols) . . . 113
6.2 Artificially generated problems . . . 115
6.2.1 Test 1, generation of 1 SID and 1 STAR, with 6 obstacles (N=2, M=6) . . . 115
6.2.2 Test 2, generation of 2 SIDs and 3 STARs, with 9 obstacles (N=5, M=9) . . 120
6.3 Design of multiple routes in the TMA of Paris CDG airport . . . 123
6.4 Design of multiple routes in the TMA of Zurich airport . . . 136
6.5 Conclusion . . . 143
Conclusions and Perspectives 149
List of Figures
1 Global air routes network1. . . 21
2 Flight demand excess over airport capacity in Europe in 2035 (source [1]). . . 22
1.1 Radius-to-Fix illustration (source: [2]). . . 27
1.2 A comparison of conventional, RNAV and RNP routes. . . 27
1.3 PBN applied in different flight phases (unit in NM)2. . . 28
1.4 Airspace with specific restriction. (a) Danger area. (b) Restricted area. (c). Prohib-ited area. . . 29
1.5 Principal phases of a flight. . . 30
1.6 Controlled airspace structure. . . 31
1.7 An example of ATS routes. . . 31
1.8 An example of the TMA of the Paris region. . . 32
1.9 TMA entry/exit points. . . 33
1.10 Standard separation norm in a TMA. . . 34
1.11 A STAR chart of New Zealand Queenstown airport3. . . 35
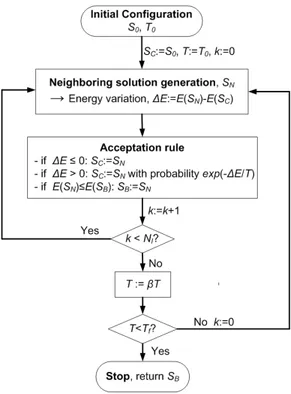
1.12 B&B flow chart. . . 37
1.13 An example of the A* algorithm. The value in the brackets after each node denotes the heuristic cost of that node. . . 39
1.14 Simulated Annealing flow chart. . . 40
2.1 An example of the Visibility Graph in 2D. . . 44
2.2 An illustration of the convex hull filter in [3]. . . 45
2.3 Voronoi diagram in a 2D polygonal environment4. . . 45
2.4 Cell Decomposition in a 2D polygonal environment. (a) Environment subdivision into small regions. (b) The corresponding connectivity graph. (c) A conflict-free path. 46 2.5 An example of Lagrange interpolating polynomial. . . 48
2.6 An example of piecewise linear interpolation. . . 48
2.7 An example of B´ezier curve. . . 49
2.8 An illustration of Ni,pof degree 0, 1, 2, and 3. . . 50
2.9 An example of Dubins path. . . 51
2.10 Hazardous weather modeling in [4]. . . 52
2.11 An example of a path bypassing two obstacles in [5]. . . 53
2.12 An example of multi-routes in [6]. . . 54
2.13 Node expanding in [7]. . . 55
2.14 Route deviations in [8]. (a) Deviation in the horizontal plane. (b) Deviation in the vertical plane. . . 56
3.2 Relative position between two disks. (a) Disjoint disks. (b) Externally tangent disks. (c) Overlapped disks. (d) One disk is completely included in another. The external
(respectively, internal) common tangents are in blue (respectively, black) color. . . 63
3.3 Two cylinders separated in 3D, while the projection of one cylinder is included in the projection of the other. (a) Illustration of two obstacles Ωj and Ωk. (b) Illustration of obstacle Ωl enveloping Ωj and Ωk. . . 64
3.4 Examples of γγγiH and γγγiV. . . 65
3.5 Take-off and landing profiles in CDG airport. (a) Take-off profiles. (b) Landing profiles. . . 65
3.6 An example of a TMA in a circular shape. . . 65
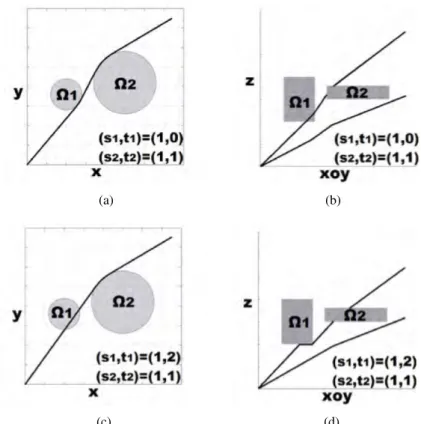
3.7 The routes associated with different values of the decision variables. (a) si j= 0, 3D View. (b) (si j,ti j) = (1, 0), 2D View. (c) (si j,ti j) = (1, 1), 2D View. (d) (si j,ti j) = (1, 2), 3D View. . . 67
3.8 Standard separation norm in a TMA. . . 68
3.9 Buffer obstacle illustration. . . 69
3.10 A runway in the Cartesian Coordinate System. . . 70
3.11 Different buffer obstacle configurations. CW is clockwise for short, CCW is counter-clockwise for short. . . 71
4.1 Obstacle numbering. . . 74
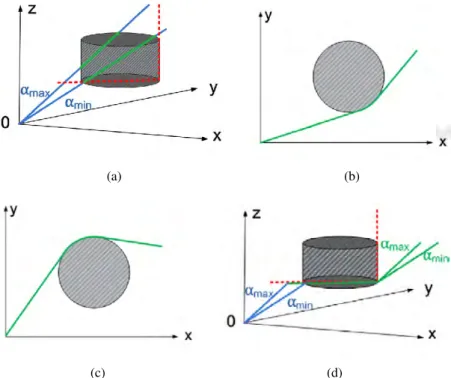
4.2 Different cases of computing the tangent points. (a) Case of the buffer obstacle. (b) Case of two disjoint obstacles. (c) Case of two externally tangent obstacles. (d) Case of two overlapped obstacles. (e) Case of the last active obstacle avoided by a turn. In the notation [ti,k] (and in [ti,k,ti,k+1]), ti,kindicates the bypassing direction of obstacle Ωk on γi. . . 74
4.3 Checking intersection between γiH and Ωjin the horizontal plane. . . 75
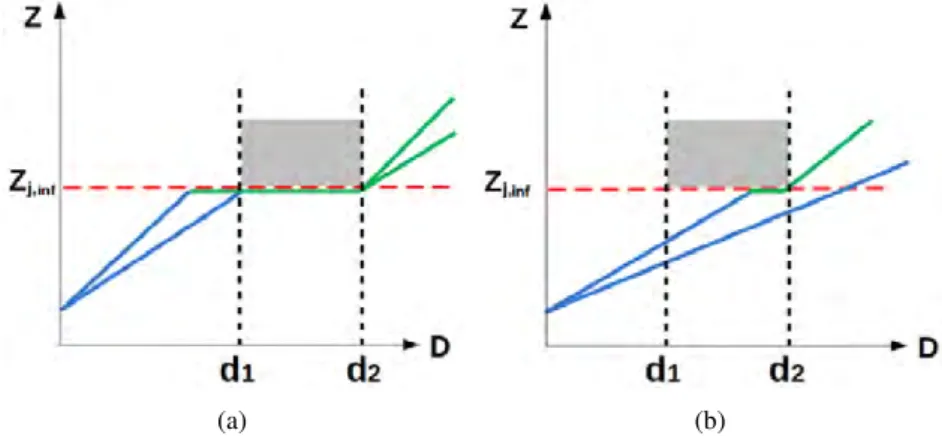
4.4 Checking intersection between γiV and Ωj in the vertical plane. (a) Checking inter-section at d1. (b) Checking intersection at d2. . . 77
4.5 Imposing level flight under obstacle. (a) Imposing level flight to both the lower and the upper bounds of the cone. (b) Imposing level flight only to the upper bound of the cone. . . 77
4.6 Routes construction. (a) Case 1, horizontal plane. (b) Case 1, vertical plane. (c) Case 2, horizontal Plan. (d) Case 2, vertical Plan. Note that in (b) and (d), slopes appear discontinuous as an effect of a projection of a 3D image on a plane. . . 78
4.7 Branch and Bound branching strategy in our method. . . 78
4.8 A level flight becomes feasible in further branching. . . 80
4.9 An example of a definitely unfeasible level flight. . . 81
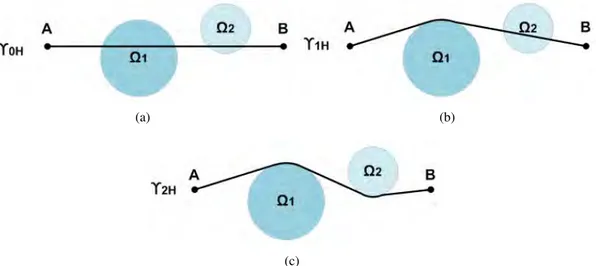
4.10 General case of computing the lower bound in the horizontal plane. (a) Illustration of γ0H. (b) Illustration of γ1H. (c) Illustration of γ2H. . . 81
4.11 An exception of computing the lower bound in the horizontal plane. (a) In the father branch, the arc on Ω2 corresponds to a central angle greater than 180◦. (b) In the son branch, the arc on Ω2corresponds to a central angle lower than 180◦. . . 82
4.12 Branch and Bound illustration. . . 84
4.13 An example illustrating that the shortest path lies in the convex hull. . . 85
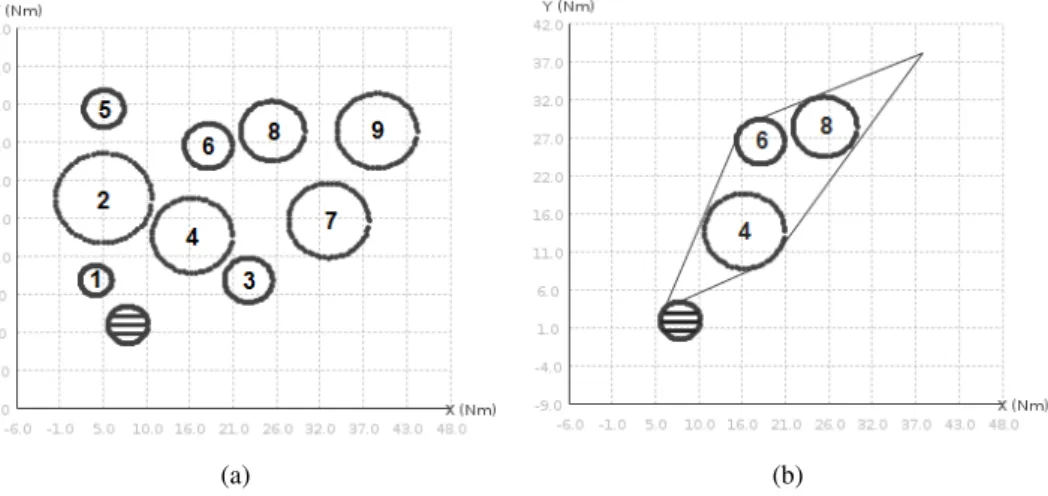
4.14 Test 1, obstacles illustration. (a) Buffer obstacle (striped) and 9 obstacles. (b) 3 remaining obstacles after using CVH-filter. . . 87
4.15 Test 1, simulation results. (a) γH when c1= 1, c2= 0. (b) γV when c1= 1, c2= 0.
(c) γH when c1= 1, c2= 0.05. (d) when c1= 1, c2= 0.05. (e) γH when c1= 1,
c2= 1. (f) γV when c1= 1, c2= 1. . . 88
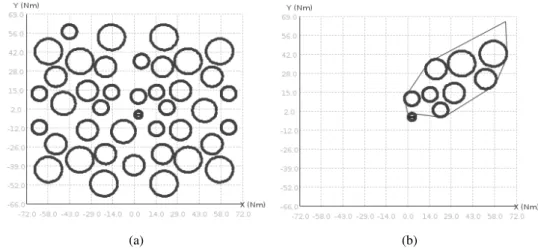
4.16 Test 2, obstacles illustration. (a) Buffer obstacle (striped) and 40 input obstacles. (b) 8 remaining obstacles after using CVH-filter. . . 90 4.17 Test 2, simulation results. (a) γH when c1= 1, c2= 0. (b) γV when c1= 1, c2= 0.
(c) γHwhen c1= 1, c2= 1. (d) γV when c1= 1, c2= 1. . . 91
4.18 Test 3, obstacles illustration. (a) Buffer obstacle (striped) and 18 input obstacles. (b) 10 remaining obstacles after using CVH-filter. . . 91 4.19 Test 3, simulation results. (a) γH when c1= 1, c2= 0. (b) γV when c1= 1, c2= 0.
(c) γHwhen c1= 1, c2= 1. (d) γV when c1= 1, c2= 1. . . 93
5.1 An example of horizontal conflict detection. (a) Illustration of horizontal curve discretization. (b) Illustration of horizontal conflict detection. . . 96 5.2 An example of vertical conflict detection. (a) A horizontal violation occurs between
curve sections γik,k+1 and γjl,l+1. (b) Detection of the vertical violation. . . 97
5.3 An example of clustering violated cells and creating fictitious obstacles. (a) Illus-tration in the horizontal plane. (b) IllusIllus-tration in 3D. . . 98 5.4 Configuration of the smoothing obstacles. . . 102 5.5 Route deviation in the horizontal Plan. (a) Turn counter-clockwise around the
ficti-tious obstacle. (b) Turn clockwise around the fictificti-tious obstacle. . . 102 5.6 Route deviation in the vertical plane. (a) Case 1, when the second intersection point
is located on an arc. (b) Case 2, when the second intersection point is located on a segment. . . 104 5.7 Step-by-step illustration. . . 107 5.8 An example of generating neighboring solutions in the SA algorithm. (a)
Itera-tion 1, current soluItera-tion SC and the generated fictitious obstacles. (b) Iteration 1,
neighboring solution SN. (c) Iteration 2, current solution SC and the generated
fic-titious obstacles. (d) Iteration 2, clustering ficfic-titious obstacles associated with γ1new. (e)Iteration 2, neighboring solution SN. . . 110
6.1 Test 1: routes generated independently by B&B and initial conflicting area (orange circle) (a) Illustration in 2D. (b) Illustration in 3D. . . 116 6.2 Test 1: B&B-based method simulation results. (a) SID generated before STAR, final
result. (b) STAR generated before SID, final result. (c) SID generated before STAR, illustration of fictitious and smoothing obstacles. (d) STAR generated before SID, illustration of fictitious and smoothing obstacles. (e) SID generated before STAR, illustration in 3D.(f) STAR generated before SID, illustration in 3D. . . 117 6.3 Test 1: SA method simulation result, the routes with the least total routes length. (a)
Illustration in 2D. (b) Fictitious obstacle for imposing level flight. (c) Illustration in 3D. (d) Vertical profile of the STAR. . . 119 6.4 Test 1: another solution of the SA method. (a) Illustration in 2D. (b) Illustration in
3D. . . 119 6.5 Test 2: routes generated independently by B&B and initial conflicting areas (orange
circles). (a) Illustration in 2D. (b) Illustration in 3D. . . 121 6.6 Test 2: B&B-based method simulation results. (a) Optimal routes illustration in 2D.
(b) Deviation of γ2. (c) Preservation of route γ3. (d) Deviation of γ4. (e) Deviation
6.7 Test 2: B&B-based method simulation results, illustration in 3D. . . 123
6.8 Test 2: SA method simulation result. (a) Optimal routes, illustration in 2D. (b) Fictitious obstacles for route deviation. (c) Optimal routes, illustration in 3D. (d) Vertical profile of γ1. (e) Vertical profile of γ3. (f) Vertical profile of γ4. . . 124
6.9 Paris CDG airport configuration. (a) Four parallel runways. (b) Buffer obstacles and a real obstacle. . . 125
6.10 One day radar data of Paris CDG airport, and principal SIDs and STARs. . . 126
6.11 Test Paris CDG airport: routes generated independently by B&B and initial con-flicting areas (orange circles). (a) Illustration in the horizontal plane. (b) Illustration of γ4, γ9, γ12and γ15in 3D. (c) Illustration of γ3, γ5and γ6in 3D. . . 129
6.12 Test Paris CDG airport: B&B-based method simulation results. (a) Illustration in the horizontal plane. (b) Comparison with standard routes. (c) Illustration of γ4, γ9, γ12and γ15. (d) Illustration of γ15in the vertical plane. (e) Illustration of γ3, γ5 and γ6. (f) Illustration of γ6in the vertical plane. . . 131
6.13 Test Paris CDG airport: SA method simulation result, the routes with the least total routes length. (a) Optimal routes illustration in the horizontal plane. (b) Comparison with standard routes. . . 132
6.14 Test Paris CDG airport: SA method simulation result, the routes with the least total routes length. (a) Fictitious obstacles for route deviation. (b) Illustration of γ4, γ9, γ12and γ15. (c) Illustration of γ4in the vertical plane. (d) Illustration of γ15 in the vertical plane. (e) Illustration of γ3, γ5 and γ6. (f) Illustration of γ6in the vertical plane. . . 133
6.15 Test Paris CDG airport: SA method simulation results. (a) Optimal routes illustra-tion in the horizontal plane. (b) Comparison with standard routes. . . 134
6.16 Test Paris CDG airport: SA method simulation results. (a) Fictitious obstacles for route deviation. (b) Illustration of γ4, γ9, γ12 and γ15. (c) Illustration of γ4 in the vertical plane. (d) Illustration of γ15in the vertical plane. (e) Illustration of γ3, γ5 and γ6. (f) Illustration of γ6in the vertical plane. . . 135
6.17 Zurich airport configuration. (a) Three runways. (b) Buffer obstacles. . . 136
6.18 Radar minimum altitudes in the TMA of Zurich airport (source:[9]). . . 137
6.19 Obstacles modeling in the TMA of Zurich airport, illustration in 2D. . . 138
6.20 Obstacles modeling in the TMA of Zurich airport, illustration in 3D. . . 138
6.21 Selected standard routes, SIDs in blue color, STARs in red color. . . 139
6.22 Building route γ7 (a) Simulation result of γ7by using the B&B independently. (b) Simulation result of γ7after adding the fictitious obstacle corresponding to the IAF (in green color). . . 141
6.23 Test Zurich airport: routes generated independently by B&B and initial conflicting areas (orange circles). (a) Illustration in the horizontal plane. (b) Illustration of γ4 and γ6in 3D. (c) Illustration of γ1and γ7in 3D. (d) Illustration of γ2, γ7and γ9in 3D. 142 6.24 Test Zurich airport: B&B-based method simulation results. (a) Illustration in the horizontal plane. (b) Illustration of γ4 and γ6 in 3D. (c) Illustration of γ6 in the vertical plane. (d) Illustration of γ1, γ2 and γ7 in 3D. (e) Illustration of γ7 in the vertical plane. . . 144
6.25 Comparison between simulation result and selected routes in the horizontal plane. . 145
6.26 Test Zurich airport: SA method simulation results. (a) Illustration in the horizontal plane. (b) Fictitious obstacles for route deviation. (c) Illustration of γ1, γ2, γ7and γ9 in 3D. . . 146
6.28 A RNP arrival route of Queenstown airport5. . . 151
6.29 An arrival route of Paris CDG airport (source: [10]). . . 151
6.30 Representing the selected waypoints on designed routes. (a) Waypoints defining the projection of a designed route in the horizontal plane. (b) Waypoints defining a route section corresponding to a level flight. . . 152
6.31 Departure and arrival routes in the metroplex TMA of New York. . . 153
A.1 Overview of the interface . . . 155
List of Tables
1.1 Notations related to the B&B method. . . 37
1.2 Parameters of the SA method. . . 40
3.1 Input data related to airport configuration. The related coordinates are given in a Cartesian Coordinate System. . . 61
3.2 Input data related to routes to design. . . 62
4.1 Input data related to routes to design. . . 86
4.2 Test 1: characteristics of the route to design. . . 86
4.3 Test 1: characteristics of the obstacles. . . 87
4.4 Test 1: numerical results. . . 89
4.5 Test 1: number of nodes generated in the B&B method under different tree explo-ration strategies. . . 89
4.6 Test 2: characteristics of the route to design. . . 89
4.7 Test 2: numerical results. . . 90
4.8 Test 2: number of nodes generated in the B&B method under different tree explo-ration strategies. . . 90
4.9 Test 3: characteristics of the obstacles. . . 92
4.10 Test 3: numerical results. . . 92
4.11 Test 3: number of nodes generated in the B&B method under different tree explo-ration strategies. . . 93
6.1 Input data related to routes to design. . . 113
6.2 Values of user-defined parameters related to the B&B-based method. . . 114
6.3 Test 1: starting and ending points, and corresponding buffer obstacles. . . 115
6.4 Test 1: characteristics of 6 obstacles. . . 115
6.5 Test 1: empirically-determined SA parameters. . . 116
6.6 Test 1: statistics of SA method. . . 118
6.7 Test 1: numerical results of B&B-based method and SA method. . . 118
6.8 Test 2: starting and ending points, and corresponding buffer obstacles of the routes. 120 6.9 Test 2: characteristics of nine obstacles. . . 120
6.10 Test 2: empirically-determined SA parameters. . . 121
6.11 Test 2: statistics of SA method. . . 123
6.12 Test 2: numerical results of B&B-based method and SA method. . . 123
6.13 Test Paris CDG airport: characteristics of the thresholds, and the FAFs associated with STARs. . . 125
6.14 Test Paris CDG airport: traffic load and waypoints of the selected standard routes. . 127 6.15 Starting and ending points, and corresponding buffer obstacles of the routes to design.128
6.16 Test Paris CDG airport: empirically-determined SA parameters. . . 130 6.17 Test Paris CDG airport: statistics of SA method. . . 132 6.18 Test Paris CDG airport: numerical results of B&B-based method and SA method
(Lstdi is the length of the ithselected standard route, and δ Li= Lstdi − Lγi∗). . . 134
6.19 Test Zurich airport: characteristics of the thresholds, and the FAFs associated with STARs. . . 136 6.20 Test Zurich airport: waypoints of the selected standard routes. . . 139 6.21 Starting and ending points, and corresponding buffer obstacles of the selected routes. 140 6.22 Test Zurich airport: empirically-determined SA parameters. . . 142 6.23 Test Zurich airport: statistics of SA method. . . 143 6.24 Test Zurich airport: numerical results of B&B-based method and SA method (Lstdi
Abbreviations
ACC Area Control Center ACO Ant Colony Optimization
ADS-B Automatic Dependent Surveillance-Broadcast AIS Aeronautical Information Service
ARTCC Air Route Traffic Control Center ATC Air Traffic Control
ATFM Air Traffic Flow Management ATM Air Traffic Management ATS Air Traffic Service BADA Base of Aircraft DAta B&B Branch and Bound B-spline Basis spline BST Best route length
CCO Continuous Climb Operation CDO Continuous Descent Operation CTR Control zone
CVH-filter Convex hull filter DataComm Data Communications FAF Final Approach Fix FI First Intersected
FIR Flight Information Region FMM Fast Marching Method FMS Flight Management System GA Genetic Algorithm
GDP Gross Domestic Product GI Greatest Incursion
GNSS Global Navigation Satellite System GPS Global Positioning System
IAF Initial Approach Fix
IF Intermediate Fix IFR Instrument Flight Rule ILS Instrument Landing System IP Integer Programming LCO Least Considered Obstacles LI Least Incursion
LPA Light Propagation Algorithm MCO Most Considered Obstacles
NextGen Next Generation Air Transportation System PBN Performance Based Navigation
PRM Probabilistic Roadmap PSO Particle Swarm Optimization RF Radius-to-Fix
RNAV Area navigation
RNP Required Navigation Performance RRT Rapidly-exploring Random Tree SA Simulated Annealing
SESAR Single European Sky ATM Research SID Standard Instrument Departure STAR Standard Terminal Arrival Route TCA Terminal Control Area
TMA Terminal Maneuvering Area TOC Top of Climb
TOD Top of Descent
TRACON Terminal Radar Approach CONtrol UAV Unmanned Aerial Vehicle
UIR Upper Information Region VFR Visual Flight Rule
Introduction
Air transportation is one of the most modern way of transport, and its major advantage lies in its quickness. It provides not only vital economic benefits but also significant social benefits. From the economic point of view, air transportation builds up a worldwide network (Fig. 1) that promotes and encourages global business and tourism. According to [11], in the year 2015, approximately 3.6 billion passengers globally are transported by air, which is 6.8 percent higher than the previous year, and about 54 percent of international tourists travel by air. In addition, about 62.7 million new jobs are generated through direct, indirect or induced impacts of air transportation industry in the world [11]. From the social welfare point of view, air transportation improves the quality of life by facilitating traveling, especially over long-distance. This also provides possibilities to enrich people’s leisure and cultural experiences. Besides, air transportation enables the prompt delivery of emergency aids anywhere on earth.
Playing such an important role in the transport industry, air transportation has a huge potential of development in the future. The Gross Domestic Product (GDP) is one of the key indicators within the aviation market, and the increase of world GDP leads to a continuous growth of the air traffic. According to [12], airline passenger traffic and air cargo traffic are expected to grow at annual rates of 4.8 and 4.2 percent respectively in the next 20 years. The Asia-related markets as well as the Latin America market have the most important increase. The developed market such as the markets inside Europe and North America have a relatively steady increment around 3 percent in the same
Figure 1: Global air routes network6.
period. In the year 2015, about 48 percent of people travel with airlines based in Europe and North America, while this market share is anticipated to shrink to 37 percent in the year 2035.
The promising market forecast of the aviation industry brings not only opportunities but also challenges. The main challenge is that the increase in air traffic demand is limited from the supply side by the capacity of the network. The extra traffic demand, that is not able to be absorbed by the network, will result in congestions. This is especially true in the airspaces surrounding airports, which serve as both the starting and ending points of the air traffic. The traffic amount is very huge in such areas, while the airspace is relatively limited. When the capacity of airports and the surrounding areas is insufficient, congestion surrounding airports increases quite rapidly, which leads to extra pressure on the network and causes more delays. According to [1], around 1.9 million flights are predicted to be unaccommodated in the year 2035 in Europe, accounting for 12 percent of the demand. More detailed information on the mismatch between capacity and demand in European countries is presented in Fig. 2, the shortfall is especially important in the countries such as Turkey, Bulgaria, Hungary and Romania. It can be seen that future air traffic operations will be limited by airports capacity. To face this challenge, new runways and airports are built in order to absorb the pressure on the network. However, this kind of solution leads to very high costs and relatively long construction period. In the future, new projects aiming at developing advanced technologies and improving airport infrastructures may be launched. It is also necessary to further ameliorate the operating environment and to allow more automation and more efficient utilization of the airspace.
Another challenge that aviation industry has to face lies in the environmental sustainability. Aviation environmental impacts include noise pollution as well as CO2 emissions and air quality
impacts from the burning fuel. This challenge is especially serious in the airspaces surrounding airports, since these areas are very close to the city residents, and people’s awareness of the impact brought by aviation industry becomes more and more sensitive and critical. In fact, notable results, aiming at reducing the environmental impacts, have been achieved nowadays, as a result of long-standing investigations. According to [1], current average noise level is reduced by 20 dB compared with 40 years ago, corresponding to a reduction in noise annoyance of 75 percent. Moreover, the
CO2emission decreased from 160 grams per passenger km in 1995 to 120 grams per passenger km
in 2010. Even though, these improvements are unlikely to compensate the continuous increase of the air traffic demand. Moreover, it is hard to make trade-offs between the mentioned environmental impacts. For example, re-routing aircraft in order to avoid noise-sensitive areas may lead to longer routes, which will result in more fuel consumption, thus more CO2 emissions. While operating
more fuel-efficient and noise-reduced procedures, such as Continuous Decent Operation (CDO) and Continuous Climb Operation (CCO), will limit the capacity of the airspaces surrounding airports. Thus, implementing these procedures is not an easy task, and more investigations and researches are needed.
Airports play an important role in the future development of the aviation industry. The airspace surrounding airports is named Terminal Maneuvering Area (TMA), which is designed to handle aircraft arriving to and departing from airports. It is crucial to increase the capacity of TMAs, and thus to deal with the congestion around airports caused by the worldwide air traffic growth. Most of the airports have pre-designed procedures indicating how aircraft depart from or arrive to airports. These procedures are called Standard Instrument Departure (SID) route and Standard Terminal Arrival Route (STAR). More precisely, a SID is a flight route which is followed by aircraft from its take-off phase until it starts the en-route phase, and a STAR is a route which connects the last en-route way-point to the Initial Approach Fix (IAF). In this thesis, the problem of designing SIDs/STARs is addressed in an optimal way, taking into account the configuration of the airport and nearby environment, as well as related operational constraints, including the avoidance of obstacles and the separation between routes. The designed routes use the airspace more efficiently, thus more traffic can be accommodated.
This thesis is organized in the following way. Chapter 1 introduces the context of the consid-ered problem. An overview of the current Air Traffic Management (ATM) system and its future development trends is given. Then, different types of controlled airspaces, especially the Terminal Maneuvering Area (TMA), are introduced. We give a short introduction to mathematical optimiza-tion problems and resoluoptimiza-tion methods, with an emphasis on the optimizaoptimiza-tion methods used in this thesis. Finally, the objectives and contributions of this thesis are given. Chapter 2 first reviews some existing methods in literature related to path planning problems. These methods are classified into two groups: roadmap based methods and path shape based methods. Then researches specifically dealing with the route design in ATM domain are presented, and the optimization methods applied in these works are discussed. Finally, we give a brief overview of the works related to trajectory planning. In Chapter 3, a mathematical framework to deal with the routes design problem is pre-sented. First, the 3D routes and obstacles modeling are given, then the routes design problem is formulated as a combinatorial optimization problem. In Chapter 4, the way one single optimal route is designed using a Branch and Bound (B&B) method is proposed. Besides, a technique to reduce efficiently the state space is also explained. Numerical results of several artificially generated prob-lems are given. The preliminary results of this method have been presented at EIWAC7conference in 2015 [13], and have been published in the Lecture Notes [14]. In Chapter 5, we develop two different approaches to solve the design of multiple routes. The first one is a B&B-based approach, where routes are generated sequentially. This approach is characterized by the B&B to generate a single route, and a strategy to deviate a conflicting route. This approach as well as some simulation results will be published in [15]. The second one is a typical heuristic approach, named Simulated Annealing (SA), where routes are generated simultaneously. The preliminary results of the SA method have been presented at DASC8 conference in 2016 [16]. In Chapter 6, the two proposed
7EIWAC2015, the 4th International Workshop on ATM/CNS, Tokyo, Japan
approaches for designing multiple routes are validated first on several artificially generated prob-lems, then applied to two problems corresponding to existing TMAs (Paris and Zurich). The results obtained from both approaches are compared and discussed. Finally we draw a conclusion for this thesis and discuss about the future research directions.
Chapter 1
Problem Context
In this chapter, we first introduce the current Air Traffic Management (ATM) system, including its definition and main activities. We also introduce some advanced technologies in a modernized ATM system to improve safety and increase efficiency in air traffic operation. In Section 1.2, dif-ferent kinds of controlled airspaces, as well as the corresponding flight phases managed by them are presented. In Section 1.3, the controlled airspace named Terminal Maneuvering Area (TMA) is presented in more detail, including its general layout as well as related operational and environmen-tal requirements. In Section 1.4, we give a short overview of optimization problems and resolution methods, with an emphasis on the methods applied in this thesis. Finally, we give the objectives and contributions of this thesis.
1.1
Current Air Traffic Management (ATM) system and its future
trends
Air Traffic Management (ATM) system generally refers to all the activities involved in ensuring the safe and orderly flow of air traffic flying between pairwise airports. Being such a huge and complex system, the functionality of ATM can be affected by many aspects. Effective planning is indispensable to guarantee that ATM operates safely and efficiently. Depending on the time horizon, the planning in ATM can be classified into three levels: strategic level, pre-tactical level and tactical level.
• A strategic level planning takes place about one year to several weeks before the real-time operations. Some macroscopic indicators, such as the traffic load, the congestions and com-plexity are estimated at this level. The design of route structure is also realized at this level, in order to optimize the traffic flow from scratch.
• A pre-tactical level planning is executed several weeks to one day before the real-time oper-ations. The information of traffic demand, weather forecast and other operational conditions are provided with higher accuracy. The planning performed at strategic level can be adjusted accordingly to decrease the complexity and congestions.
• A tactical level planning is conducted on the day of operations. It aims primarily at aircraft conflict resolution through the departure slot allocation, speed control, re-routing and other approaches. It attempts to maximize flights efficiency and to make full use of the available airspace.
In order to ensure the safe and efficient operation of air traffic, the ATM system provides three main services:
• Air Traffic Flow Management (ATFM), its primary objective is to regulate air traffic effi-ciently, so as to avoid or decrease the congestion. To fulfill this objective, it is very important to ensure the best possible match between supply and demand. One possible solution is to stagger the demand over time and space, another one is through better planning of the con-trol capacities to meet the demand. According to the planning time horizon, the ATFM is at strategic level.
• Air Traffic Control (ATC), its main purpose is to maintain sufficient separation between air-craft, and between aircraft and obstructions on the ground. However, this safety purpose must not impede the flow of traffic. According to the planning time horizon, the ATC is at tactical level.
• Aeronautical Information Services (AISs), its principal responsibility is to compile and dis-tribute all aeronautical information necessary for the safety, regularity and efficiency of air navigation to airspace users.
The current ATM system is being modernized in order to handle air traffic growth and to pro-vide greater safety at a lower cost. Two major projects, the Next Generation Air Transportation System (NextGen) [17] in the USA and the Single European Sky ATM Research (SESAR) [18][19] in Europe, are carried out to contribute to ATM modernization. The research area include: net-work and strategic traffic flow optimization, air-ground integrated concepts, trajectory and queue management, airport improvement programs, etc. Through these projects, new technologies of communication, navigation and surveillance are developed and implemented to the current ATM systems.
• The communication system allows the interaction between pilots and air traffic controllers. In the Data Communications (DataComm) project of future ATM system, air-to-ground and ground-to-ground data communications are added, which enables not only automated mes-sage generation and receipt in the ground side, but also mesmes-sage routing and transmission to aircraft avionics. Compared with the current ways of communication, which perform largely by voice, the DataComm is more efficient and accurate. Therefore, by using DataComm, the productivity of controllers is improved which could contribute to the growth of airspace capacity.
• The navigation system guarantees the aircraft to follow pre-defined routes and to access air-ports safely. The Performance Based Navigation (PBN) [20], including Area navigation (RNAV) and Required Navigation Performance (RNP), is one of the key factors to enable more precise navigation in the modernized ATM system. A PBN route follows a succession of waypoints, which are specified geographical locations, simply defined by latitude and lon-gitude coordinates. Compared with conventional navigation, which relies on ground-based infrastructures, the PBN routes are more flexible and have a higher level of navigation preci-sion. Thus the airspace can be more fully used by implementing PBN routes.
• The surveillance system is used to monitor the traffic situation and to prevent collisions. In the modernized surveillance system, the Automatic Dependent Surveillance-Broadcast (ADS-B) is implemented. ADS-B uses Global Positioning System (GPS) satellite signals to determine aircraft’s information, including speed and precise position, and also broadcasts these data
to other aircraft and air traffic controllers. Compared with the currently used Radar system, the ADS-B has a more accurate and reliable performance. With the complete implementation and application of ADS-B, both the pilots and the controllers can share the same real-time information of air traffic.
Through the developments in communication, navigation and surveillance technologies, an operat-ing environment with increased safety, efficiency and capacity, and with reduced delay and cost can be achieved. The route design problem considered in this thesis takes into account the navigation mode PBN, more precisely, the RNP under PBN. Thus more details about these navigation systems are presented in the following.
The navigation mode PBN not only defines the performance requirements for routes and pro-cedures designing, but also offers operational benefits such as enhanced safety and increased effi-ciency. As mentioned, it consists of RNAV and RNP. The mode RNAV allows aircraft to fly on any desired path within the coverage of ground- or space-based navigation aids [21]. The mode RNP is fundamentally similar to RNAV, but it requires additionally on-board performance monitoring and alerting [20]. Furthermore, RNP enables the Radius-to-Fix (RF) functionality, defined as an arc with specified center and radius between two defined waypoints [2]. An illustration of RF is shown in Fig. 1.1.
Figure 1.1: Radius-to-Fix illustration (source: [2]).
A comparison among the conventional navigation, RNAV and RNP routes is illustrated in Fig. 1.2, where the conventional navigation routes follow ground-based navigation aids instruments, and the RNAV and RNP routes follow a succession of waypoints. Since the RNAV and RNP routes’ structure is no more limited by the ground-based navigation aids, the available airspace is highly increased. From the operational point of view, flying a RNAV or RNP route is easy to operate for pilots. To define a flight path, pilots can choose which waypoints to follow in the navigation database implemented in the Flight Management System (FMS). During the flight, a Global Navi-gation Satellite System (GNSS) provides the aircraft position information to the FMS, and the FMS guides the aircraft along the flight plan.
Both RNAV and RNP have different performance levels, denoted by RNAV-x or RNP-x, where x represents the corresponding navigation accuracy. More precisely, RNAV-x represents that the horizontal distance between the aircraft and the standard path centerline is no more than x nautical mile (Nm) within 95% of the whole flight time. RNP-x is defined similarly, with the additional condition that the horizontal distance between the aircraft and the standard path centerline is no more than 2x nautical mile (Nm) within 99.999% of the whole flight time. Figure. 1.3 represents the navigation levels used in different flight phases, where the unit of the numbers is NM. A more detailed description of different flight phases is provided in Section 1.2. In general, higher naviga-tion accuracy is provided to the flight phases with more intense traffic. Moreover, it can be seen that RNP generally provides higher navigation precision than the RNAV, thus RNP is more useful in complex airspaces with dense traffic. The route design problem considered in this thesis takes into account the RNP-1, that covers arrival, approach and departure flight phases.
Figure 1.3: PBN applied in different flight phases (unit in NM)1.
1source:http://www.avbuyer.com/articles/business-aviation-safety/
1.2
Controlled airspace and Air Traffic Service (ATS) route
The global airspace is divided into Flight Information Regions (FIRs) by the International Civil Aviation Organization (ICAO). It is currently the largest regular division of airspace in use. Flight information service and alerting service are provided by FIR. There is no standard size of a FIR, a large country can be divided into several FIRs, while several small countries may become compo-nents of a single FIR. Moreover, in some cases, a FIR is further divided vertically, where the lower portion remains the name as FIR, and the upper portion is named Upper Information Region (UIR). Airspaces are classified to different categories, from class A to class G (7 classes in total), according to specified service standards. More detailed information on the airspace classification can be found in [22].
Some parts of airspace may have specific restrictions and reservations for operating a flight. This kind of regions includes danger area, restricted area and prohibited area.
• A danger area (Fig. 1.4(a)), defined with the letter “D” in aeronautical charts, is a limited zone used for dangerous activities, such as parachuting and rocket-launching. It is the least restrictive one among these three kinds of areas, and pilots can decide whether or not to cross such an area.
• A restricted area (Fig. 1.4(b)), defined with the letter “R” in aeronautical charts, is a limited zone for developing activities like training flights and military training. The pilots can only cross such an area under the permission of controllers.
• A prohibited area (Fig. 1.4(c)), defined with the letter “P” in aeronautical charts, is a limited zone where flights are totally prohibited, except for some authorized military and government use. It is the most restrictive one among these three kinds of areas.
(a) (b) (c)
Figure 1.4: Airspace with specific restriction. (a) Danger area. (b) Restricted area. (c). Prohibited area.
Airspace can be distinguished as controlled airspace or uncontrolled airspace in a general way. A controlled airspace is established to provide ATC services to flights under Instrument Flight Rules (IFR) and Visual Flight Rules (VFR), so as to promote a safe, orderly and expeditious flow of air traffic. On the contrary, in an uncontrolled airspace, ATC does not exert any executive authority. The VFR is not very commonly used for commercial flights, thus it is not included in the scope of this thesis. There exist three mains types of controlled airspaces, taking charge of different phases of a flight.
The principal phases of an IFR flight are take-off, departure, en-route, arrival, approach and landing, as illustrated in Fig. 1.5. More precisely, take-off is the flight phase where aircraft go through a transition from moving along the ground (taxi-out) to flying in the air, usually starting on a runway and finishing after reaching about 400 feet above the runway. Then aircraft continue to
departand leave the airport. When the Top of Climb (TOC) is reached, the en-route phase starts, aircraft may change flight levels in this phase. Afterwards, in the arrival phase, aircraft start to descend at the Top of Descent (TOD). The approach begins at the Initial Approach Fix (IAF) and terminates at the Final Approach Fix (FAF). A FAF is usually about 3000 feet above the runway. Finally, aircraft land to airport (finishing with taxi-in) and the flight is complete.
Figure 1.5: Principal phases of a flight.
The three mains types of controlled airspaces encountered by a flight are: Control zone (CTR), Terminal Maneuvering Area (TMA), Area Control Center (ACC). Figure. 1.6 illustrates the men-tioned controlled airspace structure in the vertical plane.
• A Control zone (CTR) is the controlled airspace nearby an airport, which extends from the surface to a specified upper limit. It is established to control aircraft operating to and from the airport. Thus the taxi, take-off and landing flight phases are regulated by CTR.
• A Terminal Maneuvering Area (TMA), also called Terminal Control Area (TCA) or Termi-nal Radar Approach Control (TRACON) in the U.S., is an area surrounding one or more neighboring airports, designed to handle the departure, arrival and approach flight phases of aircraft.
• An Area Control Center (ACC), also referred to as an Air Route Traffic Control Center (ARTCC) in the U.S., is the controlled airspace extended from TMA to upper altitude, where en-route control service is provided.
Before an IFR flight takes place, a flight plan must be submitted to its corresponding ATFM unit. A flight plan contains especially the following information:
• aircraft identification number, type and navigation equipment; • departure airport, proposed departure time, climb profiles; • requested flight routes;
• cruising airspeed and requested cruising altitude; • descent profiles and destination airport.
The corresponding ATFM unit analyzes the flight plan, and may propose some alternative routes in the case when the flight plan is not in compliance with the structure and capacity of the overflown airspace. One of the essential information in a flight plan is the requested flight routes, which are selected from the routes provided by Air Traffic Service (ATS). An ATS route is designed for
Figure 1.6: Controlled airspace structure.
channeling the flow of traffic as necessary for the management of air traffic. It may refer to various type of routes, such as low altitude airways (based on VOR2 stations below FL1803), jet routes (based on VOR stations from FL180 to FL450 feet), RNAV routes, etc.. An example of ATS routes in aeronautical chart is presented in Fig. 1.7, the routes with letter “V” (respectively, “T”) are low altitude airways (respectively, RNAV routes below FL180).
Figure 1.7: An example of ATS routes.
2VOR: VHF omni-directional range, a short-range radio navigation system for aircraft 3In aviation, 1 FL is equal to 100 feet, thus FL180 is equal to 18000 feet.
1.3
Departure and arrival routes in Terminal Maneuvering Area (TMA)
In this thesis, we specifically focus on the controlled airspace surrounding airports, that is the TMA, as well as the ATS routes for departure and arrival traffic. The scale of a TMA usually depends on the traffic amount to be handled, for example, the range of a TMA surrounding one or several major airports may extend to more than 80Nm from the corresponding TMA center, while the one of a TMA surround a small airport can be about 30Nm. Besides, different TMAs may have various shapes.
An example of the TMA of the Paris region in the horizontal plane is presented in Fig. 1.8, where the red arrows represent the departure traffic and the black arrows represent the arrival traffic. The case when more than one airports present in the same TMA is called metroplex. For example, in Fig. 1.8, both Roissy and Orly airports are in the same TMA. The metroplex TMA usually surrounds big cities with high traffic density. Traffic converging to different airports produces massive conflicts between aircraft. In order to decrease the interaction between traffic from or to different directions, the departure traffic (red arrows) and arrival traffic (black arrows) are usually located alternately, as shown in Fig. 1.8.
Figure 1.8: An example of the TMA of the Paris region.
Aircraft exit (respectively, enter) a TMA at some pre-defined points, named TMA exit (respec-tively, entry) points. These points are usually located at the boundary of the TMA. An example of the layout of TMA entry/exit points is presented in Fig. 1.9, where the TMA is in a circular shape. Moreover, the ATS route connecting the runway to a TMA exit point is called Standard Instrument Departureroute (SID), as illustrated by the blue curve. Meanwhile, the route connecting a TMA entry point to the runway is composed by several parts. The route section connecting the TMA entry point to the IAF is called Standard Terminal Arrival Route (STAR). There is usually a holding pattern located at the IAF, used for holding or descending aircraft to a desired altitude. Afterwards,
Figure 1.9: TMA entry/exit points.
the route section connecting IAF to FAF is called arrival route. Sometimes, an Intermediate Fix (IF) may exist between IAF and FAF. At the FAF, aircraft must be aligned to the runway, so as to intercept the ground-based infrastructure for the guidance of landing.
TMA is one of the most complex types of airspace, not only because of the highly dense traffic, but also because of the numerous constraints to be satisfied. The constraints generally fall into two main categories: operational constraints related to air traffic operations, and environmental constraints related to environmental sustainability. The operational constraints include:
• obstacle avoidance, the obstacle refers to mountains, restricted and military areas;
• aircraft separation, the standard separation norm between aircraft in a TMA is 3Nm in the horizontal plane or 1000ft in the vertical plane as shown in Fig. 1.10;
• flyable routes, the route must be smooth and with few turns;
• runway alignment, aircraft must head straightly to the runway before landing; • runway capacity limitation, this may lead to aircraft holding in the air; • severe weather avoidance.
The environmental constraints include:
• noise abatement, aircraft must fly over cities and neighborhoods above a vertical minimum; • CO2emission reduction, continuous descent/climb operations consume less jet fuel, thus
re-sult in less CO2emission. However, the airspace capacity is reduced by using these
opera-tions.
The constraints on runway capacity limitation and severe weather avoidance are usually handled at tactical or pre-tactical levels, while the other constraints can be managed at strategic level. All these constraints make the operation of aircraft in TMA very hard to be regulated at the same time safely
Figure 1.10: Standard separation norm in a TMA.
and efficiently, not only because the available airspace is restricted, but also because the controllers’ workload to manage traffic is increased.
The ATS routes in TMA must be designed with respect to these constraints, especially the ones at strategic level. Airports usually have published aeronautical charts, showing the ATS routes for departing from and arriving to it. An aeronautical chart specifies the information such as the name of this chart, the navigation mode (conventional, RNAV, RNP), the corresponding runway in use, the names and coordinates of the waypoints to follow, the constraints on altitude and speed of aircraft, etc. An example of a STAR chart of New Zealand Queenstown airport is presented in Fig. 1.11. The environment of the TMA surrounding Queenstown airport is very complex, due to the presence of mountains (area in brown color) and river (area in blue color). Thus RNP is used in such context, because of its high precision and flexibility, and the route is composed by segments and arcs of circles. In the real-world operation, before a flight takes place, pilot must choose the SID and STAR to follow, and enter the related waypoints to the Flight Management System (FMS) in the cockpit, so that the aircraft will be guided during the flight. Moreover, the use of SID/STAR charts simplifies the cooperation between pilots and controllers, by indicating directly the names of waypoints or routes.
The difficulty of designing SIDs/STARs lies especially in dealing with the numerous operational and environmental constraints mentioned above. Currently, SIDs/STARs are designed manually according to the requirements defined by the International Civil Aviation Organization (ICAO) [23], taking into account airport layout and nearby environment. This kind of design is generally not very efficient and is not expected to optimize the use of available airspace. The software G´eoTITAN, developed by Ecole Nationale de l’Aviation Civile (ENAC) PANS-OPS unit can be applied for procedure design in compliance with [23]. Even though this tool is efficient and accurate, it is still not expected to optimize any specific criterion.
1.4
Optimization problems and methods
Many complex problems in the real world are solved through the mathematical optimization, which is an important tool in making decisions and analyzing complex systems. An optimization problem is built up through the process of modeling, and three basic ingredients are identified and expressed in mathematical terms in this process. The basic ingredients of an optimization problem are:
• the objective function is used to measure quantitatively the performance of the system, and its value is minimized or maximized;
Figure 1.11: A STAR chart of New Zealand Queenstown airport4.
• the decision variables are the components of the system, and serve as levers to act on the system. Their values are to be determined in the resolution process. The objective function is expressed as a function of the variables;
• the constraints give the relationship among the variables, and allow the variables to take certain values while exclude others.
One standard form of an optimization problem is: minimize x f(x) subject to gi(x) ≤ 0, i= 1, · · · , m hi(x) = 0, i= 1, · · · , p (1.1) where
• x represents the decision variables; • f is the objective function;
• gi, i = 1, · · · , m are the inequality constraints, and
In the case of a maximization problem, the objective function can be negated in order to be in compliance with this standard form.
It is important to categorize the optimization model, since algorithms for solving optimization problems are tailored particularly to a type of problem. According to whether the variables are continuous or discrete, an optimization model can be classified into three categories:
• Continuous Optimization, where each variable can take value from a set of continuous real values;
• Combinatorial Optimization, where each variable can only take value from a discrete set, usually a subset of integers;
• Mixed-Integer Programming, where some of the variables are constrained to be integer values and the others are continuous.
Optimization methods are used to provide the values of the decision variables, which lead to the highest level of system performance. The optimization methods can be roughly divided into two categories: exact approaches and heuristics approaches.
• An exact approach guarantees to provide an optimum solution of the problem, if such a solu-tion exists, but it may be time-consuming to find the optimal solusolu-tion of a difficult problem. For this reason, exact approaches are usually difficult to be applied in some highly combina-torial NP-hard problems. In the path or trajectory planning problems, the exact approaches are generally applied in the design of one path or trajectory in 2D.
• Compared with an exact approach, an heuristic approach seeks to produce good-quality but not necessarily optimal solutions in reasonable computation times. Thus this kind of ap-proaches are more commonly used for complex and highly combinatorial problems. In the case of designing multiple 3D paths or trajectories, especially when taking into account nu-merous constraints, the heuristic methods seem to be more appropriate.
Exact approaches
Among the exact methods used in the context of path and trajectory planning, we find naturally the shortest path algorithm (Dijkstra’s algorithm [24], Bellman-Ford algorithm [25]). Besides, a widely known exact approach for solving combinatorial optimization problems is the Branch and Bound(B&B) method. This method is applied in the route design problem considered in this thesis, thus we present it in more detail in the following.
The B&B method is proposed by A. H. Land and A. G. Doig in 1960 [26]. Readers may refer to [27] and [28] for a survey and some examples of this method. The B&B algorithm checks the complete search space to get the global best solution. The number of potential solutions increases exponentially during the search, therefore explicit enumeration is hardly to be conducted. Instead, the implicit enumeration consisting of branching and bounding is applied to deal with the large number of potential solutions. The branching refers to the strategies of dividing the problem into subsets by partitioning the search space. The bounding refers to computing a lower bound (in a minimization problem) of a relaxed form of a subset, which is used to decide whether the corre-sponding subset needs to be further branched on. More precisely, in the case when the lower bound of a subproblem is greater than the cost value of the current best solution found so far, it is sure that there exists no better solution than the current best one with further branching on this branch.
![Figure 2: Flight demand excess over airport capacity in Europe in 2035 (source [1]).](https://thumb-eu.123doks.com/thumbv2/123doknet/2105003.7797/21.892.195.745.718.1044/figure-flight-demand-excess-airport-capacity-europe-source.webp)