Altered Gray Matter Structural Covariance Networks in
Early Stages of Alzheimer's Disease
Maxime Montembeault1,2, Isabelle Rouleau3, Jean-Sébastien Provost1,2, and Simona Maria
Brambati1,2 for the Alzheimer’s Disease Neuroimaging Initiative*
1 Centre de recherche de l’Institut universitaire de gériatrie de Montréal, Montréal, QC,
Canada; 2 Département de psychologie, Université de Montréal, Montréal, QC, Canada; 3
Département de psychologie, Université du Québec à Montréal (UQAM), Montréal, QC, Canada;*Data used in preparation of this article were obtained from the Alzheimer’s Disease
Neuroimaging Initiative (ADNI) database (adni.loni.usc.edu). As such, the investigators within the ADNI contributed to the design and implementation of ADNI and/or provided data
but did not participate in the analysis or writing of this report. A complete listing of ADNI investigators can be found at:
http://adni.loni.usc.edu/wp-content/uploads/how_to_apply/ADNI_Acknowledgement_List.pdf Publié dans : Cerebral Cortex (2016), 26 : 2650-2662
Abstract
Clinical symptoms observed in Alzheimer’s disease (AD) patients may reflect variations within specific large-scale brain networks, modeling AD as a disconnection syndrome. The present magnetic resonance imaging study aims to compare the organization of gray matter structural covariance networks between 109 cognitively unimpaired controls (CTRL) and 109 AD patients positive to Beta-amyloid at the early stages of the disease, using voxel-based morphometry. The default-mode network (medial temporal lobe subsystem) was less extended in AD patients in comparison to CTRL, with a significant decrease in the structural association between the entorhinal cortex and the medial prefrontal cortex and the dorsolateral prefrontal cortex. The default-mode network (midline core subsystem) was also less extended in AD patients. Trends toward increased structural association were observed in the salience and executive control networks. The observed changes suggest that early disruptions in structural association between heteromodal association cortices and the entorhinal cortex could contribute to an isolation of the hippocampal formation, potentially giving rise to the clinical hallmark of AD, progressive memory impairment. It also provides critical support to the hypothesis that the reduced connectivity within the default-mode network in early AD is accompanied by an enhancement of connectivity in the salience and executive control networks.
Key words: Anatomical Structural Covariance; Dementia; Default-mode network; Magnetic
1. Introduction
Alzheimer’s disease is the most common form of dementia, characterized by a cognitive decline beginning with memory impairments and resulting with general debilitating dementia. Alzheimer’s disease is characterized by intracellular tau-associated neurofibrillary tangles and extracellular amyloid-β (Aβ) associated plaques in the brain. Over the time course of the disease, pathology propagates stepwise following a specific topological pattern targeting specific large-scale distributed brain networks (Braak & Braak, 1991; Corder et al., 2000). The mechanisms determining this defined anatomical propagation of the disease are still poorly understood. Although the precise timing and mechanism of synaptic degeneration is not known, a growing body of evidence suggests that the presence of Aß exerts its toxic effect by disrupting synaptic signaling (reviewed in (Knobloch & Mansuy, 2008), whether it is its sole cause or not. More specifically, the presence of soluble, oligomeric form of Aß, rather than Aß plaques themselves, would have a key role in dendritic spine loss and synaptic alterations, ultimately resulting in cognitive dysfunctions. In this framework, some clinical symptoms observed in Alzheimer’s disease patients may reflect variations or dysfunctions within specific large-scale brain networks, rather than neural loss in a focal brain region, modeling Alzheimer disease as a disconnection syndrome (Delbeuck et al., 2003; Palop, Chin, & Mucke, 2006; Reid & Evans, 2013).
The relatively recent development of resting state or intrinsic connectivity network functional magnetic resonance imaging has become a valuable tool for mapping large-scale network connectivity alterations in Alzheimer’s disease. The resting state fMRI (rsfMRI) technique allows us to detect brain regions in which the blood oxygen level-dependent (BOLD) signal fluctuations correlate across time when an individual is left in wakeful rest (Buckner, Andrews-Hanna, & Schacter, 2008). This technique, when applied to healthy subjects, has revealed the existence of a functional network associated with task-free states, and is referred to as the default mode network (DMN) (Buckner et al., 2008; Raichle et al., 2001). It consists of an anatomically defined set of regions including the posterior cingulate cortex, the anterior medial prefrontal cortex, the medial temporal lobe, the lateral temporal cortex, and the inferior parietal lobule. Converging pieces of evidence indicate that connectivity reduction in the DMN occurs in Alzheimer’s disease (Gili et al., 2011; M. D. Greicius et al., 2004; Seeley et al., 2009; Zhou et al., 2010). One possible explanation is that DMN’s continuous activity would determine an activity-dependent or metabolism-dependent cascade of events, contributing to the formation and
diffusion of the pathology of Alzheimer’s disease (Buckner et al., 2005). Consistent with this hypothesis, maps of Aß plaques taken in Alzheimer’s disease living patients (Klunk et al., 2004) show a brain distribution remarkably overlapping the anatomy of the DMN. It should be noted that the great majority of these studies have mainly focused on either one single DMN (using an independent component analysis approach) or on connectivity from a seed region in the posterior cingulate cortex (in a cross-correlation approach). However, the DMN is not as homogeneous as previously described. It rather appears to be organized in multiple interacting subsystems, providing differential contribution to specialized brain functions (Andrews-Hanna, Reidler, Sepulcre, Poulin, & Buckner, 2010; Uddin, Kelly, Biswal, Castellanos, & Milham, 2009). Recent evidence (Andrews-Hanna et al., 2010) indicates that the DMN includes at least two components that would be worth investigating separately, so as to better understand the pattern of reduced DMN connectivity in Alzheimer’s disease: 1) the midline core, which includes the posterior cingulate and anterior medial prefrontal cortex, reflects the core set of “hubs” within the DMN and sustains the flexible use of information for self-relevant, affective decision making; 2) the medial temporal lobe subsystem, which is anchored by the hippocampus and the entorhinal cortex and includes the ventral medio-prefrontal cortex, posterior inferior parietal lobule and retrosplenial cortex, participates in episodic memory and visuo-spatial imagery, i.e., functions that are usually impaired in Alzheimer’s disease.
Although the majority of these studies report decreased connectivity, some evidence of enhanced resting state functional connectivity has been reported in Alzheimer’s disease patients compared to controls. Firstly, increased connectivity has been observed in the anterior portion of the salience network (Supekar, Menon, Rubin, Musen, & Greicius, 2008; Zhou et al., 2010), a network that presents anti-correlated intrinsic connectivity with the DMN (Seeley, Allman, et al., 2007). This network is anchored by dorsal anterior cingulate cortex and orbital frontoinsular cortices, with robust connectivity to subcortical and limbic structures (Seeley, Menon, et al., 2007). This network is thought to support the processing of diverse homeostatically relevant internal and external stimuli. According to some authors, the increased connectivity observed in Alzheimer’s disease could suggest that these patients rely on the anterior prefrontal networks as a way to compensate the weakened connectivity in the posterior DMN (Zhou et al., 2010). Secondly, increased connectivity has also been observed in the executive control network (Agosta et al., 2012; Filippi et al., 2013; Weiler et al., 2014), a compensatory network associated
with better performance in many cognitive tasks when recruited in AD patients (Grady et al., 2003). This network is anchored by the dorsolateral prefrontal cortex and parietal neocortices (Menon & Uddin, 2010; Seeley, Menon, et al., 2007; Sridharan et al., 2008) and plays a critical role in executive functions such as sustained attention, working memory, response selection, and response suppression (Seeley, Menon, et al., 2007).
Recent research and neuroimaging methodological developments seem to suggest that the study of anatomical structural covariance could represent a valuable tool to investigate the topological organization of the brain (for a review see (Alexander-Bloch et al., 2013), providing complementary information to other functional and structural connectivity approaches. This approach is based on the observation that related regions co-vary in morphometry characteristics. The first evidence comes from a post-mortem study showing that anatomically-related components of the visual system (i.e., the optic nerve, the lateral geniculate nucleus and the primary visual cortex) co-vary in volume across individuals (Andrews et al., 1997). Further evidence demonstrates that individuals with greater cortical thickness of Broca’s area of the inferior frontal cortex also generally present greater cortical thickness of Wernicke’s area of the superior temporal cortex (Lerch et al., 2006). It has been hypothesized that the pattern of structural covariance would be associated with the pattern of functional and/or structural connectivity, as revealed by previous rsfMRI (Seeley et al., 2009) and diffusion imaging (He et al., 2007) studies. According to recent evidence, the pattern of structural covariance should be better explained by the pattern of functional connectivity rather than the architecture of white matter fiber bundles (Gong et al., 2012), suggesting that areas that co-vary in morphological characteristics could belong to the same functional networks. However, it must be noted that there is neither a direct correspondence nor a complete overlap between functional connectivity and structural covariance networks. The mechanisms underlying structural covariance and its relationship with functional connectivity are very complex and are not yet completely understood. Some factors modulating the development of anatomical structures and the inter-regional covariance such as developmental, genetic and environmental factors could partly explain this inconsistency (Alexander-Bloch et al., 2013). In addition, some methodological limitations related to each technique (such as noise processing in resting state data, misregistration in brain-damaged or atrophic patient populations in anatomical imaging) could also contribute to this result. With these limitations in mind, many authors agree that the study of
structural correlative networks (SCN) represents an informative tool to investigate the topological organization of the brain (Alexander-Bloch et al., 2013; Reid & Evans, 2013) and could provide complementary information with respect to other connectivity approaches, such as resting state fMRI and/or diffusion brain imaging.
In the present study, we compared the pattern of structural covariance of gray matter (GM) volume in 109 Alzheimer’s disease patients at early stages of the disease and 109 cognitively unimpaired controls (CTRL) subjects. Based on previous reported literature (Montembeault et al., 2012; Zielinski et al., 2012; Zielinski, Gennatas, Zhou, & Seeley, 2010), the SCNs with seed regions anchoring the DMN (medial temporal lobe subsystem), the DMN (midline core subsystem), the salience network and the executive control network were selected for between-group analysis. The study was conducted using voxel-based morphometry (VBM) (Ashburner & Friston, 2000), a neuroimaging technique that allows us to map the pattern of covariance between the GM volume of an a priori selected “seed” brain region (i.e. a critical region of the network itself) and the GM volume throughout the entire brain (Mechelli et al., 2005). This technique has already been successfully used in healthy aging, neurodegenerative disease and psychiatric disorders (Montembeault et al., 2012; Seeley et al., 2009; Spreng & Turner, 2013; Zielinski et al., 2012). All structural MRI images were obtained from the Alzheimer’s disease Neuroimaging Initiative (ADNI), an open access database of serial MRI, biological markers, clinical, and neuropsychological assessments of Alzheimer’s disease patients and CTRL. Since it has been hypothesized that connectivity changes in Alzheimer’s disease are associated with the presence of Aβ (Knobloch & Mansuy, 2008), only Alzheimer’s disease patients with high Aβ1-42 concentration in the CSF and CTRL with low Aβ1-42 concentration according to current accepted cut-off (Shaw et al., 2009) were included in the study.
2. Materials and methods
Data used in the preparation of this article were obtained from the ADNI database (adni.loni.usc.edu) (see supplementary material for more information). For up-to-date information, see www.adni-info.org.
2.1 Subjects
T1 MRI brain scans were obtained from the ADNI database from the screening visit. One hundred and nine Alzheimer’s disease patients in the early stages of the disease (age range 56-88
years, mean age=74.3±7.8 years, females/males=50/59) and 109 CTRL subjects (age range 56-90 years, mean age=74.2±6.3 years, females/males=50/59) were included in the study. These two groups of participants were matched by age, years of education, total number of subjects, gender and magnetic field strength of the scanner used for their scans (1.5T / 3T = 62/47 in both groups). Also, only participants who were right-handed, who had English as their first language and who had available CSF biomarkers were considered for this study. All participants had no additional diseases expected to interfere with the study and showed a negative history of neurological disease and/or psychiatric disorder.
The criteria for classification of the subjects were as follows. To be included in the CTRL group, participants had to: 1) present no memory complaints; 2) show normal memory function documented by scoring at specific cutoffs on the Logical Memory II subscale (delayed Paragraph Recall) from the Weschler Memory Scale – Revised (≥9 for 16 years and more of education; ≥5 for 8-15 years of education; ≥3 for 0-7 years of education); 3) present a Mini-Mental State Exam (MMSE) score between 24 and 30 (inclusive); 4) present a CDR (Clinical Dementia Rating) score of 0; 5) be cognitively normal, based on an absence of significant impairment in cognitive functions or activities of daily living.
To be included in the Alzheimer’s disease group, participants had to: 1) present memory complaints verified by study partner; 2) show abnormal memory function documented by scoring at specific cutoffs on the Logical Memory II subscale (delayed Paragraph Recall) from the Weschler Memory Scaled – Revised (≤8 for 16 years and more of education; ≤4 for 8-15 years of education; ≤2 for 0-7 years of education); 3) present an MMSE score between 20 and 26 (inclusive); 4) present a CDR score of 0.5 or 1.0; 5) present National Institute of Neurological and Communicative Disorders and Stroke and the Alzheimer's Disease and Related Disorders Association (NINCDS/ADRDA) criteria for probable Alzheimer’s disease.
At the screening visit, all subjects were required to provide informed consent as compatible with the local sites (Institutional Review Board regulations).
2.2 Biomarkers collection
In order to take into consideration NINCDS/ADRDA criteria for probable Alzheimer’s disease dementia with intermediate evidence of the Alzheimer’s disease pathophysiological process, we added an exclusion criterion related to CSF Aβ in our study (McKhann et al., 2011). Therefore, only Alzheimer’s disease with high Aβ1-42 concentration in the CSF and CTRL with
low Aβ1-42 concentration according to current accepted cut-off (Shaw et al., 2009) were included in the study.
CSF was collected in the morning after an overnight fast using a 20- or 24-gauge spinal needle, frozen within one hour of collection, and transported on dry ice to the ADNI Biomarker Core laboratory at the University of Pennsylvania Medical Center. The complete descriptions of the collection and transportation protocols are provided in the ADNI procedural manual at
www.adni-info.org.
2.3 Clinical assessment
In addition, all subjects provided demographics, family history, and medical history. All subjects were given physical and neurological examinations, and vital signs were recorded. As mentioned, all subjects had been administered the MMSE (Folstein et al., 1975), CDR (Berg, 1988), Geriatric Depression Scale (GDS) (Yesavage & Sheikh, 1986) and the ADNI administration of Logical Memory II (Weschler, 1987). At baseline, standard neuropsychological tests were administered to all subjects, assessing classical cognitive domains: (a) Long-term memory: Rey Auditory Verbal Learning Test (Rey, 1964), (b) Attention: Trail making test A (Reitan, 1958), (c) Executive functions: Trail Making Test B (Reitan, 1958), (d) Language: Category Fluency Test (Butters, Granholm, Salmon, Grant, & Wolfe, 1987); (e) Boston Naming Test (30 items version) (Kaplan et al., 1983), and (f) Praxia/Spatio-temporal orientation: Clock Drawing Test (Goodglass & Kaplan, 1983).
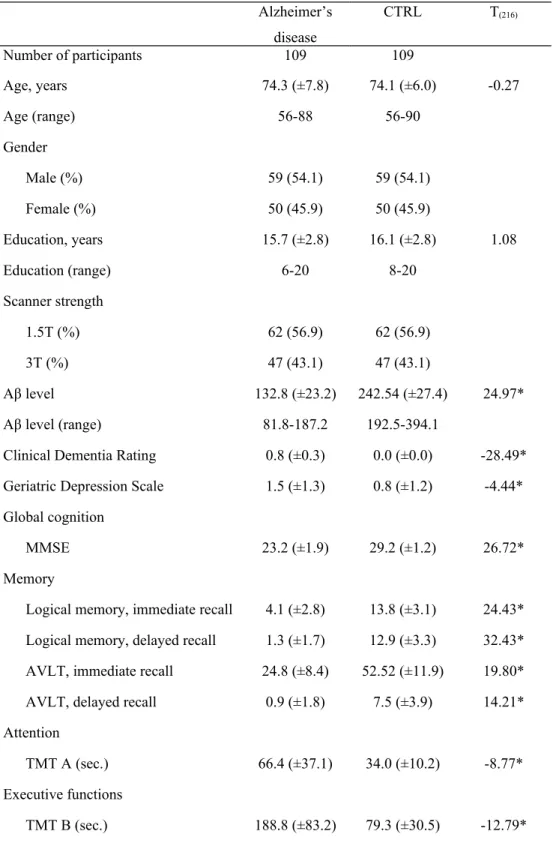
All of the participants' scores are summarized by diagnostic group (mean and standard deviation for quantitative measures, proportion or percent for categorical variables) in Table 1. Group characteristics at screening and baseline were analyzed using a series of two-independent-samples T-tests for comparing means.
The mean scores for the screening measures (MMSE, CDR, GDS, and Logical Memory II) revealed better performance in the CTRL compared to the Alzheimer’s disease group, at a threshold of p<0.001. The neuropsychological battery indicated that, generally, subjects with Alzheimer’s disease were impaired in all of the cognitive areas tested, compared to CTRL.
2.4 Image acquisition
Images were acquired during the screening visit. In both group, 62 subjects were from ADNI1 (1.5T scanners) and 47 subjects were from ADNI2 (3T scanners). At each site, the subjects underwent the standardized MRI protocol of ADNI as described at
http://www.loni.ucla.edu/ADNI/Research/Cores/index.shtml. Briefly, the ADNI protocol includes T1-weighted acquisition based on a sagittal volumetric magnetization prepared rapid gradient echo (MP-RAGE) sequence collected from a variety of MR-systems with protocols optimized for each type of scanner. Representative imaging parameters were as follows: repetition time = 2,300 milliseconds; inversion time = 1,000 milliseconds; echo time = 3.5 milliseconds; flip angle = 8°; field of view = 240x240 mm; and 160 sagittal 1.2-mm-thick slices and a 192x192 matrix yielding a voxel resolution of 1.25x1.25x1.2 mm, or 180 sagittal 1.2-mm-thick slices with a 256x256 matrix yielding a voxel resolution of 0.94x0.94x1.2 mm. The full details of the ADNI MRI protocol have been previously described (Jack et al., 2008).
2.5 Data analysis
Both image preprocessing and statistical analysis were performed using SMP8 (http://www.fil.ion.ucl.ac.uk/spm/software/spm8/) running on MATLAB 7.14.0.739 (Mathworks, Natick, MA).
2.5.1 Image preprocessing.
The structural images were preprocessed using the VBM8 (http://dbm.neuro.uni-jena.de/vbm/) toolbox. First, the T1-weighted volumetric images were manually re-oriented to be approximately aligned with the ICBM152-space (i.e., MNI-space) average template distributed with SPM8. This was performed to ensure reasonable starting estimates for the segmentation routine. The re-oriented T1 scans were then segmented into gray and white matter. Affine registered tissue segments were used to create a custom template using the diffeomorphic anatomical registration using exponentiated lie algebra (DARTEL) approach (Ashburner, 2007). For each participant, the flow fields were calculated during a template creation, which described the transformation from each native GM image to the template. These were then applied to each participant's GM image. DARTEL toolbox represents one of the highest-ranking registration methods and provides higher sensitivity for voxel-based morphometry (Bergouignan et al., 2009; Klein et al., 2009), as it has been proven in both healthy subjects and Alzheimer’s disease patients (Cuingnet et al., 2011).
The VBM analysis was based on the modulation of the GM segments by the nonlinear normalization parameters to account for brain size differences. Image process quality was verified by visual inspection of pre-processed images and sample homogeneity check using
covariance (VBM8 toolbox). The modulated and warped images were then smoothed with a Gaussian kernel of 8 mm FWHM.
2.5.2 Statistical analysis.
A statistical analysis was performed on modulated GM images using the (general linear model (GLM) as implemented in SPM8 (Friston et al., 1994). To investigate the network structural covariance, regional GM volumes of four ROIs were extracted from the 218 preprocessed images. The ROIs were selected within the right entorhinal cortex (MNI coordinates: 25, -9, -28), left posterior cingulate cortex (MNI coordinates: -2, -36, 35), right frontoinsular cortex (MNI coordinates: 38, 26,−10), and right dorsolateral prefrontal cortex (MNI coordinates: 44, 36, 20). These regions anchor the DMN (medial temporal lobe subsystem), DMN (midline core subsystem), salience and executive control networks, respectively. The right entorhinal cortex coordinates were retrieved from the Anatomy toolbox (Eickhoff et al., 2005) and the entorhinal cortex was chosen as the seed region, as it is the link between the neocortex and the hippocampal formation (Bernhardt et al., 2008). Left posterior cingulate cortex (Spreng & Turner, 2013; Zielinski et al., 2012), right frontoinsular cortex, and right dorsolateral prefrontal cortex (Montembeault et al., 2012; Zielinski et al., 2010) coordinates were included in previous studies investigating GM structural covariance. Analyses using contralateral ROIs (obtained by changing the sign the x-coordinate for each seed) were performed (Mechelli et al., 2005; Montembeault et al., 2012; Zielinski et al., 2010).
The GM volume was then calculated and extracted from a 4 mm radius sphere around those coordinates from the modified GM images. Four separate correlation analyses were performed by entering the extracted GM volumes from each ROI as a covariate of interest. The statistical model included binary covariates indicating each subject's magnetic strength of the scanner (1.5T or 3T) and gender, as well as covariates indicating the age and years of education of each subject. Subject groups (CTRL and Alzheimer’s disease) were modeled separately in all of the analyses.
First, specific contrasts were set in order to identify, for each ROI, voxels that expressed a positive correlation within each group (CTRL and Alzheimer’s disease). Resulting correlation maps for each group were thresholded at p≤0.05, corrected for familywise error rate (FWE), and displayed on a standard brain template to allow qualitative comparisons between the two groups, and voxel counts for each network in each group.
Furthermore, statistical contrasts were set to identify, for each ROI, voxels that expressed differences in the regression slopes between Alzheimer’s disease and CTRL. For this study, we will refer to these differences in slopes as the differences in ‘structural association.’ Specific T contrasts were established to map the voxels that expressed a stronger structural association in CTRL compared to Alzheimer’s disease, and vice versa. The threshold for the resulting statistical parametric maps was established at a voxel-wise at p≤.001 (uncorrected) and then FWE corrected for multiple comparisons at p≤0.05. A correction for non-stationary smoothness was then applied (Hayasaka, Phan, Liberzon, Worsley, & Nichols, 2004) using the implementation of this method in the VBM5 toolbox: this is necessary to avoid false positives with VBM (Ashburner & Friston, 2000).
3. Results
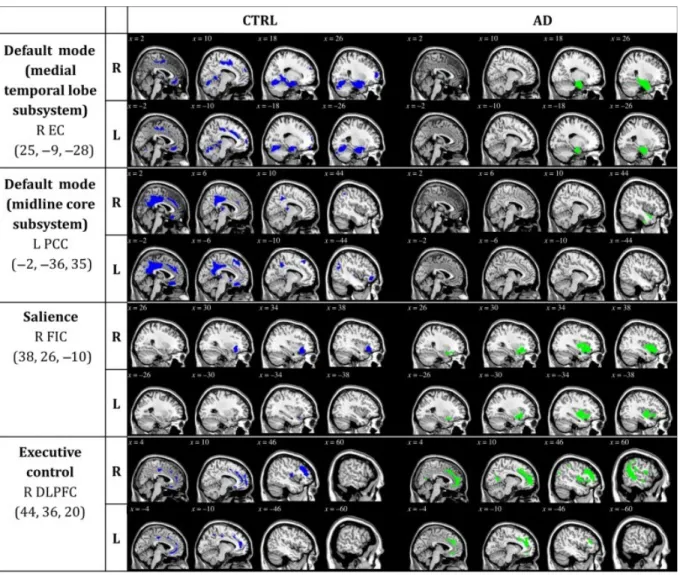
3.1 Patterns of structural association in CTRL and Alzheimer’s disease (Figure 1, Supplementary tables 1 to 16)
In order to qualitatively compare the patterns of positive correlations in both groups, statistical brain maps are presented in Figure 1. In both DMN networks, the CTRL group presents a greater amount of voxels (medial temporal lobe subsystem: 24902 voxels; midline core subsystem: 12879 voxels) than the Alzheimer’s disease group (medial temporal lobe subsystem: 10807 voxels; midline core subsystem: 9129 voxels). However, in both the salience network and the executive control network, the Alzheimer’s disease group presents a greater amount of voxels (salience: 5172 voxels; executive control: 22068 voxels) than the CTRL group (salience: 2428 voxels; executive control: 12025 voxels).
Regions presenting a structural association with the seed regions of each network of CTRL and Alzheimer’s disease subjects are listed in supplementary tables 1 to 16. Our results are generally consistent with network descriptions in the literature (Andrews-Hanna et al., 2010; Raichle et al., 2001; Seeley, Menon, et al., 2007).
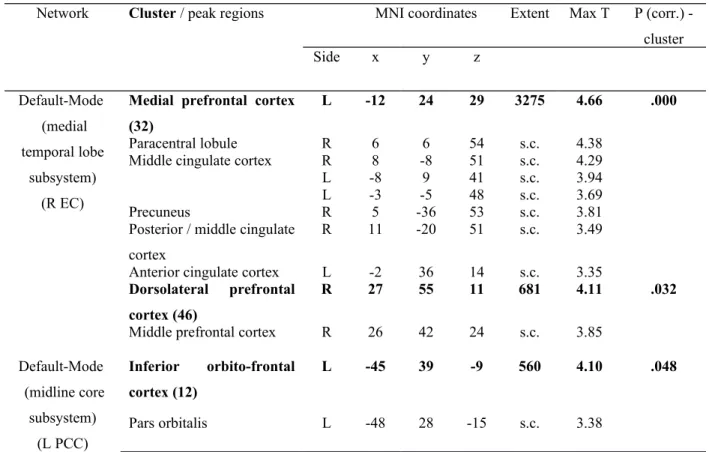
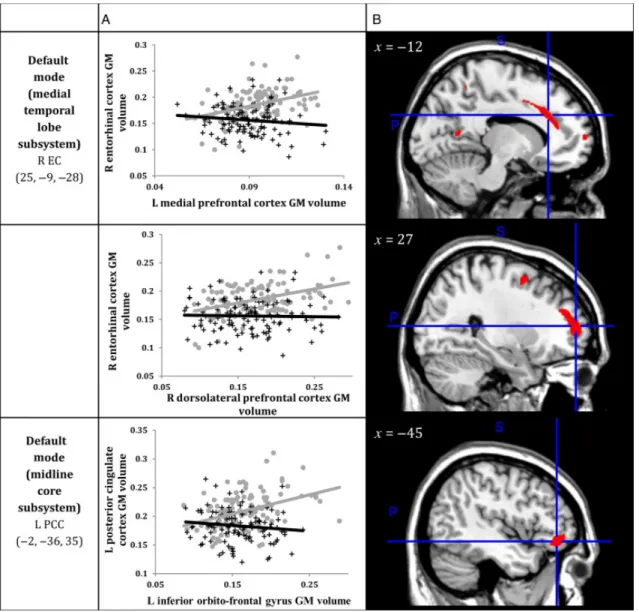
3.2 Decreased structural association in Alzheimer’s disease compared to CTRL (Tables 2 & 3, Figure 2)
Within the SCN anchored to the right enthorinal cortex, decreased structural association in Alzheimer’s disease was observed between the right entorhinal cortex and left medial
prefrontal cortex (x=-12, y=24, z=29, cluster p<.001) and right dorsolateral prefrontal cortex (x=27, y=55, z=11, p<.05) clusters (Table 2, Figure 3).
Within the SCN anchored to the left posterior cingulate cortex, decreased structural association in Alzheimer’s disease was observed between the left posterior cingulate cortex and the left inferior orbito-frontal cortex (x=-45, y=39, z=-9, cluster p<.05) cluster (Table 2, Figure 3).
No decreased association was observed in Alzheimer’s disease compared to CTRL in the SCN anchored to right frontoinsular cortex (salience), nor in the SCN anchored to right dorsolateral prefrontal cortex (executive control).
Analyses using contralateral regions of interest (ROIs) (obtained by changing the sign on the x-coordinate for each seed) showed a decreased structural association in Alzheimer’s disease in the SCN anchored to the left entorhinal cortex. Decreased structural association was observed between the left entorhinal cortex and the left paracentral lobule (x=-1, y=-2, z=57, cluster p<.001) and the right superior/middle frontal gyrus (x=28, y=1, z=54, cluster p<.05; x=27, y=48, z=18, cluster p<.05) clusters. No other significant differences were observed in SCN anchoring the contralateral seeds (anchored to the right posterior cingulate cortex, the left frontoinsular cortex and the left dorsolateral prefrontal cortex) (Table 3).
3.3 Increased structural association in Alzheimer’s disease compared to CTRL
Although the comparison between Alzheimer’s disease and CTRL did not reach the pre-established statistical threshold, a qualitative analysis seems to indicate a more extended pattern of structural association in the salience network (Figure 1, Figure 3, Supplementary tables 3 and 11) and in the executive control network (Figure 1, Figure 4, Supplementary tables 4 and 12) in Alzheimer’s disease than in CTRL.
4. Discussion
The present study aimed to characterize Alzheimer’s disease-related changes in the GM of the SCNs in the early stages of the disease. The patterns of SCN observed in the CTRL group are generally consistent with the same networks derived from previous resting state and structural covariance studies (Supplementary tables 1 to 8) (Andrews-Hanna et al., 2010; Raichle et al., 2001; Seeley, Menon, et al., 2007). Compared to CTRL, Alzheimer’s disease subjects with abnormal Aβ1-42 levels showed a decreased structural association mainly in the medial temporal
lobe subsystem of the DMN, and to a lesser degree, in the midline core subsystem of the DMN. Although no significant differences were observed at the pre-established threshold of significance, a qualitative comparison between the two groups revealed that the salience and the executive control SCNs were more extended in the Alzheimer’s disease group than in the CTRL group. No increased structural association was observed in the Alzheimer’s disease group compared to the CTRL group. Altogether, these results provide critical support to the hypothesis that Alzheimer’s disease is a disconnection syndrome targeting specific large-scale brain networks, in accordance with the network degeneration hypothesis.
Alzheimer’s disease is a neurodegenerative disease that progressively disrupts the patient’s cognitive capacities. Usually, the first function to be affected is episodic memory (Crowell, Luis, Cox, & Mullan, 2007; Greene, Baddeley, & Hodges, 1996), followed by attentional (Perry & Hodges, 1999), semantic memory (Blackwell et al., 2004; J. R. Hodges & K. Patterson, 1995), and linguistic or visuospatial deficits (M. A. Lambon Ralph, Patterson, Graham, Dawson, & Hodges, 2003; Perry & Hodges, 2000). Modern neurosciences clearly indicate that neural networks represent the scaffolding architecture of the organization of cognitive functions within the brain (M. Mesulam, 2009). In this framework, according to the network degeneration hypothesis, Alzheimer’s disease selectively targets large-scale functional networks that are formed in healthy humans during development (Seeley et al., 2009), and would in turn determine the development and deterioration of cognitive symptoms over time (Palop et al., 2006; Selkoe, 2002). The potential mechanisms of network-based disease pattern are still matter of debate. However, a recent study by Zhou and colleagues (Zhou, Gennatas, Kramer, Miller, & Seeley, 2012) strongly supports the hypothesis of the transneuronal spread, according to which some toxic agents propagate along interconnected neurons.
Many researchers speculate that Aβ accumulation may be an initiating event that leads to neuronal dysfunction, neurodegeneration, and cognitive loss (Jack, Lowe, et al., 2008; Morris et al., 2009; Walsh & Selkoe, 2007). Interestingly, Alzheimer’s disease patients show a pattern of Aβ plaque deposition remarkably overlapping the set of regions implicated in the DMN (Buckner et al., 2005), which suggests a possible link between amyloid-β and the intrinsic connectivity. Indeed, findings in both healthy adults and Alzheimer’s disease patients provide critical support to this hypothesis, revealing that the DMN functional connectivity is altered by the presence of Aβ (Mormino et al., 2011; Myers et al., 2014). In this framework, our results are
consistent with this hypothesis and expand these previous findings. Firstly, our results indicate that Alzheimer’s disease patients with Aβ positive are characterized by a selective and reduced structural association among different regions forming the DMN. Although structural covariance data cannot be considered as a direct measure of connectivity, a convergence between intrinsic connectivity and structural covariance has been reported in healthy subjects, thus demonstrating that these two patterns mirror each other (Seeley et al., 2009). This effect can be ascribed to the fact that synchronous neuronal firing promotes network-based synaptogenesis, as demonstrated by previous physiological studies (Bi & Poo, 1999; Katz & Shatz, 1996). Consistently, the patterns of structural covariance observed in our CTRL group (Figure 1, Supplementary tables 1 to 8) was overlapping with patterns obtained using fMRI-based intrinsic connectivity (Andrews-Hanna et al., 2010; Raichle et al., 2001; Seeley, Menon, et al., 2007). However, it must be noted that there is neither a direct correspondence nor a complete overlap between functional connectivity and structural covariance networks. While initial evidence for distinct subsystems within the DMN was provided by Andrews-Hanna and colleagues, these subsystems are distinct yet interactive: during certain experimentally-directed and spontaneous acts of future-oriented thought, these dissociated components are simultaneously engaged, presumably to facilitate construction of mental models of personally significant events (Andrews-Hanna et al., 2010; Andrews-Hanna, Smallwood, & Spreng, 2014). In particular, it is reported that the midline core is highly correlated with a dorsal medial subsystem as well as with the medial temporal subsystem, which is investigated in the present study. Even though findings by Andrews-Hanna and colleagues have been replicated (Choi, Yeo, & Buckner, 2012), providing strong evidence of the subdivision of the DMN in three subsystems, differences between analyses have emerged and demonstrate the heterogeneity within the DMN. Nonetheless, our results seem to suggest that, through the use of a different methodological approach, our results provide critical support to the hypothesis that Alzheimer’s disease patients with a proven presence of Aβ manifest selective altered connectivity within the DMN network at early stages of the disease.
Secondly, these results show that, at early stages of the disease, decreased structural association in the medial temporal lobe subsystem of the DMN would present the most prominent impact of the disease. In fact, major differences between Alzheimer’s disease and CTRL subjects were observed when we explored the SCN anchored to the entorhinal cortex. Reduced structural association between the entorhinal cortex and the medial prefrontal cortex
was observed. A functional disconnection between the prefrontal cortex and the hippocampus in Alzheimer’s disease has previously been observed (L. Wang et al., 2006). The medial prefrontal cortex is thought to play a critical role in learning associations between context, events, locations, and corresponding adaptive responses (Euston, Gruber, & McNaughton, 2012). Furthermore, the medial prefrontal cortex likely relies on its strong connections to the hippocampus to support rapid learning and memory consolidation (Euston et al., 2012). It was also suggested that the memory breakdown in early Alzheimer’s disease is related to a reduction in the integrated activity between these two areas (Grady et al., 2001). A decrease in the structural association between the entorhinal cortex and the precuneus was also observed. A previous rsfMRI study showed a clear disconnection between the hippocampus and precuneus and suggested that the hippocampus-precuneus functional connectivity should be considered as an early sign of Alzheimer’s disease (Kim et al., 2013), which is consistent with our results. The precuneus is thought to play a critical role in visuo-spatial imagery (Cavanna & Trimble, 2006). Overall, our results are generally concordant with studies showing compromised white matter projections to the hippocampus - particularly in the perforant path - in the early stages of Alzheimer’s disease and also in patients with mild cognitive impairment (Stoub et al., 2006; C. Wang et al., 2012). Early disruptions in structural association between the heteromodal association cortices and the entorhinal cortex could contribute to an isolation of the hippocampal formation, giving rise to the clinical hallmark of Alzheimer’s disease, i.e. progressive memory impairment, as well as visuospatial deficits.
Decreased structural association was also observed in the midline core subsystem of the DMN, which is anchored in the left posterior cingulate cortex. More specifically, decreased structural association was detected between the seed region and the inferior orbitofrontal gyrus. It has been recently proposed that the DMN often extends to the lateral frontal cortex, despite the fact that this region is not reported as part of the network (Spreng, Mar, & Kim, 2009). Nonetheless, it has been recently demonstrated that the combined activity of these two regions underlies the cognitive function of long-term memory, which is usually impaired in Alzheimer’s disease patients (Liu, Dong, Chen, & Xue, 2013).
Although disconnection seems to be the signature of Alzheimer’s disease pathology, it has been recently proposed that the reduced connectivity within the DMN is accompanied by a robust enhancement of connectivity in the salience network (Hu et al., 2010; Zhou et al., 2010).
Even though we did not observe any significant increase in structural association in the salience network anchored to the frontoinsular cortex, which is a key region of the salience network in the early stages of Alzheimer’s disease, our results presented a trend towards a more extended SCN in Alzheimer’s disease compared to CTRL. In fact, the qualitative analysis of voxel counts in the salience SCN presented a more extended salience network in Alzheimer’s disease patients than in CTRL. The neurobiology underlying the salience network/DMN relationship is unclear, but past studies suggest that this increase in resting state connectivity of the salience network occurs in the context of decreased DMN connectivity, and may thus represent a compensatory mechanism (Machulda et al., 2011). Therefore, we hypothesize that significant increases in structural association between regions of the salience network (as observed with our technique) might occur in later stages of Alzheimer’s disease as a result of a stronger DMN disconnection. Furthermore, our results also presented a trend towards a more extended executive control SCN (anchored in the dorsolateral prefrontal cortex) in Alzheimer’s disease compared to CTRL. Interestingly, our data suggest that in patients with Alzheimer’s disease, the dorsolateral prefrontal cortex presents a trend towards an increased structural association with posterior regions (such as the posterior cingulate cortex and the precuneus). These regions present a significant decreased structural association with the entorhinal cortex. Consistent with previous reports (Agosta et al., 2012; Filippi et al., 2013; Weiler et al., 2014; Zhou et al., 2010), our findings support the fact that Alzheimer’s disease is associated with opposing connectivity effects in the DMN and frontal networks, such as the salience and executive control networks.
In summary, this work demonstrates that the study of SCNs using VBM is an effective method to comprehensively investigate different networks that are of interest in Alzheimer’s disease. We suggest that the study of structural covariance represents a valuable complementary tool to better characterize the network-level anatomical changes that come with Alzheimer’s disease. As the first study to simultaneously investigate four key networks on a large sample of Alzheimer’s disease patients, our results provide support for the hypothesis that Alzheimer’s disease is a disconnection syndrome that targets specific brain networks, beginning with a disconnection of the medial temporal lobe from associative and visual areas. Future studies investigating the progression of SCNs in Alzheimer’s disease may help clarify the mirror role of the DMN and the salience network as well as the potentially compensatory role of the executive
control network in Alzheimer’s disease patients. Furthermore, the study of gray matter structural covariance in AD should extend to other brain networks of interest.
Acknowledgments
This work was supported by the Alzheimer Society of Canada (to S.M.B. and M.M.) and the Fonds de la recherche en santé du Québec (FRSQ) (to S.M.B.).
We thank Ms. Gabrielle Ciquier for the English editing of the article. The authors have nothing to disclose.
Data collection and sharing for this project was funded by the Alzheimer's Disease Neuroimaging Initiative (ADNI) (National Institutes of Health Grant U01 AG024904) and DOD ADNI (Department of Defense award number W81XWH-12-20012). ADNI is funded by the National Institute on Aging, the National Institute of Biomedical Imaging and Bioengineering, and through generous contributions from the following: Alzheimer’s Association; Alzheimer’s Drug Discovery Foundation; AraclonBiotech; BioClinica, Inc.; Biogen Idec Inc.; Bristol-Myers Squibb Company; Eisai Inc.; Elan Pharmaceuticals, Inc.; Eli Lilly and Company; EuroImmun; F. Hoffmann-La Roche Ltd and its affiliated company Genentech, Inc.; Fujirebio; GE Healthcare; IXICO Ltd.; Janssen Alzheimer Immunotherapy Research & Development, LLC.; Johnson & Johnson Pharmaceutical Research & Development LLC.; Medpace, Inc.; Merck & Co., Inc.; Meso Scale Diagnostics, LLC.; NeuroRx Research; Neurotrack Technologies; Novartis Pharmaceuticals Corporation; Pfizer Inc.; Piramal Imaging; Servier; Synarc Inc.; and Takeda Pharmaceutical Company. The Canadian Institutes of Health Research is providing funds to support ADNI clinical sites in Canada. Private sector contributions are facilitated by the Foundation for the National Institutes of Health (www.fnih.org). The grantee organization is the Northern California Institute for Research and Education, and the study is coordinated by the Alzheimer's Disease Cooperative Study at the University of California, San Diego. ADNI data are disseminated by the Laboratory for Neuro Imaging at the University of Southern California.
References
Agosta F, Pievani M, Geroldi C, Copetti M, Frisoni GB, Filippi M. 2012. Resting state fMRI in Alzheimer's disease: beyond the default mode network. Neurobiol Aging. 33:1564-1578.
Alexander-Bloch A, Giedd JN, Bullmore E. 2013. Imaging structural co-variance between human brain regions. Nat Rev Neurosci. 14:322-336.
Andrews-Hanna JR, Reidler JS, Sepulcre J, Poulin R, Buckner RL. 2010. Functional-anatomic fractionation of the brain's default network. Neuron. 65:550-562.
Andrews-Hanna JR, Smallwood J, Spreng RN. 2014. The default network and self-generated thought: component processes, dynamic control, and clinical relevance. Ann N Y Acad Sci. 1316:29-52.
Andrews TJ, Halpern SD, Purves D. 1997. Correlated size variations in human visual cortex, lateral geniculate nucleus, and optic tract. J Neurosci. 17:2859-2868.
Ashburner J. 2007. A fast diffeomorphic image registration algorithm. Neuroimage. 38:95-113. Ashburner J, Friston KJ. 2000. Voxel-Based Morphometry—The Methods. Neuroimage.
11:805-821.
Berg L. 1988. Clinical Dementia Rating (CDR). Psychopharmacol Bull. 24:637-639.
Bergouignan L, Chupin M, Czechowska Y, Kinkingnehun S, Lemogne C, Le Bastard G, Lepage M, Garnero L, Colliot O, Fossati P. 2009. Can voxel based morphometry, manual segmentation and automated segmentation equally detect hippocampal volume differences in acute depression? Neuroimage. 45:29-37.
Bernhardt BC, Worsley KJ, Besson P, Concha L, Lerch JP, Evans AC, Bernasconi N. 2008. Mapping limbic network organization in temporal lobe epilepsy using morphometric correlations: insights on the relation between mesiotemporal connectivity and cortical atrophy. Neuroimage. 42:515-524.
Bi G, Poo M. 1999. Distributed synaptic modification in neural networks induced by patterned stimulation. Nature. 401:792-796.
Blackwell AD, Sahakian BJ, Vesey R, Semple JM, Robbins TW, Hodges JR. 2004. Detecting dementia: novel neuropsychological markers of preclinical Alzheimer's disease. Dement Geriatr Cogn Disord. 17:42-48.
Braak H, Braak E. 1991. Neuropathological stageing of Alzheimer-related changes. Acta Neuropathol. 82:239-259.
Buckner RL, Andrews-Hanna JR, Schacter DL. 2008. The brain's default network: anatomy, function, and relevance to disease. Ann N Y Acad Sci. 1124:1-38.
Buckner RL, Snyder AZ, Shannon BJ, LaRossa G, Sachs R, Fotenos AF, Sheline YI, Klunk WE, Mathis CA, Morris JC, Mintun MA. 2005. Molecular, structural, and functional characterization of Alzheimer's disease: evidence for a relationship between default activity, amyloid, and memory. J Neurosci. 25:7709-7717.
Butters N, Granholm E, Salmon DP, Grant I, Wolfe J. 1987. Episodic and Semantic Memory: A Comparison of Amnesic and Demented Patients. J Clin Exp Neuropsychol. 9:479-497. Cavanna AE, Trimble MR. 2006. The precuneus: a review of its functional anatomy and
behavioural correlates. Brain. 129:564-583.
Choi EY, Yeo BT, Buckner RL. 2012. The organization of the human striatum estimated by intrinsic functional connectivity. J Neurophysiol. 108:2242-2263.
Corder EH, Woodbury MA, Volkmann I, Madsen DK, Bogdanovic N, Winblad B. 2000. Density profiles of Alzheimer disease regional brain pathology for the huddinge brain bank: pattern recognition emulates and expands upon Braak staging. Exp Gerontol. 35:851-864.
Crowell TA, Luis CA, Cox DE, Mullan M. 2007. Neuropsychological comparison of Alzheimer's disease and dementia with lewy bodies. Dement Geriatr Cogn Disord. 23:120-125.
Cuingnet R, Gerardin E, Tessieras J, Auzias G, Lehericy S, Habert MO, Chupin M, Benali H, Colliot O. 2011. Automatic classification of patients with Alzheimer's disease from structural MRI: a comparison of ten methods using the ADNI database. Neuroimage. 56:766-781.
Delbeuck X, Van der Linden M, Collette F. 2003. Alzheimer's disease as a disconnection syndrome? Neuropsychol Rev. 13:79-92.
Eickhoff SB, Stephan KE, Mohlberg H, Grefkes C, Fink GR, Amunts K, Zilles K. 2005. A new SPM toolbox for combining probabilistic cytoarchitectonic maps and functional imaging data. Neuroimage. 25:1325-1335.
Euston DR, Gruber AJ, McNaughton BL. 2012. The role of medial prefrontal cortex in memory and decision making. Neuron. 76:1057-1070.
Filippi M, Agosta F, Scola E, Canu E, Magnani G, Marcone A, Valsasina P, Caso F, Copetti M, Comi G, Cappa SF, Falini A. 2013. Functional network connectivity in the behavioral variant of frontotemporal dementia. Cortex. 49:2389-2401.
Folstein MF, Folstein SE, McHugh PR. 1975. "Mini-mental state". A practical method for grading the cognitive state of patients for the clinician. J Psychiatr Res. 12:189-198. Friston KJ, Holmes AP, Worsley KJ, Poline JP, Frith CD, Frackowiak RSJ. 1994. Statistical
parametric maps in functional imaging: A general linear approach. Hum Brain Mapp. 2:189-210.
Gili T, Cercignani M, Serra L, Perri R, Giove F, Maraviglia B, Caltagirone C, Bozzali M. 2011. Regional brain atrophy and functional disconnection across Alzheimer's disease evolution. J Neurol Neurosurg Psychiatry. 82:58-66.
Gong G, He Y, Chen ZJ, Evans AC. 2012. Convergence and divergence of thickness correlations with diffusion connections across the human cerebral cortex. Neuroimage. 59:1239-1248.
Goodglass H, Kaplan E. 1983. The assessment of aphasia and related disorders. Philadelphia: Lea and Febiger.
Grady CL, Furey ML, Pietrini P, Horwitz B, Rapoport SI. 2001. Altered brain functional connectivity and impaired short-term memory in Alzheimer's disease. Brain. 124:739-756.
Grady CL, McIntosh AR, Beig S, Keightley ML, Burian H, Black SE. 2003. Evidence from functional neuroimaging of a compensatory prefrontal network in Alzheimer's disease. J Neurosci. 23:986-993.
Greene JD, Baddeley AD, Hodges JR. 1996. Analysis of the episodic memory deficit in early Alzheimer's disease: evidence from the doors and people test. Neuropsychologia. 34:537-551.
Greicius MD, Srivastava G, Reiss AL, Menon V. 2004. Default-mode network activity distinguishes Alzheimer's disease from healthy aging: evidence from functional MRI. Proc Natl Acad Sci U S A. 101:4637-4642.
Hayasaka S, Phan KL, Liberzon I, Worsley KJ, Nichols TE. 2004. Nonstationary cluster-size inference with random field and permutation methods. Neuroimage. 22:676-687.
He Y, Chen ZJ, Evans AC. 2007. Small-world anatomical networks in the human brain revealed by cortical thickness from MRI. Cereb Cortex. 17:2407-2419.
Hodges JR, Patterson K. 1995. Is semantic memory consistently impaired early in the course of Alzheimer's disease? Neuroanatomical and diagnostic implications. Neuropsychologia. 33:441-459.
Hu WT, Wang Z, Lee VM, Trojanowski JQ, Detre JA, Grossman M. 2010. Distinct cerebral perfusion patterns in FTLD and AD. Neurology. 75:881-888.
Jack CR, Jr., Bernstein MA, Fox NC, Thompson P, Alexander G, Harvey D, Borowski B, Britson PJ, J LW, Ward C, Dale AM, Felmlee JP, Gunter JL, Hill DL, Killiany R, Schuff N, Fox-Bosetti S, Lin C, Studholme C, DeCarli CS, Krueger G, Ward HA, Metzger GJ, Scott KT, Mallozzi R, Blezek D, Levy J, Debbins JP, Fleisher AS, Albert M, Green R, Bartzokis G, Glover G, Mugler J, Weiner MW. 2008. The Alzheimer's Disease Neuroimaging Initiative (ADNI): MRI methods. J Magn Reson Imaging. 27:685-691.
Jack CR, Jr., Lowe VJ, Senjem ML, Weigand SD, Kemp BJ, Shiung MM, Knopman DS, Boeve BF, Klunk WE, Mathis CA, Petersen RC. 2008. 11C PiB and structural MRI provide complementary information in imaging of Alzheimer's disease and amnestic mild cognitive impairment. Brain. 131:665-680.
Kaplan E, Goodglass H, Weintraub S. 1983. The Boston Naming Test. Philadelphia: Lea and Febiger.
Katz LC, Shatz CJ. 1996. Synaptic activity and the construction of cortical circuits. Science. 274:1133-1138.
Kim J, Kim YH, Lee JH. 2013. Hippocampus-precuneus functional connectivity as an early sign of Alzheimer's disease: a preliminary study using structural and functional magnetic resonance imaging data. Brain Res. 1495:18-29.
Klein A, Andersson J, Ardekani BA, Ashburner J, Avants B, Chiang MC, Christensen GE, Collins DL, Gee J, Hellier P, Song JH, Jenkinson M, Lepage C, Rueckert D, Thompson P, Vercauteren T, Woods RP, Mann JJ, Parsey RV. 2009. Evaluation of 14 nonlinear deformation algorithms applied to human brain MRI registration. Neuroimage. 46:786-802.
Klunk WE, Engler H, Nordberg A, Wang Y, Blomqvist G, Holt DP, Bergstrom M, Savitcheva I, Huang GF, Estrada S, Ausen B, Debnath ML, Barletta J, Price JC, Sandell J, Lopresti
BJ, Wall A, Koivisto P, Antoni G, Mathis CA, Langstrom B. 2004. Imaging brain amyloid in Alzheimer's disease with Pittsburgh Compound-B. Ann Neurol. 55:306-319. Knobloch M, Mansuy IM. 2008. Dendritic spine loss and synaptic alterations in Alzheimer's
disease. Mol Neurobiol. 37:73-82.
Lambon Ralph MA, Patterson K, Graham N, Dawson K, Hodges JR. 2003. Homogeneity and heterogeneity in mild cognitive impairment and Alzheimer's disease: a cross-sectional and longitudinal study of 55 cases. Brain. 126:2350-2362.
Lerch JP, Worsley K, Shaw WP, Greenstein DK, Lenroot RK, Giedd J, Evans AC. 2006. Mapping anatomical correlations across cerebral cortex (MACACC) using cortical thickness from MRI. Neuroimage. 31:993-1003.
Liu Q, Dong Q, Chen C, Xue G. 2013. Neural processes during encoding support durable memory. Neuroimage. 88C:1-9.
Machulda MM, Jones DT, Vemuri P, McDade E, Avula R, Przybelski S, Boeve BF, Knopman DS, Petersen RC, Jack CR, Jr. 2011. Effect of APOE epsilon4 status on intrinsic network connectivity in cognitively normal elderly subjects. Arch Neurol. 68:1131-1136.
McKhann GM, Knopman DS, Chertkow H, Hyman BT, Jack CR, Jr., Kawas CH, Klunk WE, Koroshetz WJ, Manly JJ, Mayeux R, Mohs RC, Morris JC, Rossor MN, Scheltens P, Carrillo MC, Thies B, Weintraub S, Phelps CH. 2011. The diagnosis of dementia due to Alzheimer's disease: recommendations from the National Institute on Aging-Alzheimer's Association workgroups on diagnostic guidelines for Aging-Alzheimer's disease. Alzheimers Dement. 7:263-269.
Mechelli A, Friston KJ, Frackowiak RS, Price CJ. 2005. Structural covariance in the human cortex. J Neurosci. 25:8303-8310.
Menon V, Uddin LQ. 2010. Saliency, switching, attention and control: a network model of insula function. Brain structure & function. 214:655-667.
Mesulam M. 2009. Defining neurocognitive networks in the BOLD new world of computed connectivity. Neuron. 62:1-3.
Montembeault M, Joubert S, Doyon J, Carrier J, Gagnon JF, Monchi O, Lungu O, Belleville S, Brambati SM. 2012. The impact of aging on gray matter structural covariance networks. Neuroimage. 63:754-759.
Mormino EC, Smiljic A, Hayenga AO, Onami SH, Greicius MD, Rabinovici GD, Janabi M, Baker SL, Yen IV, Madison CM, Miller BL, Jagust WJ. 2011. Relationships between beta-amyloid and functional connectivity in different components of the default mode network in aging. Cereb Cortex. 21:2399-2407.
Morris JC, Roe CM, Grant EA, Head D, Storandt M, Goate AM, Fagan AM, Holtzman DM, Mintun MA. 2009. Pittsburgh compound B imaging and prediction of progression from cognitive normality to symptomatic Alzheimer disease. Arch Neurol. 66:1469-1475. Myers N, Pasquini L, Gottler J, Grimmer T, Koch K, Ortner M, Neitzel J, Muhlau M, Forster S,
Kurz A, Forstl H, Zimmer C, Wohlschlager AM, Riedl V, Drzezga A, Sorg C. 2014. Within-patient correspondence of amyloid-beta and intrinsic network connectivity in Alzheimer's disease. Brain. 137:2052-2064.
Palop JJ, Chin J, Mucke L. 2006. A network dysfunction perspective on neurodegenerative diseases. Nature. 443:768-773.
Perry RJ, Hodges JR. 1999. Attention and executive deficits in Alzheimer's disease. A critical review. Brain. 122 (3):383-404.
Perry RJ, Hodges JR. 2000. Fate of patients with questionable (very mild) Alzheimer's disease: longitudinal profiles of individual subjects' decline. Dement Geriatr Cogn Disord. 11:342-349.
Raichle ME, MacLeod AM, Snyder AZ, Powers WJ, Gusnard DA, Shulman GL. 2001. A default mode of brain function. Proc Natl Acad Sci U S A. 98:676-682.
Reid AT, Evans AC. 2013. Structural networks in Alzheimer's disease. Eur Neuropsychopharmacol. 23:63-77.
Reitan RM. 1958. Validity of the Trail making test as an indicator of organic brain damage. Percept Mot Skills. 8:271-276.
Rey A. 1964. L’examen clinique en psychologie. Paris: Presses Universitaires de France.
Seeley WW, Allman JM, Carlin DA, Crawford RK, Macedo MN, Greicius MD, Dearmond SJ, Miller BL. 2007. Divergent social functioning in behavioral variant frontotemporal dementia and Alzheimer disease: reciprocal networks and neuronal evolution. Alzheimer Dis Assoc Disord. 21:S50-57.
Seeley WW, Crawford RK, Zhou J, Miller BL, Greicius MD. 2009. Neurodegenerative diseases target large-scale human brain networks. Neuron. 62:42-52.
Seeley WW, Menon V, Schatzberg AF, Keller J, Glover GH, Kenna H, Reiss AL, Greicius MD. 2007. Dissociable intrinsic connectivity networks for salience processing and executive control. J Neurosci. 27:2349-2356.
Selkoe DJ. 2002. Alzheimer's disease is a synaptic failure. Science. 298:789-791.
Shaw LM, Vanderstichele H, Knapik-Czajka M, Clark CM, Aisen PS, Petersen RC, Blennow K, Soares H, Simon A, Lewczuk P, Dean R, Siemers E, Potter W, Lee VM, Trojanowski JQ. 2009. Cerebrospinal fluid biomarker signature in Alzheimer's disease neuroimaging initiative subjects. Ann Neurol. 65:403-413.
Spreng RN, Mar RA, Kim AS. 2009. The common neural basis of autobiographical memory, prospection, navigation, theory of mind, and the default mode: a quantitative meta-analysis. J Cogn Neurosci. 21:489-510.
Spreng RN, Turner GR. 2013. Structural covariance of the default network in healthy and pathological aging. J Neurosci. 33:15226-15234.
Sridharan D, Levitin DJ, Menon V. 2008. A critical role for the right fronto-insular cortex in switching between central-executive and default-mode networks. Proc Natl Acad Sci U S A. 105:12569-12574.
Stoub TR, deToledo-Morrell L, Stebbins GT, Leurgans S, Bennett DA, Shah RC. 2006. Hippocampal disconnection contributes to memory dysfunction in individuals at risk for Alzheimer's disease. Proc Natl Acad Sci U S A. 103:10041-10045.
Supekar K, Menon V, Rubin D, Musen M, Greicius MD. 2008. Network analysis of intrinsic functional brain connectivity in Alzheimer's disease. PLoS Comput Biol. 4:e1000100. Uddin LQ, Kelly AM, Biswal BB, Castellanos FX, Milham MP. 2009. Functional connectivity
of default mode network components: correlation, anticorrelation, and causality. Hum Brain Mapp. 30:625-637.
Walsh DM, Selkoe DJ. 2007. A beta oligomers - a decade of discovery. J Neurochem. 101:1172-1184.
Wang C, Stebbins GT, Medina DA, Shah RC, Bammer R, Moseley ME, deToledo-Morrell L. 2012. Atrophy and dysfunction of parahippocampal white matter in mild Alzheimer's disease. Neurobiol Aging. 33:43-52.
Wang L, Zang Y, He Y, Liang M, Zhang X, Tian L, Wu T, Jiang T, Li K. 2006. Changes in hippocampal connectivity in the early stages of Alzheimer's disease: evidence from resting state fMRI. Neuroimage. 31:496-504.
Weiler M, Fukuda A, Massabki LH, Lopes TM, Franco AR, Damasceno BP, Cendes F, Balthazar ML. 2014. Default mode, executive function, and language functional connectivity networks are compromised in mild Alzheimer's disease. Curr Alzheimer Res. 11:274-282.
Weschler D. 1987. WMR-S Weschler Memory Scale - Revised Manual. New York: Psychological corporation, Harcourt Brace Jovanovich Inc.
Yesavage JA, Sheikh JI. 1986. Geriatric Depression Scale (GDS): Recent evidence and development of a shorter version. In Clinical Gerontology: a Guide to Assessment and Intervention New York: The Haworth Press p 165-173.
Zhou J, Gennatas ED, Kramer JH, Miller BL, Seeley WW. 2012. Predicting regional neurodegeneration from the healthy brain functional connectome. Neuron. 73:1216-1227.
Zhou J, Greicius MD, Gennatas ED, Growdon ME, Jang JY, Rabinovici GD, Kramer JH, Weiner M, Miller BL, Seeley WW. 2010. Divergent network connectivity changes in behavioural variant frontotemporal dementia and Alzheimer's disease. Brain. 133:1352-1367.
Zielinski BA, Anderson JS, Froehlich AL, Prigge MB, Nielsen JA, Cooperrider JR, Cariello AN, Fletcher PT, Alexander AL, Lange N, Bigler ED, Lainhart JE. 2012. scMRI reveals large-scale brain network abnormalities in autism. PLoS One. 7:e49172.
Zielinski BA, Gennatas ED, Zhou J, Seeley WW. 2010. Network-level structural covariance in the developing brain. Proc Natl Acad Sci U S A. 107:18191-18196.
Tables
Table 1. Demographic and neuropsychological characteristics of Alzheimer’s disease and
CTRL Alzheimer’s disease CTRL T(216) Number of participants 109 109 Age, years 74.3 (±7.8) 74.1 (±6.0) -0.27 Age (range) 56-88 56-90 Gender Male (%) 59 (54.1) 59 (54.1) Female (%) 50 (45.9) 50 (45.9) Education, years 15.7 (±2.8) 16.1 (±2.8) 1.08 Education (range) 6-20 8-20 Scanner strength 1.5T (%) 62 (56.9) 62 (56.9) 3T (%) 47 (43.1) 47 (43.1) Aβ level 132.8 (±23.2) 242.54 (±27.4) 24.97*
Aβ level (range) 81.8-187.2 192.5-394.1
Clinical Dementia Rating 0.8 (±0.3) 0.0 (±0.0) -28.49*
Geriatric Depression Scale 1.5 (±1.3) 0.8 (±1.2) -4.44*
Global cognition
MMSE 23.2 (±1.9) 29.2 (±1.2) 26.72*
Memory
Logical memory, immediate recall 4.1 (±2.8) 13.8 (±3.1) 24.43*
Logical memory, delayed recall 1.3 (±1.7) 12.9 (±3.3) 32.43*
AVLT, immediate recall 24.8 (±8.4) 52.52 (±11.9) 19.80*
AVLT, delayed recall 0.9 (±1.8) 7.5 (±3.9) 14.21*
Attention
TMT A (sec.) 66.4 (±37.1) 34.0 (±10.2) -8.77*
Executive functions
Language
Category fluency 12.3 (±4.8) 19.9 (±5.9) 10.51*
Boston naming test 22.6 (±6.4) 27.8 (±2.3) 8.05*
Praxia/Spatio-temporal orientation
Clock drawing – score 3.2 (±1.4) 4.7 (±0.7) 9.85*
Clock copy – score 4.3 (±0.97) 4.8 (±0.7) 5.57*
(Abbreviations: AVLT = Auditory verbal learning test; TMT = Trail making test; T = independent-samples T-test values; * p<0.001. Values are presented a mean ± SD, number (%), or median (range).)
Table 2. The group differences in the SCN topology based on the comparison
CTRL>Alzheimer’s disease for the main seed regions. Max T is the maximum T statistic of each local maximum. P≤0.05 based on non-stationary cluster-extent correction.
Network Cluster / peak regions MNI coordinates Extent Max T P (corr.)
-cluster Side x y z Default-Mode (medial temporal lobe subsystem) (R EC)
Medial prefrontal cortex (32)
L -12 24 29 3275 4.66 .000
Paracentral lobule R 6 6 54 s.c. 4.38
Middle cingulate cortex R 8 -8 51 s.c. 4.29
L -8 9 41 s.c. 3.94
L -3 -5 48 s.c. 3.69
Precuneus R 5 -36 53 s.c. 3.81
Posterior / middle cingulate cortex
R 11 -20 51 s.c. 3.49
Anterior cingulate cortex L -2 36 14 s.c. 3.35
Dorsolateral prefrontal cortex (46)
R 27 55 11 681 4.11 .032
Middle prefrontal cortex R 26 42 24 s.c. 3.85
Default-Mode (midline core subsystem) (L PCC) Inferior orbito-frontal cortex (12) L -45 39 -9 560 4.10 .048 Pars orbitalis L -48 28 -15 s.c. 3.38
Table 3. The group differences in the SCN topology based on the comparison
CTRL>Alzheimer’s disease for contralateral seeds. Max T is the maximum T statistic of each local maximum. p≤0.05 based on non-stationary cluster-extent correction.
Network Cluster / peak regions MNI coordinates Extent Max T P (corr.)
-cluster Side X y Z Default-Mode (medial temporal lobe subsystem) (L EC) Paracentral Lobule (6) L -1 -2 57 7174 4.89 .000
Posterior cingulate cortex R 2 -33 51 s.c. 4.74
Paracingulate cortex R 3 -8 68 s.c. 4.46 Precuneus L -8 -57 59 s.c. 4.41 L -2 -71 35 s.c. 4.39 L -6 -45 65 s.c. 4.35 R 9 -50 56 s.c. 3.82 R 9 -45 69 s.c. 3.51 R 12 -71 51 s.c. 3.36 Posterior/middle cingulate cortex R 9 -21 54 s.c. 4.14
Middle cingulate cortex R 1 16 41 s.c. 3.83
Calcarine fissure R 3 -80 15 s.c. 3.81
R 1 -66 15 s.c. 3.80
Medial prefrontal cortex R 6 25 60 s.c. 3.62
Superior/middle frontal gyrus (6/8) R 28 1 54 999 4.69 .012 Superior/middle frontal gyrus (6/8) R 27 48 18 583 4.01 .045
Figures
Figure 1. Statistical maps depict brain regions in which gray matter intensity covaried with
that of the seed region of interest for each network in each group. z-statistic maps (P ≤.05, FWE-corrected) displayed on a standard brain render. (Abbreviations: sub. = subsystem; CTRL = cognitively unimpaired controls; AD = Alzheimer’s disease patients)
Figure 2. Statistical maps depict brain regions in which gray matter intensity covaried with
that of the seed region of interest (ROI; listed at left) in each group. z-statistic maps (P ≤.05, FWE-corrected) displayed on different slices of a standard brain template. (Abbreviations: R = right; L = left; CTRL = cognitively unimpaired controls; AD = Alzheimer’s disease patients; EC = entorhinal cortex; PCC = posterior cingulate cortex; FIC = frontoinsular cortex; DLPFC = dorsolateral prefrontal cortex)
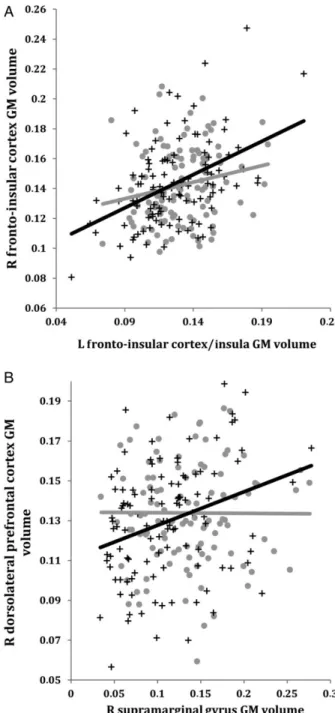
Figure 3. A) Correlations between GM volumes extracted from a 4-mm radius sphere
centered on the ROI and a 4-mm radius sphere centered on the peak voxel expressing decreased structural association in AD compared to CTRL. Gray dots represent CTRL and black crosses represent AD. B) The voxels that expressed decreased structural association in AD compared to CTRL. The crosshairs are centered on the global peak. (Abbreviations: R = right; L = left; GM = gray matter; EC = entorhinal cortex; PCC = posterior cingulate cortex)
Figure 4. Correlations between GM volumes extracted from a 4-mm radius sphere centered
on the ROI and a 4-mm radius sphere centered on the peak voxel showing a trend towards an increased structural association in AD compared to CTRL in the salience network (A) and the executive control network (B). Gray dots represent CTRL and black crosses represent AD. (Abbreviations: R = right; L = left; GM = gray matter)
Appendix 1:
Data used in the preparation of this article were obtained from the ADNI database (adni.loni.usc.edu). The ADNI was launched in 2003 by the National Institute on Aging (NIA), the National Institute of Biomedical Imaging and Bioengineering (NIBIB), the Food and Drug Administration (FDA), private pharmaceutical companies, and non-profit organizations, as a $60 million, 5-year public-private partnership. The primary goal of ADNI has been to test whether serial MRI, PET, other biological markers, and clinical and neuropsychological assessment can be combined to measure the progression of mild cognitive impairment and early Alzheimer’s disease. Determination of sensitive and specific markers of very early Alzheimer’s disease progression is intended to help researchers and clinicians develop new treatments and monitor their effectiveness, as well as lessen the time and cost of clinical trials. The Principal Investigator of this initiative is Michael W. Weiner, MD, VA Medical Center and University of California – San Francisco. ADNI is the result of efforts of many co-investigators from a broad range of academic institutions and private corporations, and subjects have been recruited from over 50 sites across the U.S. and Canada. The initial goal of ADNI was to recruit 800 subjects but ADNI has been followed by ADNI-GO and ADNI-2. To date, these three protocols have recruited over 1500 adults, ages 55 to 90, consisting of cognitively normal older individuals, people with early or late mild cognitive impairment, and people with early Alzheimer’s disease. The follow up duration of each group is specified in the protocols for ADNI-1, ADNI-2 and ADNI-GO. Subjects originally recruited for 1 and GO had the option to be followed in ADNI-2. For up-to-date information, see www.adni-info.org.
Supplementary table 1. Structural covariance network for CTRL with right entorhinal cortex as
seed. Max T is the maximum T statistic for each local maximum. P<0.05 based on non-stationary cluster-extent correction.
s.c: same cluster
Cluster / peak regions Stereotaxic coordinates Extent Max T P-value (corr).
Side x y z
Entorhinal cortex / Hippocampus R 27 -9 -27 12493 30.48 .000
R 21 5 -22 s.c. 8.29 Temporal pole R 37 11 -37 s.c. 7.31 Fusiform cortex R 20 -71 -13 s.c. 6.77 Cerebellum R 35 -81 -34 s.c. 6.31 Pars opercularis/triangularis R 49 21 5 s.c. 6.28 Insula R 36 -8 13 s.c. 5.72 R 43 9 -15 s.c. 5.62 R 46 2 -1 s.c. 5.51 Parahippocampal gyrus R 23 -30 -13 s.c. 5.59 Cuneus R 12 -47 0 s.c. 5.44
Entorhinal cortex / Hippocampus L -26 -9 -25 2301 9.88 .000
Supplementary motor area R 6 6 54 4677 6.05 .000
Cingulate cortex L -5 -6 48 s.c. 5.68
R 9 -11 50 s.c. 5.64
Middle cingulate cortex L -5 -24 50 s.c. 5.47
R 12 0 44 s.c. 5.46
L -12 24 33 s.c. 5.34
L -8 9 42 s.c. 5.20
R 3 22 38 s.c. 4.47
Anterior cingulate cortex L -12 33 21 s.c. 5.26
Middle / posterior cingulate cortex R 6 -30 50 s.c. 5.13
Precuneus L -8 -36 56 s.c. 5.10 Orbitofrontal cortex R 24 54 3 538 5.99 .000 Cerebellum L -21 -60 -15 2102 5.84 .000 L -26 -74 -19 s.c. 5.61 L -11 -78 -22 s.c. 5.31 L -29 -87 -31 s.c. 4.99 L -32 -75 -36 s.c. 4.54 Fusiform cortex L -27 -56 -6 s.c. 4.99 L -14 -77 -10 s.c. 4.92 Frontal pole L -15 66 9 578 5.64 .000
Superior frontal gyrus L -17 57 27 s.c. 4.74
Thalamus L -8 -32 6 69 5.52 .005
Orbitofrontal cortex R 0 37 -15 328 5.47 .000
Orbitofrontal cortex L -17 54 -16 115 5.36 .002
Superior prefrontal cortex R 15 55 27 352 5.33 .000
Middle occipital cortex R 45 -78 15 295 5.29 .000
Occipital lobe R 33 -84 17 s.c. 4.85
Lateral prefrontal cortex R 31 1 53 342 5.16 .000
Inferior frontal junction L -44 6 33 167 5.04 .001
Middle temporal cortex L -57 -3 -19 82 4.87 .004
Inferior frontal junction R 49 10 26 60 4.87 .005
Inferior temporal cortex L -39 -26 -19 108 4.85 .003
Cuneus L -12 -44 -6 128 4.85 .002
Supplementary table 2. Structural covariance network for CTRL with left posterior cingulate
cortex as seed. Max T is the maximum T statistic for each local maximum. P<0.05 based on non-stationary cluster-extent correction.
s.c: same cluster
Cluster / peak regions Stereotaxic coordinates Extent Max T P-value (corr).
Side x y z
Posterior cingulate cortex L -3 -35 36 7588 46.21 .000
Precuneus R 2 -71 36 s.c. 4.73
Middle cingulate cortex R 0 -2 47 s.c. 4.52
Anterior cingulate cortex R 0 30 32 2314 6.27 .000
L -2 42 26 s.c. 5.40
Inferior prefrontal cortex (p. orbitalis) L -42 43 -9 647 5.80 .000
Medial orbitofrontal cortex L -6 34 -16 519 5.51 .000
Rostral orbitofrontal cortex L -3 22 -21 s.c. 5.58
Angular gyrus L -47 -65 21 593 5.39 .000
L -45 -65 32 s.c. 4.92
Orbitofrontal cortex L -21 55 6 234 5.17 .001
Insula R 37 -9 12 173 5.00 .001
Medial prefrontal cortex L -8 31 51 662 5.57 .000
Insula L -38 7 2 53 4.88 .006
Supplementary table 3. Structural covariance network for CTRL with right fronto-insular
cortex as seed. Max T is the maximum T statistic for each local maximum. P<0.05 based on non-stationary cluster-extent correction.
s.c: same cluster
Cluster / peak regions Stereotaxic coordinates Extent Max T P-value (corr).
Side x y z
Fronto-insular / Inferior prefrontal cortex (p. orbitalis)
R 36 27 -9 1852 19.64 .000
R 46 38 -10 s.c. 4.47
Supplementary motor area R 8 27 57 199 5.60 .001
Medial prefrontal cortex L -5 60 20 199 5.30 .001
Supplementary motor area L -12 25 60 52 4.84 .006
Parahippocampal cortex R 20 -41 -7 70 4.79 .005