O
pen
A
rchive
T
OULOUSE
A
rchive
O
uverte (
OATAO
)
OATAO is an open access repository that collects the work of Toulouse researchers and
makes it freely available over the web where possible.
This is an author-deposited version published in :
http://oatao.univ-toulouse.fr/
Eprints ID : 16510
To link to this article : DOI:
10.1109/EuroSimE.2016.7463294
URL :
http://dx.doi.org/10.1109/EuroSimE.2016.7463294
To cite this version : Libot, Jean-Baptiste and Arnaud, Lionel and Dalverny, Olivier and
Alexis, Joël and Milesi, Philippe and Dulondel, Frédéric Mechanical fatigue assessment
of SAC305 solder joints under harmonic and random vibrations. (2016) In: 17th
International Conference on Thermal, Mechanical and Multi-Physics Simulation and
Experiments in Microelectronics and Microsystems (EuroSimE 2016), 18 April 2016 - 20
April 2016 (Dresden, Germany).
Any correspondence concerning this service should be sent to the repository
administrator:
[email protected]
Mechanical fatigue assessment of SAC305 solder joints under harmonic and random
vibrations
J.B. Libot1,2, L. Arnaud1, O. Dalverny1, J. Alexis1, P. Milesi2, and F. Dulondel2
1
University of Toulouse; INP/ENIT; LGP; 47, avenue d'Azereix; F-65013 Tarbes, France
2
SAFRAN Sagem; 21, avenue du gros chêne, F-95610 Eragny-sur-Oise, France [email protected], +33158115670
Abstract
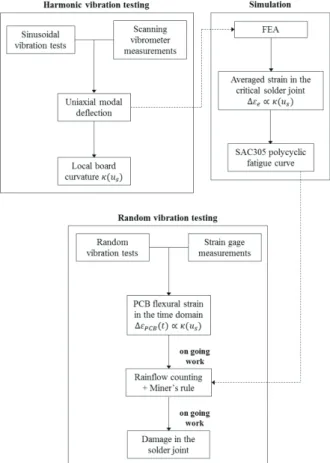
Vibration-induced solder joint fatigue is a main reliability concern for aerospace and military industries whose electronic equipment used in the field is required to remain functional under harsh loadings. Due to the RoHS directive which eventually will prevent lead from being utilized in electronic systems, there is a need for a better understanding of lead-free mechanical behavior under vibration conditions. This study reports the durability of Sn3.0Ag0.5Cu (SAC305) solder joints subjected to harmonic solicitations at three specific temperatures (-55°C, 20°C and 105°C) and random vibrations at ambient temperature (20°C). A test assembly was designed and consisted in a single daisy-chained 1152 I/O ball grid array (FBGA1152) package assembled on a flame retardant (FR-4) printed circuit board (PCB). The vibration levels were imposed by a controlled deflection at the center of the board at its natural frequency. The electric continuity was monitored to determine the number of cycles to failure of each sample. Mode shape measurements with a scanning vibrometer were also conducted and correlated with finite element analysis (FEA) to ensure accurate calculation of strain within the critical solder balls at the corners of the component. The failed specimens were then cross-sectioned in order to determine failure modes. A comparison of SAC305 durability with SnPb36Ag2 solder is given, along with a set of lifetime measurements for two complementary assemblies: 68 I/O Leadless Chip Carrier (LCC68) and 324 I/O Plastic Ball Grid Array (PBGA324). For the tested harmonic vibration levels, SAC305 outperforms SnPb36Ag2. Furthermore, the effect of temperature on the mechanical durability of SAC305 appears to be minor. Failure analysis pointed out different failure modes on PCB and component side, along with pad cratering and copper trace failures. FEA calculations allows the determination of the SAC305 fatigue curve to estimate the high cycle fatigue (HCF) behavior of SAC305 solder under harmonic vibrations. The random vibrations durability of SAC305 solder was assessed using the same test assembly (FBGA1152) which was subjected to three different levels of Power Spectral Density (PSD) at 20°C. The random vibrations tests were conducted within a frequency band ranging from 500 Hz to 900 Hz around the natural frequency. The chosen PSD levels applied were 0.04, 0.10 and 0.20 g2/Hz. Using power-law fitting, the results give a first estimation of the durability of SAC305 solder joints subjected to random vibrations.
1. Introduction
Electronic equipment for aerospace and military applications can encounter a wide range of environmental stresses mainly due to thermomechanical (temperature variations) and mechanical (vibrations, shocks) loadings [1]. With the RoHS directive preventing the use of lead (Pb), lead-free solder joint fatigue in severe vibration environments has especially become a great concern in electronic industry. Chen et al. assessed the sinusoidal vibration durability of a PBGA component using a linear !"#"$%&'()* +%#%,)* -"$)* ./'0)-12* -ule) combined with empirical tests and FEA [2]. Che et al. used quasi-static and harmonic analysis along with experimental data to predict flip chip solder joint reliability (tin-lead eutectic solder) under harmonic vibrations [3]. Yu et al. employed sinusoidal vibration tests and harmonic FEA to generate the strain-life (E-N) curves of Pb-free (SAC305 and SAC405) solder joints and evaluated the fatigue life of a BGA assembly under random vibrations [4]. Recently, Liu et al. conducted random vibration tests and correlated the input power spectral density (PSD) levels with the observed failure modes to assess the high cycle fatigue (HCF) of SAC305 BGA packages [5]. The same author further investigated the fatigue life prediction of BGA solder joints under random vibrations and derived the associated fatigue curve using numerical simulations [6]. Random vibration is more characteristic of modern-field environments produced by missiles or rocket engines and random vibration therefore provides a more realistic test. Military standards have been developed and give specifications to assess solder joint reliability under random vibration conditions [7].
The present study aims to assess the isothermal durability of SAC305 solder joints under sinusoidal vibrations at different temperatures (-55°C, 20°C and 105°C) and random vibrations at room temperature (20°C). Three test vehicles were designed using FBGA1152, PBGA324 and LCC68 packages mounted on an FR-4 printed circuit board. The experimental procedure for harmonic assessment consisted in performing out-of-plane sinusoidal vibrations at the first natural frequency of each test boards until failure. The deflection at the center of the assembly was chosen as the loading parameter and the input acceleration levels were thus chosen accordingly. The uniaxial deflection in the diagonal direction of the FBGA1152 test vehicle at 20°C was measured using a scanning vibrometer and global-local FEA was performed to determine strain in the
critical solder ball at the corner of the component. The results were correlated with the experimental data from vibration fatigue tests to plot a SAC305 polycyclic fatigue curve. The relationship between the calculated solder strain and the local board curvature is given.
Out-of-plane random vibrations at ambient temperature were conducted on FBGA1152 test vehicles at three different PSD levels (4.00, 6.32 and 8.90 GRMS) in
a 400 Hz frequency range around the natural frequency. Experimental data were extracted and a power law was derived to estimate the durability of SAC305 solder joints under random vibrations. A strain gage was also placed so that the board flexural strain can be measured next to the critical solder joint. The rainflow counting method was then applied to convert the randomly changed solder strain into a more suitable form for lifetime estimation models. With the derived SAC305 fatigue curve, damage in the corner ball can thereby be estimated using /'0)-12* rule [8].
Several failure mechanisms can be observed under vibration solicitations as reported by Liu et al. [5] and Zhou et al. [9]. An in-depth failure analysis was thus conducted in order to determine the main failure modes induced during the tested sinusoidal loadings.
2. Mechanical fatigue tests
2.1 Test vehicles and setup
Three test vehicles with three different components are designed for this study. The substrate is a 110 x 110 mm, 1.6 mm thick FR-4 printed circuit board on which is assembled a single component at its center. The board is drilled with 8 holes allowing the fixture of the assembly at each corner on the electrodynamic shaker. The distance between inner holes is 70 mm and the distance between outer holes is 90 mm. The board has Electroless Nickel Immersion Gold (ENIG) surface finish on non-solder mask defined (NSMD) pads. Table 1 gives the characteristics of each test assembly. The components are chosen according to their size, their type (array or peripheral packages) and associated solder shapes. Table 1 Characteristics of the test assemblies
Test assemblies FBGA1152 LCC68 PBGA324 Size (mm) 35 x 35 24.1 x 24.1 19 x 19 Solder SAC305,
SnPb36Ag2 SAC305 SAC305
Array type
Matrix Peripheral Matrix
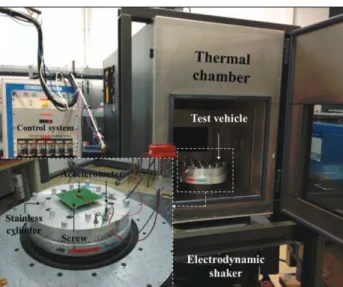
All these three packages are daisy-chained in order to detect failures in the interconnections during vibration tests. The daisy-chain resistance is not continuously monitored throughout the test but the assembly is connected to the safety channel of the high speed data acquisition system which is able to detect any micro electrical breakdown with a precision of detection to microsecond. The first total crack in a solder joint will therefore automatically lead to the electrodynamic shaker stoppage, allowing the determination of the time to failure. The experimental apparatus used for this study is given in figure 1. The isothermal fatigue tests are performed using an electrodynamic shaker placed in a thermal chamber and combined with a vibration control testing facility using LMS Test.Lab software. The thermal chamber can generate temperatures ranging from -55°C to 105°C. The electrodynamic shaker can produce out-of-plane acceleration up to 60 g (1 g = 9.81 m.s-2).
Figure 1 Experimental setup for isothermal vibration tests The temperature range is selected according to typical temperatures observed in aerospace and military environments. The test specimen is fixed on 16 mm diameter stainless cylinders at each corner of the assembly with a 70 mm space between each fixture. The torque applied on the screws is set to 0.75 N.m before each testing for repeatability purpose and so, even at extreme temperatures once the thermal equilibrium is reached. Two accelerometers are placed on the fixture and on the test vehicle to determine the dynamic response of the assembly.
2.2 Test procedure and matrix
The loading parameter for the harmonic vibration assessment is not the input acceleration level of the electrodynamic shaker but rather the deflection at the center of the board. At the natural frequency, this displacement can be determined from the response of the accelerometer placed at the center of the test assembly using the following equation:
!"#$ %()&'"#$*+
,* (1)
where ac(t) is the board acceleration response and f0 the
natural frequency of the test assembly. The harmonic vibration tests are conducted following two main steps. First, an experimental modal analysis is run to determine the natural frequency of the test specimen. Then, using (1), the assembly is subjected to sinusoidal forced vibrations with an imposed central displacement at the natural frequency until the first solder failure is detected. The vibration control system combined with the LMS Test.Lab software allows the tracking of the natural frequency so that any shift is corrected throughout testing. Table 2 gives the test matrix corresponding to the sinusoidal vibration tests carried out in this study (d0 is
the reference central displacement). The isothermal tests at -55°C and 105°C are conducted following the same procedure except that a 40 minutes delay is observed once the desired temperature is reached to account for thermal inertia.
Table 2 Test matrix (do: reference deflection)
Solder Package d/d0 T (°C) Test specimen SAC305 LCC68 1.50 20 8 1.67 20 12 PBGA324 1.00 20 12 1.33 20 12 FBGA1152 0.50 20 16 0.57 -55 12 20 16 0.62 20 12 0.67 20 16 0.83 -55 12 20 16 105 12 1.00 20 16 1.17 105 12 1.33 20 16 SnPb36Ag2 FBGA1152 0.83 20 16 A minimum of 12 test assemblies per loading condition (except for one configuration where 8 samples were tested) are used to get a statistical distribution of the lifetime results.
Regarding the mechanical assessment of SAC305 solder joints under random vibrations, only the FBGA1152 test vehicle is considered and no testing is performed at extreme temperatures. After an experimental modal analysis, the assembly is subjected to narrow-band random vibrations with specific PSD amplitudes at ambient temperature (20°C) until the first solder joint failure is detected. The frequency band (3f = 400 Hz) is centered on the natural frequency so that the dynamic response of the test assembly to the broad-band excitation is dominated by its first mode. Three different acceleration PSD amplitudes are considered in this experiment: 0.04, 0.10 and 0.20 g2/Hz. The boundary conditions are the same as described previously for harmonic vibration testing. Figure 2 shows the input PSD
curves with the acceleration PSD levels converted into GRMS (GRMS: Root Mean Square acceleration). A strain
gage orientated in the diagonal direction of the assembly is also placed on the bottom side of the PCB (side without the FBGA1152) underneath the critical corner ball to record the PCB flexural strain. This result combined with FEA and scanning vibrometer measurements is used to estimate the damage in the critical solder joint subjected to random vibrations.
Figure 2 Input acceleration PSD amplitudes and strain gage positioning
3. Scanning vibrometer measurements
In order to accurately capture the strain in the critical solder joint, it is necessary to determine the out-of-plane displacement of the test assembly. The solder joint which is the more likely to fail during vibration testing is the outermost solder joint at the corner of the component as reported by several authors [10,11]. Uniaxial modal deflections are thus measured in the diagonal of the test vehicle using a Polytec PSV-500 scanning vibrometer. Modal deflections are determined for six configurations corresponding to the sinusoidal vibration testing of FBGA1152 test specimen at 20°C. Measuring the diagonal board deflections at -55°C and 105°C was not feasible due to the thermal chamber. Figure 3 shows the experimental setup and the direction considered for the out-of-plane measurements.
Figure 3 Experimental setup for scanning vibrometer measurements 0 0,05 0,1 0,15 0,2 0,25 0 500 1000 1500 2000 ! " # $% & '( ) * +$ Frequency (Hz) 4.00 Grms 6,32 Grms 8.90 Grms Strain gage
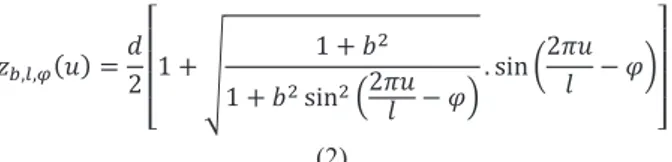
Once the experimental modal deflection is obtained, a method to assess damage in the critical solder ball consists in evaluating the local board curvature next to the critical solder joint [12-14]. Using the boundary conditions of the system and a three-parameter term (b, l, -) to account for the local stiffness of the board due to the FBGA1152 component, the uniaxial deflection equation of the tests assembly can be determined (equation 2). The parameter b is related to the added local stiffness due to the component, l is related to the dimensions of the board and ! is the phase.
./0102"3$ %!4 5 6 6 6 7 8 9 : 8 9 ;* 8 9 ;*<=>*?4)3 @ A -B C <=> D4)3@ A -E F G G G H (2)
Using the generalized reduced gradient method, (b, l, !) can be determined for each sinusoidal loading level to match the uniaxial deflections measured with the scanning vibrometer. It turns out that the parameters remain constant regardless of the z-displacement at the center of the board: b = 2.30 ± 0.05, l = 130.79 ± 0.64, ! = 0.61 ± 0.01. The mathematical formalism developed in (2) correctly captures the out-of-plane displacement of the assembly in the u-direction for a given central deflection (figure 4). The local bending curvature at the location of the critical solder ball (u = us) is then calculated using the
second u-derivative of (2) as depicted in (3).
8
IJ"3K$ % LJ"3K$ %
M*.
M3*N
JOJP (3)
where Ru and LJ are respectively the radius of curvature
and the curvature of the board in the u-direction. The calculation for each configuration shows that the curvature LJ"3K$ near the corner ball is proportional to the central deflection d.
Figure 4 Experimental and calculated modal deflections for the
tested loading levels
The experimental modal deflections determined with the scanning vibrometer are then used as the fitting parameter for the finite element analysis. The accurate modeling of the first mode shape of the FBGA1152
assembly allows the calculation of strain in the critical solder ball.
4. Finite Element Analysis
The FEA is performed using ANSYS Workbench V16 software. In order to get a numerical deflection similar to the out-of-plane displacement measured with the scanning vibrometer, every material of the FBGA1152 package is accurately modeled. Considering the symmetries of the problem, 1/4th of the test board is modeled to reduce computing time. Elastic behavior is considered for the materials of the assembly and their associated properties are given in Table 3. A global-local approach using submodeling technique is used to assess the strain in the critical solder ball. Figure 5 shows the coarse mesh of the solder ball associated with the global model and the fine mesh applied for the local model. The width of the local model is equal to the solder ball pitch.
Table 3 Material properties
Material E (GPa) Q R (kg.cm-3) FR-4 17 0.4 1.85 SAC305 50 0.4 7.37 Copper 124 0.33 8.96 BT substrate 22.8 0.21 1.76 Epoxy resin 18.9 0.3 2.25 Silicon 163 0.35 2.33
First, the 3D-global model of the electronic assembly is constructed and a modal analysis is carried out to characterize its dynamic response. Natural frequency and mode shape are calculated and compared with those from experimental modal analysis. An implicit dynamic analysis is then conducted to mimic the experimental conditions of the harmonic vibration tests. One period of the input signal is simulated in order to have the desired deflection at the center of the board. Damping is not considered here since the excitation amplitude is imposed.
a) b)
Figure 5 Meshing of a) global and b) local models
The fine local model is finally used and a finite-volume-weighted averaging technique is applied to describe the strain response of the critical solder joint in a specific zone (equation 4). The area of interest is chosen according to failure analysis observations. The averaging technique is used to account for meshing dependency [15]. 0 0,2 0,4 0,6 0,8 1 1,2 1,4 1,6 0 20 40 60 80 N o rm al iz ed z -d is p la ce m e n t u (mm) Experiment Model
STUVW%X YTZ[Z \ Z
X [\Z Z (4)
where YTZ is the strain in the i-th element, [Z the volume of the i-th element and n the number of elements in the volume of the chosen area of interest.
5. Results and discussion
5.1 Harmonic vibration testing
The isothermal harmonic experiments have been conducted at different loading levels covering several orders of magnitude of cycles to failure (104-107). A two-parameter Weibull distribution is used to model the number of cycles to failure (equation 5).
]"#$ % 8 A ^_`?abB
c
d (5)
where F(t) is the cumulative failure distribution function,
" the characteristic life (number of cycles to failure for
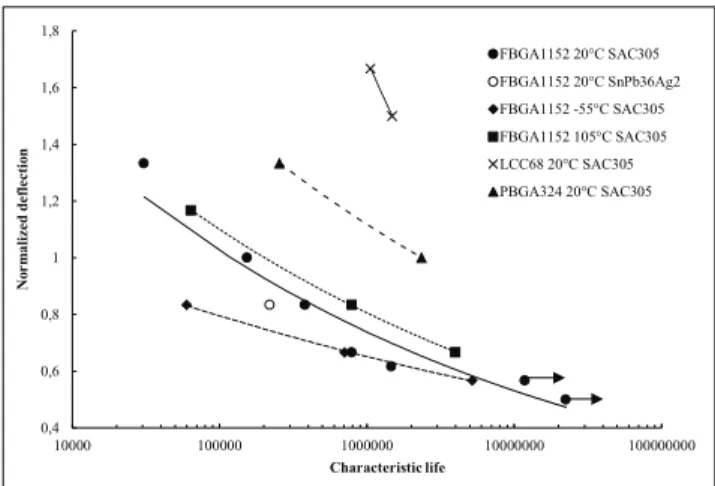
63.2% of failed specimens) and # the shape parameter. Fatigue curves can therefore be plotted and the relative positioning of each curve allows the assessment of the effects of temperature and component geometry on mechanical fatigue life. The stress parameter here is not the actual stress in the critical solder joint but rather the central z-displacement imposed on the board. Dimensions of solder joint are indeed too small to directly measure its strain response under vibrations. Figure 6 gathers the fatigue curves obtained from FBGA1152 assemblies at -55, 20 and 105°C, along with those from LCC68 and PBGA324 assemblies at 20°C. It is interesting to observe that the temperature has not much effect on the durability of SAC305 solder joints under harmonic vibrations. It is also remarkable to see that the durability at 105°C is higher than the durability at -55°C. The current analysis indeed used the center deflection as the loading parameter rather than the input level. The acceleration level from the electrodynamic shaker is adjusted according to the desired displacement at the center of the board. The effect of low temperature seems to induce an embrittlement of SAC305 solder joints leading to quicker failures than those recorded at higher temperatures. Figure 6 also shows that LCC68 and PBGA324 packages exhibit longer lifetime than FBGA1152. Size is the key parameter here since the bigger a component is, the higher the curvature near the critical solder joint is. However, LCC68 packages show better fatigue resistance than PBGA324. Even though LCC68 component is slightly bigger, the peripheral array of this component induces a lower curvature near the critical solder joint. The ball grid array produces a higher local stiffness which leads to a higher curvature next to the corner ball. Complementary scanning vibrometer measurements on LCC68 and PBGA324 will be conducted to quantify these curvatures. Further investigation is also needed to take into account solder shape effect.
Figure 6 Pseudo-fatigue curves for FBGA1152, LCC68 and PBGA324 solder joints
5.2 Failure analysis
Failure analysis was performed on failed FBGA1152 test vehicles subjected to sinusoidal vibrations at 20°C using cross-sectioning technique and microscopy observations. Three test vehicles per loading condition were cross-sectioned. A total of 109 cracks in the corner balls were observed and several failure modes were identified. Crack initiation always occurred in the solder bulk while propagation was either seen in the bulk, at the interface between the ball and the intermetallic compound (IMC) or in the IMC itself (figure 7). Amongst the total defects observed on the corner balls, 70% were located on the component side and 30% on the PCB side. On the component side, 53% of the defects occurred in the solder bulk, 33% at the interface solder / IMC and 14% were ductile cracks in the IMC. On the PCB side, 15% of the defects were observed in the solder bulk, 39% at the interface solder / IMC and 45% in the IMC. Finally, pad cratering underneath the critical balls (22 occurrences) and copper trace failures (4 identified cracks) were also observed. The likelihood to observe pad cratering increases as the loading amplitude increases.
a) b)
c) d)
Figure 7Failure modes observed on FBGA1152 test vehicles subjected to harmonic vibrations a) crack in the bulk, b) at the interface bulk / IMC, c) pad cratering and d) copper trace crack
0,4 0,6 0,8 1 1,2 1,4 1,6 1,8 10000 100000 1000000 10000000 100000000 N o r m a li z e d d e fl e c ti o n Characteristic life FBGA1152 20°C SAC305 FBGA1152 20°C SnPb36Ag2 FBGA1152 -55°C SAC305 FBGA1152 105°C SAC305 LCC68 20°C SAC305 PBGA324 20°C SAC305
Failure analysis on failed assemblies at -55°C and 105°C will be conducted in order to assess the effect of temperature on SAC305 microstructure and the resulting failure modes.
5.3 Finite Element Analysis
The damage in the solder joint, for a specific central deflection, depends on the boundary conditions of the system. In order to assess the harmonic durability of SAC305 solder joints regardless of the boundary conditions, FEA is used to convert the central deflection into a strain fatigue criteria. The modal analysis is first performed on the global model and compared with the experimental results (figure 8). Equivalent strain in the critical area of the solder joint (five elements thick layer on BGA side) is then determined with the global-local approach and the strain-life (E-N) curve of SAC305 solder joint at 20°C can be plotted (figure 9).
f0 = 674.62 f0 = 661.23 e 14.13
a) b)
Figure 8 a) Numerical and b) experimental first mode shape Vibration-induced fatigue of SAC305 solder joints can be described using Basquin12 law [16]:
STW
4 %fg
h
i j4kgl/ (7)
where STW is the elastic strain amplitude, 4kg the number of reversals to failure, fgh the fatigue strength coefficient,
E the elastic modulus and b the fatigue strength exponent.
The experimental data and the calculated solder strain from FEA are used to determine the material dependent parameters of the Basquin12*$%4*56-*789:;<*26$+)-*%$$6=.
Figure 9 Normalized log-log E-N curve for SAC305 solder joints at 20°C
The calculated solder strain can then be correlated to the measured board curvature near the critical corner ball (figure 10). The linear relationship obtained allows the determination of the fatigue criteria from the local board curvature at the location of the critical solder joint. Using this result along with the E-N curve and the strain gage measurements, it is possible to assess SAC305 durability under random vibrations.
Figure 10 Linear relationship between board curvature and solder strain
5.4 Random vibration testing
Random vibration testing was conducted at 20°C for three different acceleration PSD amplitudes (0.04, 0.10 and 0.20 g2/Hz) between 500 and 900 Hz. Figure 11 shows the measured time to failure versus the input PSD level. A power-law is used to fit the experimental data.
Figure 11 Power law fatigue model for random vibrations As the input PSD level increases, the durability of FBGA1152 assembly significantly decreases. The derived model is nevertheless dependent of the system (boundary conditions and test assembly) and it is necessary to develop a methodology to assess the random vibration durability of SAC305 solder joints using an adapted fatigue criterion. The PCB flexural strain STmno near the critical solder joint, which is directly proportional to the uniaxial board curvature LJ"3K$, is measured with the
strain gage during random vibrations testing for a two seconds time period (!t=2s). With the derived linear relationship between the board curvature and solder joint
0,1 1 10 10000 100000 1000000 10000000 100000000 N o rm a li ze d a v er a g ed s tr a in Cycles to failure Equivalent strain in the critical solder ball on BGA side
0,0 0,2 0,4 0,6 0,8 1,0 1,2 1,4 1,6 0 0,2 0,4 0,6 0,8 1 1,2 1,4 N o rm a li ze d a v er a g e st ra in
Normalized board curvature
PSD(g2/Hz) = 0,4993.TTF-0,286 0,01 0,1 1 1 10 100 1000 10000 P S D ( g 2/H z) Time-to-failure (TTF) (s)
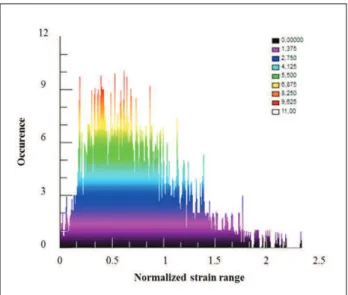
equivalent strain (figure 10), the random strain response of the corner ball in the time domain can be plotted (figure 12). The rainflow counting algorithm is a useful tool to convert complex temporal loadings with strain reversals into a simple and convenient (cycles vs. reversals) histogram [17]. The method indeed counts cycles according to an associated strain range and allows &>)* "2)* 65* &>)* /'0)-12* -"$)* (linear damage accumulation model) to estimate damage in solder joints. Using the rainflow counting method, it is therefore possible to identify blocks of constant-amplitude strain reversals in the corner ball during the two seconds time frame (figure 13).
Figure 12 Strain response of the critical corner ball (6.32 GRMS)
/'0)-12* rule can then be applied and the dimensionless damage Df for which failure occurs can be
expressed using the following equation: pg %qq]S# rskZ
Z Z
(8) where TTF is the time-to-failure, S# is the time frame during which rainflow counting method is applied, sZ is the number of cycles for a specific strain level and kZ is the number of cycle to failure for this specific strain level (determined from the derived E-N curve).
Figure 13 Rainflow histogram (6.32 GRMS temporal board
response for !t=2s)
6. Conclusion
In this study, the mechanical fatigue assessment of SAC305 solder joints under sinusoidal and random vibrations was investigated. Isothermal fatigue tests at 20°C pointed out that SAC305 was more durable than SnPb36Ag2 solder alloy for the tested loading level. SAC305 is also more likely to fail at -55°C than 20 and 105°C due to an embrittlement at low temperature. First mode shape of FBGA1152 assembly at 20°C was experimentally determined using a scanning vibrometer and a correlation was made between the board curvature and its central deflection. A high curvature value is reached at the location of the critical solder ball indicating a high risk of solder joint failure under harmonic vibrations. A package to package comparison showed that LCC68 outperformed PBGA324 and FBGA1152 due to its peripheral array inducing a lower curvature value near the corner joint. Further investigations are nevertheless needed to assess the influence of solder shape on fatigue life. Component size is also a relevant parameter to consider when assessing the mechanical reliability of SAC305 solder joints. For the same set of boundary conditions, the bigger a component is, the higher the curvature near the critical solder joint is. FEA was then performed on FBGA1152 assembly to match experimental first mode shape and accurately capture the strain in the corner ball. The calculated averaged equivalent strain was correlated with the experimental data in order to plot the SAC305 S-N curve at 20°C. Material parameters of the Basquin fatigue model were derived allowing the mechanical assessment of SAC305 solder joints under sinusoidal vibrations.
Random vibration durability was estimated using experimental results along with data from sinusoidal vibration tests and FEA. Harmonic vibration analysis indeed provided the E-N curve allowing the correlation between the number of cycles to failure to the associated equivalent strain in the critical solder joint. Measuring the modal deflection with the scanning vibrometer also allowed the derivation of a linear relationship between the uniaxial board curvature and the corner ball strain. The calculated local curvature is directly proportional to the uniaxial board flexural strain and it was therefore possible to correlate strain gage measurements with the calculated solder strain to obtain the time-domain response of the randomly varying corner ball strain. Rainflow counting method was then applied to convert the temporal response of the critical solder joint into strain amplitudes associated with a corresponding number of cycles. The algorithm is used to sort the random strain history and facilitate the quantification of the damage for each cycle. The use of /'0)-12* -"$)* !6"$+* &>)reby be considered to estimate the total damage in the critical solder joint. Figure 14 shows the overall approach used to assess SAC305 solder joint durability subjected to dynamic loadings. Next step is to perform the damage calculation through rainflow !6"0&'0,* -)2"$&2* %0+* /'0)-12* -"$)* &6* (%$'+%&)* &>)* methodology with the random vibration experimental data. Moreover, the effect of extreme temperatures
-1,5 -1 -0,5 0 0,5 1 1,5 0 0,5 1 1,5 2 N o rm a li ze d a v er a g ed s tr a in Time (s)
experienced by electronic equipment in the field has not been investigated in this study and isothermal random vibration tests will therefore be conducted. Finally, work is currently ongoing to assess the low cycle fatigue of SAC305 solder joints (LCF) and determine the complete SAC305 fatigue curve.
Figure 14 Approach for SAC305 mechanical fatigue assessment
Acknowledgments
This research work was partially supported by the University of Toulouse and SAFRAN Sagem. The authors would like to thank V. Dumont for his work on the test assembly modeling, M. Bahi for his contribution regarding failure analysis and S. Houssain for his help concerning the experimental work.
References
1. Steinberg, D., ?@'A-%&'60* 80%$=2'2* 56-* B$)!&-60'!* BC"'D#)0&EF* :-+* )+'&'6n, John Wiley & Sons, Inc. 2000.
2. Chen, Y.S., Wang, C.S., Yang, Y.J., ?Combining vibration test with finite element analysis for the fatigue life estimation of PBGA componentsEF* Microelectron. Reliab. 48:638G944, 2008.
3. Che, F.X., Pang, J.H.L, ?Vibration reliability test and finite element analysis for flip chip solder jointsEF* Microelectron. Reliab. 49(6):754G760, 2009.
4. Yu, D., Al-Yafawi, A., Nguyen, T.T., Park, S., Chung, 7HF*?High-cycle fatigue life prediction for Pb-free BGA
under random vibration loadingE. Microelectron. Reliab. 51:649G58, 2011.
5. I'"F* JHF* /)0,F* KHF* ?Random vibration reliability of BGA lead-5-))* 26$+)-* L6'0&EF* Microelectronics Reliability, 54(1), 226G232, 2014.
6. Liu, F., Lu, Y., Wang, Z., Zhang, Z., ?M"#)-'!%$* simulation and fatigue life estimation of BGA packages "0+)-* -%0+6#* ('A-%&'60* $6%+'0,E, Microelectronics Reliability, vol. 55, issue 12, part B, 2777-2785, 2015.
7. MIL-STD-883, ?Department of Defense Test Method Standard for MicrocircuitsEF*NOOPH
8. /'0)-F* /H8HF* ?9"#"$%&'() +%#%,)* '0* 5%&',")EF* Journal of Applied Mechanics, 1945.
9. Zhou, Y., Dasgupta, A., ?@'A-%&'60* Q"-%A'$'&=* Assessment of Sn3.0Ag0.5Cu & Sn37Pb Solders Under Harmonic ExcitationE, Proceedings of the IMECE, 2007.
10. Wong, T.E., Reed, B.A., Cohen, H.M., Chu, D.W., ?Q)()$6D#)0&*65*RK8*76$+)-*L6'0&*@'A-%&'60*J%&',") I'5)* S-)+'!&'60* /6+)$FE* TO&>* B$)!&-60'!* 96#D60)0&2* & Technology Conference, San Diego, CA, pp. 149-154, 1-4 June 1999.
11. Zhou, B., Qiu, B.J., En, Y. F., ?@'A-%&'60* +"-%A'$'&=* modeling and dynamic response analysis of PBGA #'U)+*26$+)-*L6'0&2EF*Proceedings of 11th International Conference on Electronic Packaging Technology & High Density Packaging, pp. 616-619, 2010.
12. Barker, D.B., Chen, Y.S., Dasgupta, A., ?Estimating the vibration fatigue life of quad leaded surface mount componentsEF Journal of Electronic Packaging, 115(2), pp. 195G200, 1993.
13. Guo, Q., Zhao, M., ?J%&',")* 65* 7/V* 26$+)-* L6'0&* including torsional curvature and chip location 6D&'#'W%&'60FE* X0&H* YH* 8+(H* /%0"5H* V)!>06$HF* (6$H* ZPF* pp. 887G889, 2005.
14. Amy, R.A., Aglietti, G.S., Richardson, G., ?R6%-+-Level Vibration Failure Criteria for Printed Circuit 822)#A$')2[* 80* BUD)-'#)0&%$* 8DD-6%!>?F* XBBB* Trans. on Electronics Packaging Manufacturing, vol. 33, no. 4, pp. 303G311, Oct. 2010.
15. Zhang, L., Sitaraman, R., Patwardhan, V., Nguyen, L. and Kelkar, N., "Solder Joint Reliability Model with Modified Darveaux's Equations for the micro SMD Wafer Level-Chip Scale Package Family", Proceedings of the 53rd. ECTC, pp.572 -577, 2003. 16. Basquin, O.H., ?V>)*BUD)-'#)0&%$*I%4*65*B0+urance
V)2&2EF*S-6!H*87V/F*NON;.
17. Downing, S. D., 76!')F* QHJHF* ?7'#D$'5')+* \%'05$64* 96"0&'0,* 8$,6-'&>#2EF* X0&)-0%&'60%$* Y6"-0%$* 65* Fatigue, vol. 4, No. 1, 1982.

![Figure 8 a) Numerical and b) experimental first mode shape Vibration-induced fatigue of SAC305 solder joints can be described using Basquin12 law [16]:](https://thumb-eu.123doks.com/thumbv2/123doknet/3146386.89585/7.892.454.809.230.432/figure-numerical-experimental-vibration-induced-fatigue-described-basquin.webp)