O
pen
A
rchive
T
OULOUSE
A
rchive
O
uverte (
OATAO
)
OATAO is an open access repository that collects the work of Toulouse researchers and
makes it freely available over the web where possible.
This is an author-deposited version published in :
http://oatao.univ-toulouse.fr/
Eprints ID : 15744
To link to this article : 10.1016/j.scitotenv.2016.04.006
URL :
http://dx.doi.org/10.1016/j.scitotenv.2016.04.006
To cite this version :
Bonzom, Jean-Marc and Hättenschwiler,
Stephan and Lecomte-Pradines, Catherine and Chauvet, Eric and
Gaschak, Sergey and Beaugelin-Seiller, Karine and Della-Vedova,
Claire and Dubourg, Nicolas and Maksimenko, Andrey and
Garnier-Laplace, Jacqueline and Adam-Guillermin, Christelle Effects of
radionuclide contamination on leaf litter decomposition in the
Chernobyl exclusion zone. (2016) Science of the Total Environment,
vol. 562. pp. 596-603. ISSN 0048-9697
Any correspondence concerning this service should be sent to the repository
administrator:
[email protected]
Effects of radionuclide contamination on leaf litter decomposition in the
Chernobyl exclusion zone
Jean-Marc Bonzom
a,⁎
, Stephan Hättenschwiler
b, Catherine Lecomte-Pradines
a, Eric Chauvet
c,
Sergey Gaschak
d, Karine Beaugelin-Seiller
a, Claire Della-Vedova
a, Nicolas Dubourg
a, Andrey Maksimenko
d,
Jacqueline Garnier-Laplace
a, Christelle Adam-Guillermin
aaInstitut de Radioprotection et de Sûreté Nucléaire (IRSN), PRP-ENV/SERIS, Cadarache, Bât. 183, BP 3, 13115 St Paul-lez-Durance, France
bCentre d'Ecologie Fonctionnelle et Evolutive (CEFE UMR 5175, CNRS–Université de Montpellier–Université Paul-Valéry Montpellier–EPHE), 1919 Route de Mende, F-34293 Montpellier, France cEcoLab, Université de Toulouse, CNRS, UPS, INPT, 118 Route de Narbonne, 31062 Toulouse cedex, France
dChernobyl Center for Nuclear Safety, Radioactive Waste and Radioecology, International Radioecology Laboratory, 07100 Slavutych, Ukraine
a b s t r a c t
Keywords: Decomposers Dose rates Ecosystem functioning Ionizing radiation Nuclear accident PollutionThe effects of radioactive contamination on ecosystem processes such as litter decomposition remain largely
unknown. Because radionuclides accumulated in soil and plant biomass can be harmful for organisms, the
functioning of ecosystems may be altered by radioactive contamination. Here, we tested the hypothesis that
decomposition is impaired by increasing levels of radioactivity in the environment by exposing
uncontaminated leaf litter from silver birch and black alder at (i) eleven distant forest sites differing in
ambient radiation levels (0.22 -15μGy h-1) and (ii) along a short distance gradient of radioactive
contamination (1.2 -29μGy h-1) within a single forest in the Chernobyl exclusion zone. In addition to
measuring ambient external dose rates, we estimated the average total dose rates (ATDRs) absorbed by
decomposers for an accurate estimate of dose-induced ecological consequences of radioactive pollution.
Taking into account potential confounding factors (soil pH, moisture, texture, and organic carbon content),
the results from the eleven distant forest sites, and from the single forest, showed increased litter mass loss
with increasing ATDRs from 0.3 to 150μGy h-1. This unexpected result may be due to (i) overcompensation
of decomposer organisms exposed to radionuclides leading to a higher decomposer abundance (hormetic
effect), and/or (ii) from preferred feeding by decomposers on the uncontaminated leaf litter used for our
experiment compared to locally produced, contaminated leaf litter. Our data indicate that
radio-contamination of forest ecosystems over more than two decades does not necessarily have detrimental
effects on organic matter decay. However, further studies are needed to unravel the underlying mechanisms
of the results reported here, in order to draw firrmer conclusions on how radio-contamination affects
decomposition and associated ecosystem processes.
1. Introduction
The major nuclear accident at the Chernobyl Nuclear Power Plant (ChNPP) in 1986 led to a total release of fission products (ignoring inert radioactive gases) into the atmosphere estimated at about 14 × 1018Bq (IAEA, 2006). This release and subsequent deposits
result-ed in a large-scale but heterogeneous radioactive contamination of territories according to the trajectories of the radioactive plume. The most affected natural and agricultural ecosystems are located within
an area of about 4300 km2around the damaged power plant known
as the Chernobyl exclusion zone (CEZ).
Numerous studies have investigated the effects of ionizing radiation on wildlife from subcellular to community levels around the ChNPP (e.g. Møller and Mousseau, 2006; Geras'kin et al., 2008, 2013). However, the consequences of increased ionizing radiation levels on ecosystem pro-cesses such as plant production, the degradation of dead organic matter, and elemental cycling have received very little attention so far. The only existing study evaluating the influence of radioactive contamination on plant litter decomposition in the CEZ and adjacent areas reported de-creased rates of leaf litter decomposition, resulting in an increasing thickness of the litter layer with increasing levels of ambient radiation (Mousseau et al., 2014). These results suggest a slower turnover of organic matter in response to higher levels of radioactivity, possibly due to negative impacts on the decomposer community.
Leaf litter decomposition plays a major role in ecosystem carbon and nutrient cycling (Swift et al., 1979; Cadish and Giller, 1997). Nutrients released during litter decomposition are estimated to account for 68 to 87% of the total annual requirement of essential elements for forest plant growth (Waring and Schlesinger, 1985). Decomposition is driven by a vast diversity of soil organisms including microorganisms and detritivorous invertebrates (e.g. Bardgett, 2005; Gessner et al., 2010). Depending on the quantity and quality of radionuclides accumulated in soil and litter, the resulting absorbed radiological dose (or dose rate) by soil organisms during their entire life and across generations may drive direct and/or indirect changes in various biological and eco-logical processes, including leaf litter decomposition (Geras'kin et al., 2008; Zaitsev et al., 2014). Indeed, within 2 months after the Chernobyl accident, 90% of soil invertebrate species had perished at a distance of 2 to 7 km from the ChNPP (Krivolutsky, 2000). In the first year after the accident, the total abundance of soil invertebrates in the forest litter was 45% of that of a reference site (Krivolutsky, 1996). However, the soil mesofauna communities were almost completely restored in terms of abundance and diversity 2.5 years after the accident, with the exception of the most severely contaminated sites (Krivolutsky, 1996, 2000). In contrast, Maksimova (2002) reported a diminished density and biomass of Diplopoda in forests exhibiting high contamination levels in the Gomel region (Belarus), 30 km North-East from the ChNPP, compared to control areas between 1986 and 1996. Very little data has been reported on the impact of the Chernobyl nuclear catastro-phe on soil microbial community structure or biomass. For example, Romanovskaya et al. (1998) showed that the abundance and diversity of cellulolytic, nitrifying, and sulphate-reducing bacteria were 1 or 2 or-ders of magnitude lower in contaminated soils within a 10 km zone around the ChNPP compared to control soils, 7 to 9 years after the accident. Moreover, fungal community data collected around the ChNPP between 1990 and 2005 indicated that the fungi species richness declined with increasing ambient radiation level (see Dighton et al., 2008 for a review). In contrast, Chapon et al. (2012) showed that soil
contaminated with radionuclides in the CEZ, exhibiting137Cs activities
ranging from 61 to 750 Bq g− 1, hosted a wide diversity of bacteria
sim-ilar to that observed in nearby control soils with137Cs activities ranging
from 0.35 to 1.5 Bq g−1, 25 years after the nuclear accident, suggesting
recovery of bacterial communities.
Data on the consequences of radioactive contamination on soil or-ganisms being scarce, it is presently difficult to predict how decomposi-tion as a key process of ecosystem funcdecomposi-tioning may be affected by radionuclides in the environment. In the present study, we investigated the effects of radionuclide contamination in the CEZ on the decomposi-tion of leaf litter from two tree species, silver birch (Betula pendula) and black alder (Alnus glutinosa) that are both highly abundant in the forests of the CEZ. The forested area has actually increased considerably since the establishment of the CEZ. Only 15 years after the nuclear disaster and the evacuation of residents, the forested area covered 70% of the total CEZ compared to 53% before the nuclear disaster (IAEA, 2001). Much of this forested area is covered by the early successional species silver birch and black alder. We exposed leaf litter collected in uncon-taminated sites from unconuncon-taminated trees to different levels of soil ra-dioactive contamination. In addition, we estimated the average total dose rates (ATDRs) absorbed by decomposer communities based on soil radioactivity measurements. We hypothesized that leaf litter mass-loss decreases with increasing ATDRs, due to an impact on the decomposer communities.
2. Materials and methods 2.1. Study sites
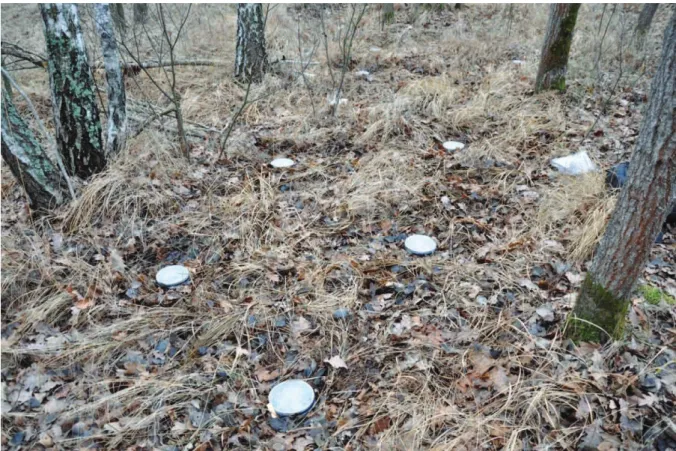
A total of 11 deciduous forest sites were selected within the Cherno-byl exclusion zone (CEZ; see materials and methods in the Supplemen-tary text for detailed description) with distances among sites ranging between 1 and 50 km (=sites 1 to 11; Fig. 1). The dominant tree species at all sites were silver birch and black alder. The sites were chosen based on a similar vegetation cover and a gradient of ambient dose rates (Table 1). We established a second gradient of soil contamination along a short distance transect (site T, Fig. 1) within one single forest (approximately 300 m between two successive sampling points), in order to further reduce the variability of potential environmental con-founding variables such as vegetation cover or soil characteristics (Fig. 1). This second gradient covered a range of radioactive contamina-tion similar to the first gradient, with a total of 6 sampling points (A, B, C, D, E, and F; Table 2). The dominant tree species at this site T were scots pine (Pinus sylvestris), sessile oak (Quercus petraea), and European hornbeam (Carpinus betulus), with sweet cherry (Prunus avium) and silver birch at lower abundances.
2.2. Leaf litter decomposition experiment
In October 2010, leaf litters of silver birch and black alder were col-lected outside the CEZ, near Slavutych town (i.e. 55 km East from Cher-nobyl) in uncontaminated sites. The leaves were collected at the time of abscission by shaking numerous trees and intercepting falling leaf on sheets of fabric (3 × 4 m). Leaves were dried at 35 °C during 72 h, and stored at 20–25 °C until use. They were thoroughly mixed within species, after the selection of only clean and intact leaves.
At the eleven different forest sites and at site T, custom-made micro-cosms and litter bags with leaf litter were installed, respectively. Both
microcosms and litter bags had a mesh size of 1 cm allowing access to
the entire decomposer community (including soil macrofauna).Field
microcosms (15 cm in diameter and 15 cm height) were constructed from plastic cylinders according to Barantal et al. (2011) (see materials
and methods in the Supplementary text for detailed description:
Fig. A.1). Microcosms were filled with 5 ± 0.02 g (air-dry mass; aver-age ± 1 SD) of tree leaf litter and placed randomly at each of the 11 sites during November 2010. At each site, we removed the natural litter and placed a total of twelve microcosms filled with birch or alder litter (six microcosms each) on the soil surface, yielding a total of 132 Fig. 1. Location of study area in the Chernobyl exclusionzone. Each sampling site was localised by GPS coordinates. Eleven forest sites with similar structure and species composition but
presenting a gradient of radioactive contamination wereselected (● sites 1, 2, 3, 4, 5, 6, 7, 8, 9, 10, and 11). An additional site with a gradient of radioactive contamination over a very short
distance within a single forest was chosen (▲ site T). Themap shows the surface-ground contamination by137Cs expressed as Ci per km2(1 Ci per km2= 3.7 × 10¹⁰Bq per km2). This map also shows the location of the Chernobyl Nuclear PowerPlant ( ChNPP).
Adapted from Shestopalov (1996).
Table 1
Ambient dose rates at the forest sites (number 1 to 11) in the Chernobyl exclusion zone (Fig. 1). These measurements were conducted on the top soil using radiophotoluminescent glass dosimeters. The radionuclide concentrations measured in the soil samples collected from the top 0–10 cm layer (mean ± SE), and the average total dose rates (ATDR) estimated for decomposers are also indicated.
Sites Ambient dose rate (μGy h− 1) ATDR (μGy h− 1) Radionuclide concentrations (kBq kg− 1DM) 137Cs 90Sr 241Am 239,240Pu 238Pu 234U 238U 1 0.22 ± 0.02 0.3 0.4 ± 0.04 0.29 ± 0.05 0.008 ± 0.002 0.006 ± 0.002 0.003 ± 0.001 0.002 ± 0.001 0.002 ± 0.001 2 0.32 ± 0.04 0.9 1.6 ± 0.2 0.41 ± 0.06 0.029 ± 0.005 0.017 ± 0.004 0.007 ± 0.002 0.011 ± 0.004 0.011 ± 0.004 3 0.38 ± 0.03 1.1 2.1 ± 0.2 0.41 ± 0.06 0.028 ± 0.005 0.034 ± 0.011 0.017 ± 0.005 0.002 ± 0.000 0.001 ± 0.000 4 0.86 ± 0.06 1.8 3.5 ± 0.4 0.98 ± 0.15 0.053 ± 0.009 0.029 ± 0.006 0.029 ± 0.006 0.003 ± 0.001 0.002 ± 0.001 5 1.2 ± 0.1 2.1 7.0 ± 1.0 0.71 ± 0.11 0.038 ± 0.009 0.032 ± 0.012 0.004 ± 0.001 0.005 ± 0.001 0.004 ± 0.001 6 2.1 ± 1.1 4.6 5.6 ± 0.6 2.0 ± 0.3 0.15 ± 0.02 0.18 ± 0.06 0.090 ± 0.028 0.003 ± 0.001 0.003 ± 0.001 7 4.1 ± 0.8 7.9 6.6 ± 0.7 8.2 ± 1.2 0.29 ± 0.04 0.093 ± 0.021 0.043 ± 0.009 0.004 ± 0.002 0.003 ± 0.001 8 5.6 ± 0.4 23 25 ± 3 20 ± 3 0.91 ± 0.13 0.35 ± 0.11 0.16 ± 0.05 0.006 ± 0.001 0.003 ± 0.001 9 7.3 ± 0.4 21 34 ± 3 13 ± 2 0.98 ± 0.13 0.28 ± 0.06 0.13 ± 0.03 0.004 ± 0.001 0.002 ± 0.001 10 12 ± 1 75 57 ± 6 90 ± 14 2.3 ± 0.3 0.60 ± 0.16 0.26 ± 0.07 0.006 ± 0.002 0.004 ± 0.001 11 15 ± 1 43 38 ± 4 50 ± 8 1.5 ± 0.2 0.28 ± 0.04 0.12 ± 0.02 0.010 ± 0.002 0.006 ± 0.001 MCI 62.0 ± 5 35.0 ± 5 1.5 ± 0.13 0.8 ± 0.15 0.4 ± 0.08 0.1 ± 0.05 0.1 ± 0.05
DM: dry mass of soil.
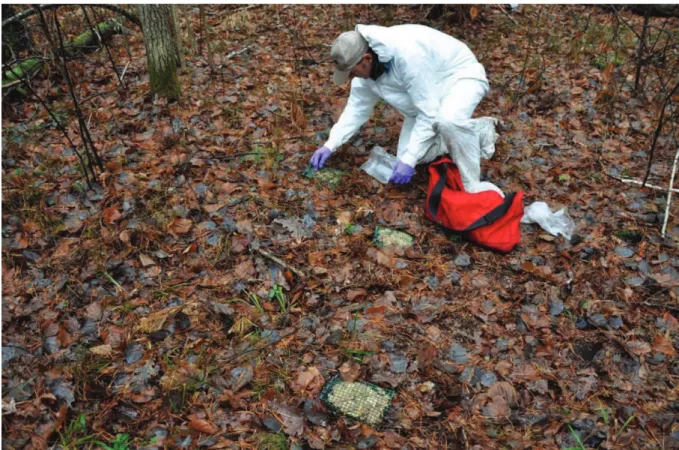
microcosms (3 replicate microcosms × 2 litter species × 2 harvest dates × 11 sites). Half of all microcosms were removed after 162 days (i.e. at the end of April 2011), and the other half after 321 days of expo-sure (i.e. in early October 2011). A total of 37 microcosms were lost probably due to wildlife activity. Ten litter bags were filled with 7 ± 0.10 g of silver birch litter (dry mass; average ± 1 SD), and placed at each of the six sampling points in November 2010, (see material and methods in the Supplementary text: Fig. A.2). Litter bags were retrieved after 318 days of exposure in the field. Upon litter harvest, remaining leaf litter was gently rinsed with water to remove adhering soil parti-cles, dried at 60 °C for 48 h and weighed. Conversion of air dry to oven dry initial litter mass was done based on five subsamples of initial litter. 2.3. Soil sampling
We randomly collected 10 soil cores (2.5 cm in diameter × 10 cm deep) at each of the eleven forest sites in April 2011. Soil samples were sieved (2 mm mesh) and pooled across the 10 samples per site. Similarly, we collected 15 soil cores from the six points along the tran-sect at site T (sieved at 2 mm and pooled per sampling point) in October 2011. Following the method by Lecomte-Pradines et al. (2014), sub-samples of these pooled soil sub-samples were used to analyse soil charac-teristics (moisture, pH, total organic carbon (Corg), particle size
distribu-tion (PSD): Table 3, and radionuclide concentradistribu-tions; see material and methods in the Supplementary text for detailed description of these methods).
2.4. Ambient radiation levels and radionuclide concentrations in soil Radiophotoluminescent (RPL) glass dosimeters (Chiyoda Technol Corporation, Japan, model GBFJ01) with an FGD-660 reader (mea-suring only energy gamma radiation) were used for in situ monitor-ing of the ambient radiation dose at each site (Juto, 2012). RPL dosimeters were placed on the soil surface beside six randomly se-lected microcosms at each site, and of six randomly sese-lected litter bags at each sampling point of site T. The dosimeters integrated radi-ation dose over 6 months (left in the field from April to September). All analyses were performed by the Dosimetry Laboratory (IRSN,
France). In parallel, the “background” correction was assessedvia
five RPL dosimeters transported from IRSN (Saint-Paul-lez-Durance,
France) to the International Radiological Laboratory-SSRI (Slavutych,
Ukraine) and left there for the duration of the study.
The measurement of radionuclide (137Cs,90Sr,238Pu,239 + 240Pu,
234
U,238U, and241Am) content in soil samples was carried out in
the IRL-SSRI laboratory (Slavutych, Ukraine) using standard methods
(see materials and methods in the Supplementary text).
2.5. Decomposer total dose rate estimations
We also estimated the total absorbed dose rate (TDR) by decom
-posers considering both external and internal irradiation pathways.
Moreover, unlike RPL dosimeter data, these estimates allow consid
er-ation of the contribution of all radionuclides and radier-ation types
(alpha, beta and gamma) (Lecomte-Pradines et al., 2014).
The TDR corresponds to the energy deposited into the body of
de-composers per unit of time. Considered radiation sources are external
(i.e. surrounding contaminated environment such as soil), and internal
(following ingestion, or dermal absorption). This latter exposure pa
th-way appears relevant as decomposer organisms spend a considerable amount of time in intimate contact with the soil, ingest soil particles
and feed also in the surroundings of the field microcosms and litterbags
filled with un-contaminated leaf litter. The intensity of this depositis a
function of radiation energy, as well as of the organisms' shape, com
po-sition, and behaviour (Beaugelin-Seiller et al., 2006).
We limited the TDR estimates to four key groups of organisms
influencing decomposition: microorganisms, as the predominant
de-composers, nematodes and earthworms as two groups of inverte-brates living mainly in soil, and isopods living and feeding inthe
litter layer. From these group-specific TDRs, we estimated the aver-age TDRs of decomposers (ATDR). We estimated the radionuclide
ac-tivities for each of the four groups of decomposers from thesoil
activity concentrations by applying equilibrium-based concentr
a-tion ratios (CRs). These values were taken from the ERICA tool d
ata-base (Version 1.2.0 — Updated 2010.12.01 for detritivorous invertebrate, Beresford et al., 2007) (Supplementary Table A.1).We
then calculated external and internal dose conversion coefficients
Table 2
Ambient dose rates at the six stations along the transect located on the forest site named T in the Chernobyl exclusionzone (Fig. 1). These measurements were conducted on the top soil using radiophotoluminescent glass dosimeters. The radionuclide concentrations measured in the soil samples collected from the top0–10 cm layer, and the average total dose rates (ATDR) estimated for decomposers are also indicated.
Stations Ambient dose rate (μGy h− 1) ATDR (μGy h− 1) Radionuclide concentrations (kBq kg− 1DM) 137Cs 90Sr 241Am 239,240Pu 238Pu 234U 238U A 1.2 ± 0.03 23 15 ± 3 17 ± 2 1.5 ± 0.7 0.34 ± 0.05 0.16 ± 0.02 0.005 ± 0.001 0.004 ± 0.001 B 1.4 ± 0.05 24 14 ± 3 21 ± 4 1.3 ± 0.7 0.40 ± 0.11 0.19 ± 0.05 0.004 ± 0.001 0.003 ± 0.001 C 3.3 ± 0.08 63 45 ± 4 83 ± 16 0.58 ± 0.08 0.99 ± 0.27 0.43 ± 0.11 0.006 ± 0.001 0.005 ± 0.001 D 6.0 ± 1.01 80 80 ± 3 97 ± 5 1.0 ± 0.2 1.1 ± 0.1 0.48 ± 0.04 0.006 ± 0.001 0.004 ± 0.001 E 12 ± 1 150 128 ± 13 210 ± 70 1.5 ± 0.4 1.2 ± 0.4 0.53 ± 0.19 0.008 ± 0.001 0.004 ± 0.001 F 29 ± 2 91 129 ± 23 92 ± 24 2.6 ± 0.6 0.69 ± 0.20 0.27 ± 0.10 0.010 ± 0.001 0.004 ± 0.001 MCI 42.7 ± 3.4 54.5 ± 3.4 1.8 ± 0.7 0.69 ± 0.13 0.01 ± 0.002 0.01 ± 0.002 0.005 ± 0.002
DM: dry mass of soil.
MCI corresponds to the mean contribution in % for each isotope to the total activity ± SE.
Table 3
Physico-chemical characteristics of the soil in 11 forest sites, and in 6 stations along a transect in a forest with a gradient of radionuclide contamination (=site T).
Forest sites (sites 1 to 11) Transect (site T, points A to E)
Mean ± SD Median Range Mean ± SD Median Range
SM (% H2O) 20.2 ± 7.9 18.4 8.7–32 39.6 ± 9 43.1 21–49
Soil pH 4.3 ± 0.5 4.2 3.6–5.2 3.6 ± 0.1 3.5 3.5–3.8
Corg(mg∙g− 1DW) 12.0 ± 8.4 9.2 8.7–32 39.0 ± 12 42.6 15–50.4
PSD (DV50, μm) 168.2 ± 68.0 204.8 56–243.4 132.4 ± 28 115.0 113.5–189
(DCCs) for each combination (radionuclide, decomposer) according to ecologically plausible exposure scenarios (Supplementary Table A.2) using EDEN software version 2.3 (Beaugelin-Seiller et al., 2006). DCCs allow conversion of the activity of a radionuclide in an organism (Bq unit mass− 1) into a dose rate (Gy unit time− 1) and
are thus specific for each radionuclide-organism combination. At the end, we calculated TDR absorbed by each of the four groups of decomposers, expressed in μGy h− 1(for more detailed information
see Supplementary text: Total dose calculations). 2.6. Statistical analyses
Linear regressions were run to estimate the consistency between external radiation levels (μGy h− 1) measured by RPL dosimeters and
estimated ATDRs.
To assess the relationship between leaf litter mass loss and ATDRs we ran analyses of covariance (ANCOVA). The ANCOVA allowed us to determine whether there were any significant differences between the means of independent groups, while accounting for potential con-founding factors (i.e. soil moisture, pH, Corg, particle size distribution).
These four environmental variables were incorporated in the model as one variable based on the coordinates from the first axis of a principal component analysis, which accounted for 65% and 80% of the total var-iance for the 11 forest sites and site T, respectively. In the analysis for the 11 forest sites, ATDRs, tree species identity of leaf litter and sampling dates were treated as fixed factors and soil physico-chemical character-istics as covariates. For site T, we ran a similar ANCOVA with ATDRs as the fixed factor and soil physico-chemical characteristics as covariates. Following the ANCOVAs, when a significant effect of ATDR on leaf litter mass loss was found, we ran a simple linear regression to further ex-plore the relationship between these two variables. Percentages of leaf mass loss were log10transformed prior to analyses to meet the
condi-tions of the analyses, i.e., being normally distributed and having homo-geneous variance. All statistical analyses were performed using the statistical software SPSS version 19 (IBM).
3. Results
3.1. Soil radionuclide concentrations and estimated decomposer total dose rates
137Cs,90Sr,241Am, and238,239,240Pu concentrations in the top soil
(upper 10 cm) increased from site 1 to site 11 (Table 1).137Cs and 90Sr dominated activity concentrations with an average of 62.0 ± 5%
and 35.0 ± 5% of the total activity concentration, respectively (Table 1). With ambient dose rates measured at the soil surface with RPL do-simeters ranging from 0.22 to 15 μGy h− 1, the ATDRs at the eleven
for-est sites varied from 0.3 to 75 μGy h− 1(Table 1). External dose rates
measured with RPL dosimeters and ATDR values were positively related (ATDR = 4.06 × RPL −1.52; r2
= 0.87, p b 0.001). The estimated ATDRs were three-fold higher than RPL dosimetry measurements on average. As for the eleven forest sites, the activity concentrations of isotopes measured in soil samples at site T were also dominated by137Cs and 90Sr, which contributed 42.7 ± 3.4% and 54.5 ± 3.4% to the total activity
concentration (Table 2). While the activity concentrations of234,238U at
site T were comparable to those measured at the eleven forest sites, the activity concentrations of90Sr,137Cs,241Am, and238,239,240Pu were
con-siderably higher at site T (Tables 1 and 2). Ambient dose rates at the soil surface ranged from 1.2 to 29 μGy h− 1along the contamination gradient
at site T, which corresponds to a gradient in ATDRs between 23 and 150 μGy h− 1(Table 2). Again, dosimeter determined RPL and ATDR
values showed a positive relationship (ATDR = 2.39 × RPL + 45.87; r2
= 0.59, p b 0.001). However, ATDRs were considerably higher than RPL dose rates compared to the eleven forest sites with an average fourteen-fold higher ATDR compared to RPL dose rates.
3.2. Leaf litter mass loss
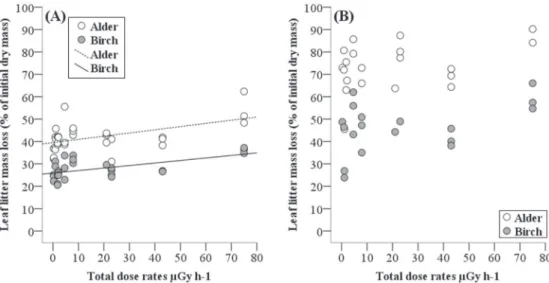
At the eleven forest sites, leaf litter from alder decomposed more rapidly than that from birch, irrespectively of sampling date and ATDRs (no significant interactions; Supplementary Table A.3). Not sur-prisingly, mass loss increased with time for litter from both tree species (p b 0.001; Supplementary Table A.3 Fig. 2A, B). After 162 days of expo-sure, the mean litter mass loss varied between 34 and 54%, and between 22 and 36%, for alder and birch, respectively. After 321 days of exposure, the species differences were essentially the same with a faster decom-position of alder leaf litter (45 to 87% mean mass loss) than birch leaf lit-ter (25 to 59% mean mass loss; Fig. 2B). The physico-chemical soil parameters were not associated with mass loss (p = 0.928; Supplemen-tary Table A.3), but there was a significant positive effect of ATDRs on mass loss (p b 0.001; Supplementary Table A.3). However, the effect of ATDR differed between sampling dates (ATDRs × sampling date, p b 0.001; Supplementary Table A.3). During the initial stage of decom-position, leaf litter from both tree species decomposed more rapidly with increasing ATDRs (Fig. 2A). In contrast, during the second stage of decomposition, ATDR had no longer a significant effect on mass loss of either species (Fig. 2B).
At site T, mass loss of birch leaf litter varied on average between 44 and 57% after 318 days of exposure in the field. This variation was signif-icantly related to ATDR, with mass loss increasing with ATDR (Fig. 3). Similar to the eleven forest sites, we observed no association of the soil physico-chemistry with mass loss (p = 0.647; Supplementary Table A.4).
4. Discussion
We initially hypothesized that long-term radiation exposure due to the Chernobyl accident, and thus a higher dose of radiation absorbed by decomposers in the Chernobyl exclusion zone (CEZ), would have negative effects on leaf litter decomposition. Our data do not support this hypothesis, as decomposition of leaf litter from two dominant tree species, birch and alder, increased with total dose rates estimated for decomposers (ATDRs). At the relatively large spatial scale covered by the eleven different forest sites, the positive relationship between exposure to radiation and litter mass loss was observed during the initial stage of decomposition, but disappeared after almost a year of decomposition in the field (Fig. 2). These responses were the same for the more rapidly decomposing alder litter and the more slowly decomposing birch litter, indicating that species identity and overall quality of the leaf litter had no apparent impact on how radioactivity af-fected decomposition. Contrary to our findings, a previous study on leaf litter decomposition around Chernobyl including rather slowly decomposing leaf litters (e.g. Quercus robur and Pinus sylvestris) showed a negative relationship between litter mass loss and the level of ambient radiation (Mousseau et al., 2014). These authors reported up to 40% lower mass losses in the most contaminated sites (ca. 240 μGy h− 1)
compared to sites with a normal background radiation level for Ukraine (ca. 0.09 μGy h− 1) after 9 months of field exposure.
What could be the reasons for these contrasting results? An inherent difficulty with this type of field study is that other potentially confound-ing factors vary along with the studied independent variable – here ATDRs – that could influence the response variable, but which are diffi-cult to control. For example, soil pH, which has a major impact on soil processes ranged from 3.1 to 7.8 among sites in Mousseau et al.'s (2014) study, and from 3.6 to 5.2 in our study, which is a considerably smaller range (1.6 pH units in our study compared to 4.7 pH units in the previous study). Even though we accounted for some environmen-tal factors in our statistical models – as did Mousseau et al. (2014) – and did not see any indication of confounding effects, we cannot exclude the possibility that some unidentified factors could have had some influ-ence. Our second gradient of varying radiation levels was at a much smaller spatial scale, and thus reduced environmental heterogeneity
and the potential for confounding factors substantially. Along this addi-tional gradient varying in soil radionuclide contamination from 14 to 129 kBq kg− 1 137Cs DM over b2 km (Table A.2) within the same forest
with identical structure and species composition, we observed the same positive relationship between mass loss of birch leaf litter (Fig. 3) and ATDRs, confirming our findings from the eleven forest sites.
One of the most important differences between our study and that of Mousseau et al. (2014) was the range in radiation levels. The sites selected by Mousseau et al. (2014) differed between 0.09 and
240 μGy h− 1 compared to our study sites ranging from 0.22 to
29 μGy h− 1. Actually, two sites among the most contaminated in
Mousseau et al.'s (2014) study appeared to drive the negative relation-ship between mass loss and radiation level. This might suggest a thresh-old in contamination, above which the decomposer abundance and community composition might be affected more negatively by soil ra-dioactive contamination. However, despite the use of more recalcitrant
litter material than in our study, Mousseau et al. (2014) reported 55 to 60% mass loss after 270 days of exposure in the field at the most con-taminated sites, which is rather higher than what we observed for birch leaf litter after N300 days at the lowest contamination in both gra-dients. Actually, the data reported by Mousseau et al. (2014) suggest that leaf litter decomposition at some of the most contaminated sites around Chernobyl proceeds at rates comparable or higher to what is reported in the literature for the same or similar tree species at sites without any radioactive contamination (e.g. Berg et al., 1993; Prescott et al., 2000).
Previous studies investigating the effects of ionizing radiation on groups of organisms involved in litter decomposition showed weak or no effects. For instance, Murphy et al. (2011) found no relationship be-tween ambient radiation dose rates (ranging from 0.1 to 30 μGy h− 1)
and the abundance and diversity of aquatic invertebrate communities sampled in eight lakes affected by Chernobyl fallout 17 years after the nuclear accident. Chapon et al. (2012) showed that both highly and weakly radio-contaminated soils host a wide diversity of bacteria, sug-gesting that long-term exposure to radionuclides does not lead to the erosion of bacterial diversity. Lecomte-Pradines et al. (2014) also found little effect from exposure to radiation in nematode abundance on soil samples collected at 18 forest sites (including the eleven sites studied here) in the CEZ ranging in ATDRs between 0.7 and 220 μGy h− 1in 2011. Overall, these previous studies indicate that
dose rates of up to around 30 μGy h− 1– equivalent to 150 μGy h− 1
ATDRs – are unlikely to negatively affect the diversity and abundance of decomposer organisms. In contrast, the abundance of above-ground insects and spiders may be more susceptible to radiation (Møller and Mousseau, 2009).
Another potential reason for conflicting results may be related to technical aspects of the measurements. The contamination level mea-sured with RPL dosimeters or instantaneous measurements with porta-ble dosimeters may not provide biologically relevant information. For instance, the same dose rates of 12 ± 1 μGy h− 1we measured with
RPL dosimeters both at site 10 of the spatially larger gradient and site E in the spatially narrow transect corresponded to activity concentra-tions of137Cs of 57 ± 6 kBq kg− 1DM at site 10, and of 128 ±
13 kBq kg− 1DM at site E, i.e. about twice as high than at site 10
(Tables 1 and 2). The differences in90Sr,238,239,240Pu between these two sites showed the same trend. Such a disconnection between dosim-eter data and activity concentrations may result from the presence of highly radioactive fine particles (IAEA, 1996; Zheltonozhsky et al., Fig. 2. Mass loss of leaf litter (percent of initial dry mass) from the two tree species birch (Betula pendula) and alder (Alnus glutinosa) as a function of the average total dose rates estimated for decomposers (ATDRs, μGy h−1) at eleven different forest sites. (A) Mass loss after 162 days of exposure, and (B) after 321 days of exposure in the field. Lines represent simple linear
regressions: alder: F1,29= 9.689, p = 0.004, mass loss = 1.595 + 0.001 × ATDR, r2= 0.25; birch: F1,25= 12.019, p = 0.002, mass loss = 1.411 + 0.002 × ATDR, r2= 0.32 (A); not
significant (B).
Fig. 3. Mass loss of birch leaf litter (percent of initial dry mass after 318 days of exposure in the field) as a function of the average total dose rates estimated for decomposers (ATDRs, μGy h− 1) along a 1500 m transect located within a single forest stand. The black line
represents a simple linear regression (F1,57= 12.554, p = 0.001, mass loss =
2001), called “hot particles”, in soil samples collected at site T, which did not influence very much the field measurements with RPL dosimeters, but which were detectable by spectrometry. The presence of hot parti-cles at site T likely originates from the radioactive cloud following the first thermal explosion of the reactor 4, which generated a huge amount of fuel particles (Kashparov et al., 2003). Site T is located at 3.5 km of the West tip of the area known as Chernobyl's “Red forest”, which is one of the most contaminated areas of the CEZ (Shestopalov, 1996). Also, ATDR estimates integrate the contribution of all radiation types (alpha, beta and gamma emitters) from all exposure pathways (internal and exter-nal) as opposed to ambient external dose rates measured with RPL do-simeters or a portable dosimeter, which were commonly used in previous studies (e.g. Møller and Mousseau, 2009; Mousseau et al., 2014). For an accurate assessment of the effects of radioactive pollution on biological processes, the total dose rates absorbed by organisms (here decomposer communities) are hence more meaningful than in-stantaneous dosimeter measurements, which mainly assess gamma ra-diation. This is particularly critical when several radioactive isotopes are present, with241Am,238,239,240Pu,234,238U being essentially α-emitter, 90Sr β-emitter, and137Cs γ, β-emitter.
Our finding of increasing mass loss of decomposing birch and alder leaf litter with increasing chronic irradiation is quite unexpected. Two non-exclusive mechanisms can be evoked which could potentially ex-plain this surprising result. (i) Under any type of moderate stress (here radiological stress) organisms may overcompensate the impact of disturbance with increasing fitness, known as “hormetic effect” (Calabrese and Baldwin, 2002). For example, along a gradient of heavy metals concentrations (Zn, Cu, and Cd) in forest soils, Skubala and Kafel (2004) showed that the highest abundance of Oribatida, Gamasida, Actinedida, Acaridida, and Collembola was observed in forest characterized by moderate contamination of heavy metals, implying an increase in mesofauna abundance up to a certain level of metallic loads. Similarly, Bezrukov et al. (2015) reported positive relationships be-tween radiation and abundance of some invertebrate taxa (Acari, Araneae, Formica sp., Homoptera) sampled with pit-fall traps at differ-ent sites within CEZ with ambidiffer-ent dose rates ranging from 0.13 to 360 μGy h− 1. Finally, Galván et al. (2014) observed that oxidative stress
and DNA damage decreased in wild birds exposed to chronic low-dose radiation at CEZ. They concluded that birds may adapt to chronic expo-sure to ionizing radiation with a hormetic response. (ii) Because we used leaf litter material from uncontaminated control sites, decom-posers may have preferred this exogenous leaf litter material over local leaf litter which may have a lower overall quality. Leaf litter quality is a major factor affecting decomposer communities (e.g. Melillo et al., 1982; Cornwell et al., 2008). Similar to the negative effect of heavy metal pollution on leaf litter quality and subsequently reduced decom-position rates (Killham and Wainwright, 1981; Berg et al., 1991; McEnroe and Helmisaari, 2001; Johnson and Hale, 2004), exposure to radionuclides may negatively affect leaf litter quality. Having the choice between the locally produced leaf litter material and the uncontaminat-ed leaf litter of potentially higher quality, decomposer organisms may have shown a preference for the latter. Such a preference effect would be expected to increase with increasing radioactive exposure, i.e. de-creasing local litter quality, which is in line with our observations. To test this hypothesis, future studies should assess quality differences along contamination gradients and compare decomposition between locally produced and exogenous leaf litter.
5. Conclusion
Our results suggest that in the CEZ forest ecosystems, 25 years after the Chernobyl nuclear accident, decomposition of leaf litter from the two dominant tree species black alder and silver birch was not negative-ly affected by chronic exposure to ionizing radiation of decomposers with ATDRs of up to 150 μGy h−1. Rather, our data indicate that leaf
lit-ter mass loss may increase with increasing ATDRs possibly resulting
from overcompensation of decomposer organisms exposed to radionu-clides, or from preferred feeding on the uncontaminated leaf litter we used in our study. Field studies exploring the potential effects of radioactive pollution on litter decomposition are extremely rare and they report conflicting results (this study and Mousseau et al., 2014). More investigations are needed for the understanding of underlying mechanisms of how radioactive contamination affects decomposition and other ecosystem processes in CEZ but also in other radio-contaminated areas like in Fukushima (Japan).
Conflicts of interest
There are no conflicts of interest in this work. Acknowledgements
We are grateful to Igor Chizhevsky for technical assistance with sam-pling and Frédéric Coppin for the physico-chemical characterisation of the soil. Thanks to Laurent Garcia-Sanchez for discussion regarding sta-tistical analyses. We are also indebted to Jim Hodges for his invaluable advice on the statistical analyses and the many discussions we had. We also thank Chi-ping Li, and Jim Hodges for comments and correcting the English. This project was supported by a collaborative agreement between International Radiological Laboratory-SSRI (Ukraine) and Institut de Radioprotection et de Sûreté Nucléaire (IRSN, France). Appendix A. Supplementary data
Supplementary data to this article can be found online at http://dx. doi.org/10.1016/j.scitotenv.2016.04.006.
References
Barantal, S., Roy, J., Fromin, N., Schimann, H., Hättenschwiler, S., 2011. Long-term presence of tree species but not chemical diversity affect litter mixture effects on decomposi-tion in a neotropical rainforest. Oecologia 167, 241–252.
Bardgett, R.D., 2005. The Biology of Soil: A Community and Ecosystem Approach. Oxford University Press.
Beaugelin-Seiller, K., Jasserand, F., Garnier-Laplace, J., J-C, Gariel, 2006. Modelling the ra-diological dose in non-human species: principles, computerization and application. Health Phys. 90, 485–493.
Beresford, N.A., Brown, J., Copplestone, D., Garnier-Laplace, J., Howard, B., Larsson, C.M., Oughton, D., Pröhl, G., Zinger, I. (Eds.), 2007. An Integrated Approach to the Assess-ment and ManageAssess-ment of EnvironAssess-mental Risks From Ionizing Radiation. Description of Purpose, Methodology and Application EC Project Contract No FI6R-CT-2004-508847 (https://wikicehacuk/download/attachments/115017395/D-Ericapdf). Berg, B., Berg, M.P., Bottner, P., Box, E., Breymeyer, A., Calvo de Anta, R., Couteaux, M.,
Escudero, A., Gallardo, A., Kratz, W., Madeira, M., Mälkönen, E., McClaugherty, C., Meentemeyer, V., Muñoz, F., Piussi, P., Remacle, J., Virzo De Santo, A., 1993. Litter mass loss rates in pine forests of Europe and eastern United States: some relation-ships with climate and litter quality. Biogeochemistry 20, 127–159.
Berg, B., Ekbohm, G., Söderstrom, B., Staaf, H., 1991. Reduction of decomposition rates of scots pine needle litter due to heavy metal pollution. Water Air Soil Pollut. 59, 165–177.
Bezrukov, V., Møller, A,.P., Milinevsky, G., Rushkovsky, S., Sobol, M., Mousseau T, A., 2015. Heterogeneous relationships between abundance of soil surface invertebrates and ra-diation from Chernobyl. Ecol. Indic. 52, 128–133.
Cadish, G., Giller, K.E., 1997. Driven by Nature: Plant Litter Quality and Decomposition. CAB Int, Wallingford (432 pp.).
Calabrese, E.J., Baldwin, L.A., 2002. Defining hormesis human and experimental. Toxicolo-gy 21, 91–97.
Chapon, V., Piette, L., Vesvres, M.-H., Coppin, F., Le Marrec, C., Christen, R., Theodorakopoulos, N., Février, L., Sviatoslav, L., Martin-Garin, A., Berthomieu, C., Sergeant, C., 2012. Microbial diversity in contaminated soils along the T22 trench of the Chernobyl experimental platform. Appl. Geochem. 27, 1375–1383.
Cornwell, W.K., Cornelissen, J.H.C., Amatangelo, K., Dorrepaal, E., Eviner, V.T., Godoy, O., Hobbie, S.E., Hoorens, B., Kurokawa, H., Pérez-Harguindeguy, N., Quested, H.M., Santiago, L.S., Wardle, D.A., Wright, I.J., Aerts, R., Allison, S.D., Van Bodegom, P., Brovkin, V., Chatain, A., Callaghan, T.V., Diaz, S., Garnier, E., Gurvich, D.E., Kazakou, E., Klein, J.A., Read, J., Reich, P.B., Soudzilovskaia, N.A., Vaieretti, M.V., Westoby, M., 2008. Plant species traits are the predominant control on litter decomposition rates within biomes worldwide. Ecol. Lett. 11, 1065–1071.
Dighton, J., Tugay, T., Zhdanova, N., 2008. Fungi and ionizing radiation from radionuclides. FEMS Microbiol. Lett. 281, 109–120.
Galván, I., Bonisoli-Alquati, A., Jenkinson, S., Ghanem, G., Wakamatsu, K., Mousseau, T.A., Møller, A.P., 2014. Chronic exposure to low-dose radiation at Chernobyl favours ad-aptation to oxidative stress in birds. Funct. Ecol. 28 (6), 1387–1403.
Geras'kin, S.A., Evseeva, T., Oudalova, A., 2013. Effects of long-term chronic exposure to ra-dionuclides in plant populations. J. Environ. Radioact. 121, 22–32.
Geras'kin, S.A., Fesenko, S.V., Alexakhin, R.M., 2008. Effects of non-human species irradia-tion after the Chernobyl NPP accident. Environ. Int. 34, 880–897.
Gessner, M.O., Swan, C.M., Dang, C.K., McKie, B.G., Bardget, R.D., Wall, D.H., Hättenschwiler, S., 2010. Diversity meets decomposition. Trends Ecol. Evol. 25, 372–380.
IAEA, 1996. 10 years on-the accident at the Chernobyl atomic energy power plant and its consequences. Summary Report on the Post-Accident Review Meeting on the Cher-nobyl Accident, International Atomic Energy Agency, Vienna; IAEA Safety Series N 75-INSAG-1.
IAEA, 2001. Present and future environmental impact of the Chernobyl accident. Interna-tional Atomic Energy Agency; IAEA-TECDOC-1240; ISSN 1011-4289.
IAEA, 2006. Environmental consequences of the Chernobyl accident and their remedia-tion: twenty years of experience. Report of the UN Chernobyl Forum Expert Group “Environment” (EGE). International Atomic Energy Agency, Vienna.
Johnson, D., Hale, B., 2004. White birch (Betula papyrifera Marshall) foliar litter decompo-sition in relation to trace metal atmospheric inputs at metal-contaminated and un-contaminated sites near Sudbury, Ontario and Rouyn-Noranda, Quebec, Canada. Environ. Pollut. 127, 65–72.
Juto, N., 2012. The large scale personal monitoring service using the latest personal mon-itor glass badge. Proceeding of AOCRP-1, Korea, 20–24 October.
Kashparov, V.A., Lundin, S.M., Zvarych, S.I., Yoshchenko, V.I., Levchuk, S.E., Khomutinin, Y.V., Maloshtan, I.M., Protsak, V.P., 2003e. Territory contamination with the radionuclides representing the fuel component of Chernobyl fallout. Sci. Total Environ. 317, 105–119. Killham, K., Wainwright, M., 1981. Deciduous leaf litter and cellulose decomposition in
soil exposed to heavy metal atmospheric pollution. Environ. Pollut. A 26, 79. Krivolutsky, D.A., 1996. Dynamics of biodiversity and ecosystems under conditions of
ra-dioactive contamination. Dokl. Bolg. Akad. Nauk 347, 166–168.
Krivolutsky, D.A., 2000. Problems of sustainable development and ecological indication in radioactively contaminated areas. Russ. J. Ecol. 31, 233–237.
Lecomte-Pradines, C., J-M, Bonzom, Della-Vedova, C., Beaugelin-Seiller, K., Villenave, C., Gaschak, S., Coppin, F., Dubourg, N., Maksimenko, A., Adam-Guillermin, C., Garnier-Laplace, J., 2014. Soil nematode assemblages as bioindicators of radiation impact in the Chernobyl Exclusion Zone. Sci. Total Environ. 490, 161–170.
Maksimova, S., 2002. The effect of radioactive contamination caused by the Chernobyl nu-clear accident on Diplopoda communities. Acta Zool. Litua. 12, 90–94.
McEnroe, N.A., Helmisaari, H.S., 2001. Decomposition of coniferous forest litter along a heavy metal pollution gradient, south-west Finland. Environ. Pollut. 113, 11–18. Melillo, J.M., Aber, J.D., Muratore, J.F., 1982. Nitrogen and lignin control of hardwood leaf
litter decomposition dynamics. Ecology 63, 621–626.
Møller, A.P., Mousseau, T.A., 2006. Biological consequences of Chernobyl: 20 years on. Trends Ecol. Evol. 21, 200–207.
Møller, A.P., Mousseau, T.A., 2009. Reduced abundance of insects and spiders linked to ra-diation at Chernobyl 20 years after the accident. Biol. Lett. 5, 356–359.
Mousseau, T.A., Milinevsky, G., Kenney-Hunt, J., Møller, A.P., 2014. Highly reduced mass loss rates and increased litter layer in radioactively contaminated areas. Oecologia 175, 429–437.
Murphy, J.F., Nagorskaya, L.L., Smith, J.T., 2011. Abundance and diversity of aquatic mac-roinvertebrate communities in lakes exposed to Chernobyl-derived ionizing radia-tion. J. Environ. Radioact. 102, 688–694.
Prescott, C.E., Zabek, L.M., Staley, C.L., Kabzems, R., 2000. Decomposition of broadleaf and needle litter in forests of British Columbia: influences of litter type, forest type, and litter mixtures. Can. J. For. Res. 30, 1742–1750.
Romanovskaya, V.A., Sokolov, I.G., Rokitko, P.V., Chernaya, N.A., 1998. Effect of radioactive contamination on soil bacteria in the 10-km zone around the Chernobyl nuclear power plant. Microbiology 67, 226–231.
Shestopalov, V.M., 1996. Atlas of Chernobyl Exclusion Zone Kiev. Ukrainian Academy of Science, Ukraine.
Skubala, P., Kafel, A., 2004. Oribatid mite communities and metal bioaccumulation in orib-atid species (Acari, Oriborib-atida) along the heavy metal gradient in forest ecosystems. Environ. Pollut. 132, 51–60.
Swift, M.J., Heal, O.W., Anderson, J.M., 1979. Decomposition in Terrestrial Ecosystems. Univ Calif Press, Berkeley (509 pp.).
Waring, R.H., Schlesinger, W.H., 1985. Forest Ecosystems: Concepts and management. Ac-ademic Press, Orlando 0127354409 (340 pp.).
Zaitsev, A.S., Gongalsky, K.B., Nakamori, T., Kaneko, N., 2014. Ionizing radiation effects on soil biota: application of lessons learned from Chernobyl accident for radioecological monitoring. Pedobiologia 57, 5–14.
Zheltonozhsky, V., Mück, K., Bondarkov, M., 2001. Classification of hot particles from the Chernobyl accident and nuclear weapons detonations by non-destructive methods. J. Environ. Radioact. 57, 151–166.
603 J.-M. Bonzom et al. / Science of the Total Environment 562 (2016) 596–603
Appendix A.
1. Supplementary text: Materials and methods
1.1. Study sites
The Chernobyl Exclusion Zone (CEZ) is located in Northern Ukraine, and corresponds to a
90 km WE x 45 km SN enclosed and abandoned area. It is characterized by a continental
climate with fairly severe winters and warm summers. Based on data recorded by local
meteorological stations mean (± SD) ambient temperature was 7.9°C ± 9.8 (min = -21.0, max
= 31.9°C), with a January mean of -2.5°C ± 3.4, and a July mean of 21.2°C ± 3.1).
Fig. A.1. The bottom of each microcosm was left open and two 5 x 15 cm windows covered
with 1cm nylon mesh were opened on the side at the level of the soil surface, allowing free
passage to soil and litter layer invertebrates but avoiding lateral loss of leaf litter. The top of
the microcosm was covered with a smaller mesh (0.05 cm), to avoid contamination with
autochthonous litter dropping from the canopy. Microcosms were slightly inserted into the top
soil, between 0.5 and 1 cm with a distance of about 2 m between individual microcosms. The
natural litter removed for microcosm placement was then evenly distributed around the
microcosms to provide a continuous litter layer (photos: Jean-Marc Bonzom/IRSN)
Fig. A.2. The litter bags (15 × 15 cm) at site T were constructed from rigid plastic mesh of
1cm mesh width. They were placed flat on soil surface with a distance of about 2 m between
individual litter bags after the natural litter was removed (photos: Jean-Marc Bonzom/IRSN)
1.3. Soil characteristics
Soil moisture was determined by drying 100 g of fresh soil at 105°C for 48h. Soil pH was
measured in the supernatant after 1 hour of addition of 10 mL distilled water to 1 g of soil,
using a pH glass electrode (WTW-pH320). Soil extractable organic carbon (C
org) was
determined by dispersing 0.1 g of soil in a 0.1 M NaOH solution (1 mL) for 15 h. After
decantation and centrifugation (10,000 g, 10 min) the organic carbon concentration in the
supernatant was determined by spectrometry (280 nm; Molecular Devices Spectramax Plus
384 Microplate reader) (Moore 1987). Particle size distribution (PSD) was determined from
0.3 g of dried soil mixed with 800 mL of ultrapure water and ultrasonicated for 3 min, using a
laser diffraction particle size analyser (Malvern Mastersizer S long bench) (Arriaga et al
2006). PSD was expressed as DV50 value, which corresponds to the median diameter (µm) of
the particles.
Activity concentration of
137Cs was measured by gamma spectrometry using a hyper-pure
germanium detector (GC 3019, Canberra-Packard), and spectra were analyzed using the
Canberra-Packard Genie-2000 software. Estimates of the activity concentrations of
90Sr,
238Pu,
239+240Pu,
234U,
238U, and
241Am were obtained following the protocols “Analytical
Procedures, Eichrom Technologies, Inc. ACW03, SRW01”, after consecutive extraction and
separation of isotopes. For details see Lecomte-Pradines et al (2014).
References
Arriaga F J, Lowery B and Mays M D, 2006. A fast method for determining soil particle
distribution using a laser instrument Soil Science 171 663-74
Lecomte-Pradines C, Bonzom J-M, Della-Vedova C, Beaugelin-Seiller K, Villenave C,
Gaschak S, Coppin F, Dubourg N, Maksimenko A, Adam-Guillermin C and
Garnier-Laplace J, 2014. Soil nematode assemblages as bioindicators of radiation impact in
the Chernobyl Exclusion Zone Sci. Total Environ. 490 161-70
Moore T R, 1987. An assessment of a simple spectrophotometric method for the
determination of dissolved organic carbon in freshwaters New Zeal. J. Mar. and
2. Supplementary Text: Total dose calculations
Total radiation dose rates absorbed by each of the four decomposers were obtained
summing internal and external contributions, applying the following equations:
TDR(d) = S
i[IDR(d,i)+EDR(d,i)]
Where
- TDR(d) total dose rate absorbed by the decomposer d exposed to all the radionuclides
of interest;
- IDR(d,i) internal dose rate absorbed by the decomposer d due to internalization of the
radionuclide i [µGy h
-1]. The radionuclides measured were
137Cs,
90Sr,
241Am,
239,240
Pu,
238Pu,
234U,
238U, and daughter products in secular equilibrium with parents
(i.e.,
137mBa for
137Cs,
90Y for
90Sr,
234Th and
234mPa for
238U) were considered in the
calculation;
- EDR(d,i) external dose rate absorbed by the decomposer d due to the presence of the
radionuclide i in its neighborhood [µGy h
-1].
IDR(d,i)=DCC
int(d,i) x CR(d,i) x A
soil(i)
- DCC
int(d,i) dose conversion coefficient for the decomposer d internally exposed to the
radionuclide i [µGy h
-1per Bq kg
-1of decomposer, fresh mass].
- CR(d,i) concentration ratio of the radionuclide i by the decomposer d (kg soil/ kg
decomposer – total body, fresh mass)
- A
soil(i) activity of the radionuclide i in soil (Bq kg
-1soil)
EDR(d,i)=[DCC
on-soil(d,i) x T
on-soil(d) + DCC
in-soil(d,i) x T
in-soil(d) + DCC
litter(d,i) x (1-(T
on-soil(d) + T
in-soil(d)))] x A
soil(i)
- DCC
on-soil(d,i) dose conversion coefficient for the decomposer d located on soil and
exposed to the radionuclide i present in soil [µGy h
-1per Bq kg
-1of soil]
- DCC
in-soil(d,i) dose conversion coefficient for the decomposer d located in the middle
of the soil layer and exposed to the radionuclide i present in soil [µGy h
-1per Bq kg
-1of soil]
- T
in-soil(d) time fraction spent in soil by the decomposer d
- DCC
litter(d,i) dose conversion coefficient for the decomposer d located in the middle of
or on the litter layer and exposed to the radionuclide i present in soil [µGy h
-1per Bq
kg
-1of soil]
To run these calculations, usual simplifying assumptions have been adopted with regard to
organism characteristics, as follows. Microorganisms are represented by a disk of 1 cm
diameter and 0.5 mm thickness. Earthworm and nematode are described by revoluti on
ellipsoids, respectively of 25 x 0.5 cm and 0.8 x 0.05 mm. The equivalent ellipsoid
corresponding to isopod is 1.5 x 0.3 x 0.6 cm. Abiotic media are represented by semi -infinite
layers of defined thickness (4 cm for litter and 20 cm for soil). Media composition and density
are indicated in Supplementary Table A.6. Oversimplifying, four different exposure scenarios
have been considered, and time spent in each micro-habitat was approximately estimated
according to organism habits (Supplementary Table A.2). Dose conversion coefficients were
estimated from organism size for each relevant exposure scenario for
137Cs,
90Sr,
241Am,
239,240Pu,
238Pu,
234U,
238U, using the IRSN tool EDEN (version 2), and including daughter
products as previously described (Supplementary Table A.5). To account for the relative
biological effectiveness of the different types of radiation, weighting factors were applied (10
for α-radiation, 3 for low-β radiation (E < 10 keV), and 1 for other β-radiation and
γ-radiation) (Pröhl et al. 2003).
Reference
Pröhl G, Brown J, Gomez-Ros J-M, Jones S, Taranenko V, Thørring H, Vives i Batlle J,
Woodhead D, 2003. Dosimetric models and data for assessing radiation exposures to
Supplementary Table A.1
Concentration ratio (CR) used for decomposers. The CR is expressed in kg dm of soil per kg
fm of organism with CRr,o =
ǡೝೞ
(where r and o refer to the radionuclide and organism of
interest; concentrations are expressed in Bq per kg dm soil and Bq per fm organism). In the
absence of any specific information, we selected the default radionuclide-specific CR values
associated with the detritivorous invertebrate organism proposed in the radioecological
parameters database of the ERICA Tool (Version 1.2.0) (Brown et al. 2008).
Reference
Brown J E, Alfonso B, Avila R, Beresford N A, Copplestone D, Pröhl G, Ulanovsky A 2008
The ERICA tool. J. Environ. Radioactiv. 99 1371-13
137
Cs
90Sr
241Am
239,240Pu
238Pu
234U
238U
Supplementary Table A.2
Time fraction each organism spent in each micro-habitat. Brackets shown the thickness of the different
microhabitats.
Microorganisms
Isopod
Nematode
Earthworm
On the litter layer (4 cm)
0.33
0
0
0
In the middle of the litter layer
0.33
0
0.33
0.33
On the soil layer (20 cm)
0.33
1
0.33
0.33
Supplementary Table A.3
Summary of ANCOVA results of the effects of average total dose rates (ATDRs) absorbed by decomposers,
tree species litter (TreeSpLitter), sampling dates (factors) and soil physico-chemical characteristics (SoilPc;
covariate) on leaf litter mass loss at the eleven forest sites.
Source
df
Mean
Square
F-value
P-value
ATDRs
10
0.023
12.039
< 0.001
TreeSpLitter
1
0.646
343.893
< 0.001
Sampling dates
1
0.639
340.230
< 0.001
SoilPc
1
1.542x10
-50.008
0.928
ATDRs x TreeSpLitter
10
0.002
1.164
0.332
ATDRs x Sampling dates
10
0.009
4.710
< 0.001
Sampling dates x TreeSpLitter
1
0.006
3.017
0.087
Error
61
0.002
Supplementary Table A.4
Summary of ANCOVA results of the effects of average total dose rates (ATDRs) absorbed by decomposers
and soil physico-chemical characteristics (SoilPc; covariate) on birch leaf litter mass loss after 318 days of
exposure along a contamination gradient located in a single forest (site T).
Source
df
Mean
Square
F-value
P-value
ATDRs
5
0.024
5.206
< 0.001
SoilPc
1
0.001
0.212
0.647
Error
52
0.005
Total
59
Supplementary Table A.5
Internal and External Dose Conversion Coefficients (DCC) (µGy h
-1per Bq kg
-1) for organisms
137