an author's https://oatao.univ-toulouse.fr/27045
https://doi.org/10.2514/6.2017-3018
Gojon, Romain and Gutmark, Ephraim J. and Mihaescu, Mihai On the response of a rectangular supersonic jet to a near-field located parallel flat plate. (2017) In: 23rd AIAA/CEAS Aeroacoustics Conference, 5 June 2017 - 9 June 2017 (Denver, United States)
On the response of a rectangular supersonic jet to a
near-field located parallel flat plate
Romain Gojon
1,∗, Ephraim Gutmark
2,†and Mihai Mihaescu
1,‡1. Department of Mechanics, Royal Institute of Technology (KTH) Linn´e FLOW Centre
Stockholm, Sweden
2. Department of Aerospace Engineering & Mechanics University of Cincinnati
Cincinnati, United States
In this paper, the flow and acoustic fields of a rectangular over-expanded supersonic jet interacting with a parallel plate are investigated using compressible LES. The jet exits from
a converging diverging rectangular nozzle of aspect ratio 2 with a design Mach number 1.5.
Four simulations with four different distances between the lower inner lip of the rectangular jet in the minor axis plane and the plate ranging from 0 to 3 equivalent diameters are performed. The geometry of the nozzle, the positions of the plate, and the exit conditions are chosen in order to match those in an experimental study conducted at the University of Cincinnati. Snapshots and mean velocity fields are first presented. A good agreement with the PIV experimental measurements is found. The overall sound pressure levels are then plotted along the minor and major axis. In a previous paper, the corresponding free jet has been found to undergo a strong flapping motion in the minor axis plane due to the screech feedback mechanism. In the present study, it is seen that the intensity of the screech feedback mechanism increases for some distances from the ground and decreases for some others, as compared to the corresponding free jet. A study of the jets shear-layers is then proposed, first by looking at two points space-time cross correlations of the
axial velocity. The convection of the turbulent flow structures is thus studied. Then,
two points space-time cross correlations of the pressure along the jets shear-layers are proposed and an amplification of the aeroacoustic feedback mechanism leading to screech noise is observed in the lower jet shear-layers for two cases. It is also observed that the screech feedback mechanism establishes mainly between the nozzle lips and the end of the tenth shock cell. The acoustic loading on the plate is finally studied. As pointed out in a previous study, the flapping motion of the jet at the screech frequency seems to yield to an asymmetric organization of the Mach wave radiation also at the screech frequency. Those organized Mach waves impinge on the plate, are reflected, and propagate back towards the jet, exciting the shear-layer at the screech frequency. This will amplify the screech mechanism in the lower jet shear-layer. However, this amplification happens only for some nozzle-to-plate distances. The mechanism leading to this behaviour is explained.
I.
Introduction
Rectangular propulsion systems closely integrated to the fuselage are considered for future high-speed aircrafts. The jet plume can thus interact with nearby parallel surfaces, from the aircraft during cruise or from the ground during take-off.
For subsonic rectangular jets, several experimental1–3 studies have been conducted in order to study the interactions between the jet flow and a parallel plate and the consequences on the noise generation
mechanisms. Notably, for some jet Mach numbers, aspect ratios, and plate locations, an acoustic tone can be generated. This has been observed experimentally by several researchers2,3. For supersonic rectangular jets, very few studies have been conducted4. However, several studies have been conducted for supersonic round jets interacting with a parallel plate5–8. For round jets, the effects of the plate on the shock cell structure have been observed to be minor, except when the plate is very near to the nozzle and interacts with the flow field6,7. Moreover, in terms of acoustic radiation, it has been shown5,8 that the reflections from the flat plate appear as constructive and destructive interferences in the sideline spectrum. Finally, Mora et al.4 recently observed, for supersonic rectangular screeching jet interacting with a flat plate, an amplification of the feedback mechanism leading to screech noise for specific positions of the plate.
In the present paper, compressible jets exiting from a rectangular converging-diverging nozzle and inter-acting with a parallel plate are simulated in order to study the influence of the plate on the flow and on the acoustic field. An experimental study of a similar jet is conducted at the University of Cincinnati4. In the experiments and in the present study, an amplification of the aeroacoustic feedback mechanism leading to screech noise is observed for some plate positions. An explanation of the resonant interaction between the jet and the flat plate, leading to this amplification, is attempted. The paper is organized in seven sections. The jet parameters and the numerical parameters are first given in section II. Sections III and IV present the aerodynamic and acoustic results, respectively. Notably, hydrodynamic properties are compared with experimental data. The organization of the jet shear-layers is analyzed in section V and the acoustic loading on the plate is studied in section VI. Finally, concluding remarks are given in section VII.
II.
Parameters of the study
II.A. Jet parameters
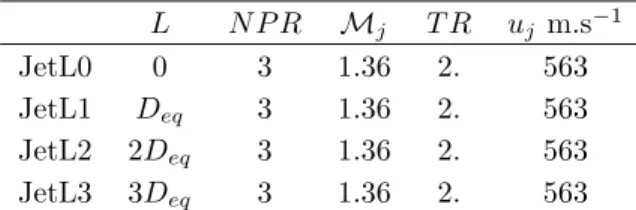
Large eddy simulations are performed for four rectangular jets corresponding to four locations above a plate, between 0 and 3Deq from the inner lip in the minor axis plane where Deq is the diameter of an equivalent round jet. The different cases are presented in table 1. The jets will be referred as JetL0, JetL1, JetTL2 and JetTL3 in the following. They originate from a rectangular converging-diverging nozzle of height h and aspect ratio 2 with a design Nozzle Pressure Ratio 3.67. They are over-expanded with a Nozzle Pressure Ratio (NPR) of 3 and they have a temperature ratio (TR) of 2. The geometry, the exit conditions and the locations of the plate are similar to those in the experimental study of Mora et al.4. It is also worth noting that the corresponding free jet has also been computed and analyzed in a previous study by Gojon et al.9 Some results from this free jet will be used for comparison purposes.
L N P R Mj T R uj m.s−1
JetL0 0 3 1.36 2. 563
JetL1 Deq 3 1.36 2. 563
JetL2 2Deq 3 1.36 2. 563
JetL3 3Deq 3 1.36 2. 563
Table 1. Jet parameters: Plate position L, Nozzle Pressure Ratio N P R, Mach number of the ideally expanded equivalent jet Mj= uj/aj, Temperature Ratio T R and exit velocity of the ideally expanded equivalent jet uj. aj is
the speed of sound in the ideally expanded equivalent jet.
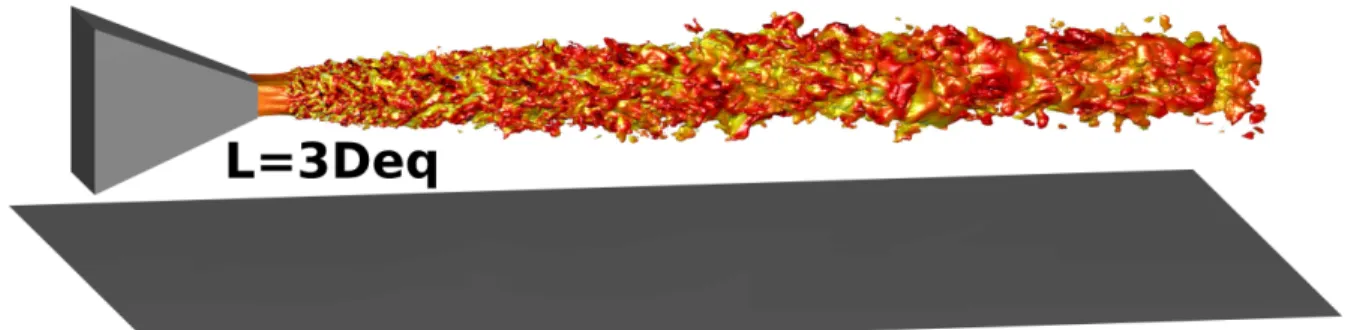
In order to better apprehend the problem, a 3-D visualization of the nozzle, the plate and the jet is proposed in Figures 1 and 2 and for JetL2 and JetL3, respectively. It is worth noting that for JetL1 and JetL2, the plate is modified under the nozzle, having a design that avoids possible issues related with air entrainment from upstream. The constructed valleys are not exactly similar to the geometry in the experiments and small differences can thus be expected for those two cases.
II.B. Numerical parameters
In this numerical study, the aerodynamic fields as well as the near acoustic fields are computed in order to understand the effects of the plate on the noise generated by the jet. To reach this objective, structured grids consisting of 64 blocks and containing about 155 millions of nodes are used. They have been designed in order to allow acoustic waves with Strouhal numbers up to St = f Deq/uj= 3 to be well propagated, where f is the frequency. The simulations are using a compressible flow solver10 already assessed in a previous
Figure 1. Isosurfaces of density for the value 0.7 kg.m−3colored by the local Mach number for JetL2.The nozzle and
the plate are in darkgrey.
Figure 2. Isosurfaces of density for the value 0.7 kg.m−3colored by the local Mach number for JetL3.The nozzle and
study9, running on a supercomputer on 960 processors. In particular, an explicit four-stage Runge-Kutta algorithm is used for time integration and a central discretization of second order of accuracy is used for spatial discretization. Moreover, at the end of each time step, a Jameson type artificial dissipation is added to the inviscid flows in order to remove grid-to-grid oscillations, to avoid Gibbs oscillations near shocks and to relax subgrid-scale turbulent energy. This artificial dissipation is derived from the one proposed by Ducros et al.11 The exact formulation can be found in Gojon et al.9 A total of 300, 000 time-steps are computed in each case after the transient period, permitting to have a simulated time of 600Deq/uj.
III.
Aerodynamics results
III.A. Snapshots
Snapshots along the minor and major axes planes are displayed in Figure 3, permitting to visualize simulta-neously the jet flow and the acoustic field.
For the case JetL0, with a plate directly aligned with the inner lip in the minor axis plane, the presence of the plate alters the shock cell structure of the jet and the near acoustic field. Notably, only few shock cells are visible in the hydrodynamic field and the strength of the shocks is lower compared to the three other considered jets. In the acoustic field, three main components can be seen. First, Mach waves are visible in the major and minor axis planes. This specific noise component appears when the convection velocity of the turbulent structures in the jet shear-layers becomes supersonic. This acoustic component has been studied experimentally12 and numerically13, it has a marked directivity and a broadband spectrum in general. The second acoustic component visible propagates in the downstream direction. It is associated to a low frequency. This acoustic contribution corresponds to the mixing noise, as observed by Bogey and Bailly14, Sandham and Salgado15and Tam16for instance. Finally, circular acoustic waves can be seen exiting from the jet shear layers at different axial positions. Those acoustic waves are created by the interactions between the shock cell structure and the turbulent structures in the jet shear-layers. In the far-field, those waves lead to the observation of broadband shock-associated noise17–19. For the three other jets, shock cell structures containing almost ten cells are visible in the hydrodynamic fields. In the acoustic fields, the three former components can be seen along with a fourth one. Indeed, acoustic waves propagating in the upstream direction in the vicinity of the nozzle are visible in the minor axis plane. These waves are linked to the screech noise mechanism. This noise component have been observed in various studies, notably in Westley and Woolley20, Tam and Tanna17, Panda et al.21, and Andr´e et al.22 These waves are organized antisymmetrically with respect to the jet axis. This suggests a screech mechanism associated with a flapping motion of the jets in the minor axis plane. Those qualitative results are in agreement with the results of the experimental team4. They observe the suppression of the screech noise component and a reduced number of shock cells for the case with a plate directly aligned with the inner lip in the minor axis plane. For the three other cases, a flapping motion of the jet in the minor axis plane was also observed.
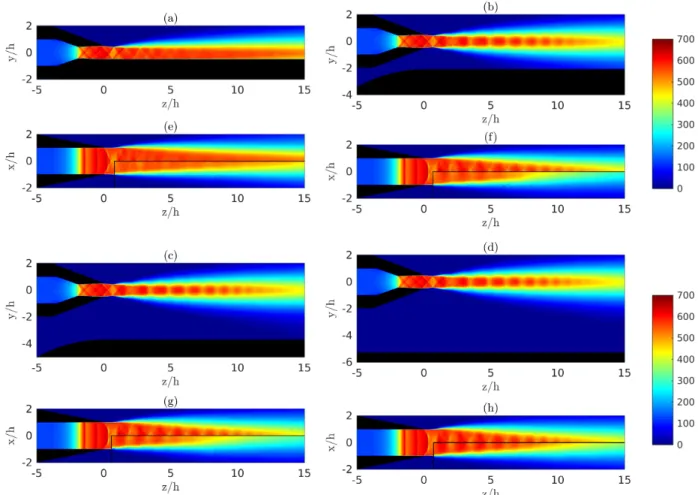
III.B. Mean flow fields
For the four present jets, the mean axial velocity distributions are visible in Figure 4 in the minor and major axis planes, respectively. For JetL0, in Figure 4(a,e), only a couple of shock cells are visible downstream of the nozzle exit. For the three other cases, the shock cell structures are similar, with around ten shock cells visible in the jet plume. The same evolution can be seen in the experimental PIV results, also plotted in Figure 4. Moreover, those results are consistent with several experimental studies showing that a plate located in a parallel way to a supersonic jet has very little influence on the shock cell structure except if the plate is very near to the nozzle and interacts with the flow field6,7.
III.C. Overall sound pressure levels
Overall sound pressure levels in the near field are computed using the root mean square pressure fields. A characterization of the effect of the plate on the overall acoustic radiation of the jets is thus possible. Overall Sound Pressure Levels (OASPL) in the minor and major axis planes are represented for the four jets in Figure 5. Isocontours are added in order to improve the readability.
Two main acoustic components can be distinguished. The first acoustic component is linked to acoustic waves propagating in the upstream direction, permitting to close the aeroacoustic feedback loop leading to
(a) (b)
(c) (d)
(e) (f)
(g) (h)
Figure 3. Representation of the Mach number in the jet and of the fluctuating pressure around for (a,b) JetL0, (c,d) JetL1, (e,f ) JetL2 and (g,h) JetL3 in (a,c,e,g) the minor axis plane and (b,d,f,h) the major axis plane. The nozzle and the plate are in black.
Figure 4. Mean axial velocity fields for (a,e) JetL0, (b,f ) JetL1, (c,g) JetL2 and (d,h) JetL3 in (a,b,c,d) the minor axis plane and (e,f,g,h) the major axis plane. The experimental PIV results are added in black rectangles. The nozzle and the plate are in black.
Figure 5. Overall Sound Pressure Levels for (a,e) JetL0, (b,f ) JetL1 (c,g) JetL2 and (d,h) JetL3 in (a,b,c,d) the minor axis plane and (e,f,g,h) the major axis plane. The nozzle and the plate are in black.
screech noise. This acoustic component is only visible along the minor axis and its amplitude is very low for JetL0 in Figure 5(a) and higher with values about 190 dB for JetL1, JetL2 and JetL3, in Figures 5(b,c,d). The second acoustic components visible is linked to the Mach wave noise. This acoustic component is visible in both the minor and major axis planes, as already observed qualitatively in Figure 3. By looking at the snapshots in Figure 3 and at overall sound pressure levels in Figures 5, a angle of propagation of about 40 degrees with respect to the jet axis is found. This result is in agreement with the model of Oertel23 using the convective Mach number Mc = 1.25 found previously9 for the corresponding free jet. The two other acoustic components observed in the snapshots, namely the mixing noise an the broadband shock-associated noise, cannot be distinguished.
IV.
Acoustic results
IV.A. Near-field acoustic
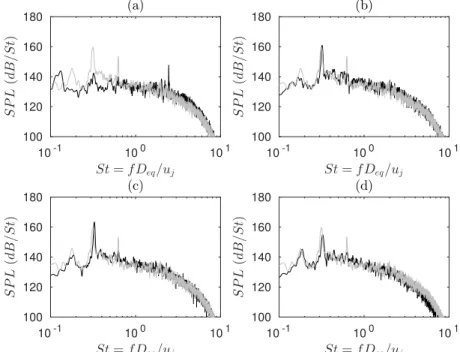
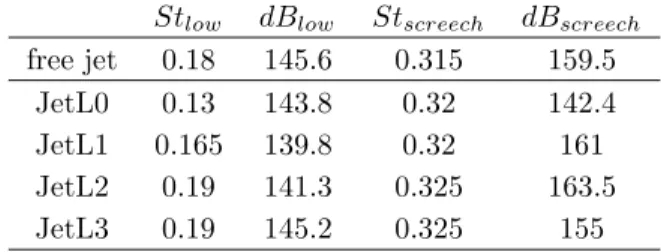
For the four jets, acoustic spectra at (x, y, z) = (0, h, 0) are plotted in Figure 6. The acoustic spectrum of the corresponding free jet is added in lightgrey. For this free jet, a screech tone frequency has been found at a Strouhal number of St = 0.315 and a low frequency was observed at St = 0.189. For JetL0, in Figure 6(a), the presence of the plate changes completely the acoustic spectrum. A low frequency is now observed at St = 0.13 and a screech frequency is observed at St = 0.32 but with an amplitude 18 dB lower as compared to the one of the free jet. For the other jets (JetL1, JetL2, JetL3), the low frequency and the screech frequency of the free jet are visible. However, it is worth noting that the first harmonic of the screech frequency, visible in the spectrum of the free jet at St = 0.63, cannot be seen in the spectra of the four present jets. The frequencies and the amplitudes of the low frequency and of the screech frequency have been gathered in Table 2. The low frequency increases with increasing the distance from the plate, from St = 0.13 for JetL0 to St = 0.19 for JetL3. For the last case, a value similar to the one of the corresponding free jet is found. The screech frequency remains the same for all the cases, at St ∼ 0.32, a value similar to the one of the corresponding free jet. However, the amplitude of the screech frequency changes with the location of the plate. For JetL0, the amplitude of the screech frequency is very low compared to the one of the free jet. For JetL1 and JetL2, it is very interesting to note that the amplitude of the screech frequency is higher than the one of the corresponding free jet. Finally, for JetL3, the amplitude of the screech frequency is 4.5 dB lower than the one in the corresponding free jet. A resonance mechanism between the jet and the plate, increasing the amplitude of the screech frequency, is thus observed for JetL1 and JetL2. Similar observations have been made in the experimental study of Mora et al.4
10-1 100 101 St = fDeq/uj 100 120 140 160 180 S P L (d B /S t) (a) 10-1 100 101 St = fDeq/uj 100 120 140 160 180 S P L (d B /S t) (b) 10-1 100 101 St = fDeq/uj 100 120 140 160 180 S P L (d B /S t) (c) 10-1 100 101 St = fDeq/uj 100 120 140 160 180 S P L (d B /S t) (d)
Figure 6. Acoustic spectra in the vicinity of the nozzle at (x, y, z) = (0, h, 0) for (a) JetL0, (b) JetL1, (c) JetL2 and (d) JetL3. The acoustic spectrum of the corresponding free jet is added in lightgrey for comparison purposes.
Stlow dBlow Stscreech dBscreech free jet 0.18 145.6 0.315 159.5 JetL0 0.13 143.8 0.32 142.4 JetL1 0.165 139.8 0.32 161 JetL2 0.19 141.3 0.325 163.5 JetL3 0.19 145.2 0.325 155
Table 2. Frequencies and amplitudes for the four present jets and for the corresponding free jet.
V.
Organization of the jets shear-layer
The jet shear-layers are studied by computing cross correlations of axial velocity and of fluctuating pressure. Differences in the developments of the jet shear-layers, between the upper and the lower ones, are discussed.
V.A. Cross correlations of axial velocity
The hydrodynamic properties of the jet shear-layers are studied by computing two point space-time cross correlations along the lower and upper jet shear-layers in the minor axis plane. In order to achieve this goal, 150 monitoring points are used along the lower and upper jet shear-layers, at y = ±h/2 and for 0 < z < 15h. For each shear-layer, a reference point is chosen at z = 7.5h and the cross correlation is computed with a second point ranging from z = 0 to z = 15h. For the axial velocity for example, the space-time normalized cross correlation is computed with the relation
R(z, τ ) = < u(xref, yref, zref, tref)u(xref, yref, z, tref+ τ ) > p< u(xref, yref, zref, tref) >2p< u(xref, yref, z, tref + τ ) >2
where u is the axial velocity, xref = 0, yref = h/2 for the upper shear-layer and yref = −h/2 for the lower shear-layer, zref = 7.5h, z ranges from 0 to 15h, tref is a reference time and τ is the separation time.
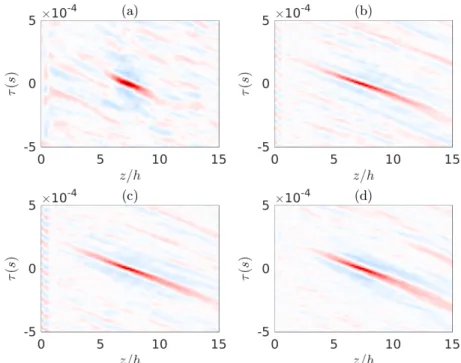
The space-time cross correlation computed with the above formula are plotted in Figures 7 and 8 in the minor axis plane for the lower and the upper shear-layers, respectively. A clear pattern is visible with an inclined line of strong cross correlation in red. This strong cross correlation is due to the downstream propagation of turbulent structures in the shear-layers. The angle of this line at the reference point (i.e. at (z, τ ) = (7.5h, 0)) corresponds to the local convection velocity of the turbulent structures in the shear-layers at z = 7.5h.
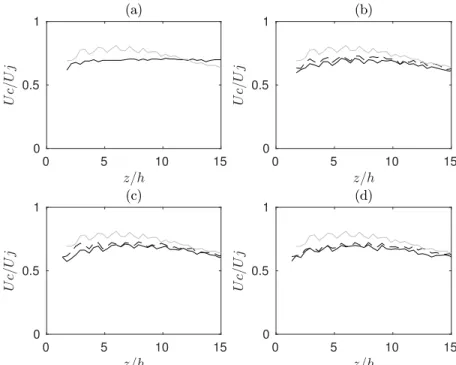
The same cross correlation pattern can be computed with different reference points ranging from 0 to 15h in order to find the local convection velocity of the flow structures as a function of the axial coordinate. The results for the upper and the lower shear-layers are given in Figure 9 where the local convection velocity is plotted as a function of the axial coordinate. The results for the corresponding free jet are also represented. For JetL1, JetL2 and JetL3, the convection velocity is not constant but varies according to the shock-cell structure, as in the free jet. The same observations have already been made experimentally24 and numerically25. Moreover, for JetL1, JetL2 and JetL3, the local convection velocity is about 10% lower than the one in the corresponding free jet and the convection velocity along the lower shear-layer is slightly larger than the one along the upper one. Finally, for JetL0, the decrease of the strength of the shock cell structure leads to a convection velocity almost constant in the upper shear-layer along the axial direction. In the lower shear-layer, the patterns were not clear enough to find the local convection velocity.
V.B. Cross correlations of pressure
In order to be able to observe both hydrodynamic and acoustic waves, the same space-time cross correlation is applied using the fluctuating pressure. The results for the lower and upper jet shear-layers in the minor axis plane are given in Figures 10 and 11, respectively. In the jet shear-layer, the fluctuating pressure field is a superimposition of the hydrodynamic pressure and of the acoustic pressure. On one hand, the hydrodynamic component is supposed to be similar to the component observed in the cross correlation of axial velocity. On the other hand, the acoustic pressure comes from the acoustic waves propagating in the upstream direction observed in Figure 3 and linked to the screech noise component.
Figure 7. Two points space-time cross correlations of the axial velocity along the lower shear-layer in the minor axis plane as a function of the axial coordinate of the second point for (a) JetL0, (b) JetL1, (c) JetL2 and (d) JetL3. The reference point is located at the z = 7.5h and the second point extends from z = 0 to z = 15h. The color scale ranges from −1 to 1.
Figure 8. Two points space-time cross correlations of the axial velocity along the upper shear-layer in the minor axis plane as a function of the axial coordinate of the second point for (a) JetL0, (b) JetL1, (c) JetL2 and (d) JetL3. The reference point is located at the z = 7.5h and the second point extends from z = 0 to z = 15h. The color scale ranges from −1 to 1.
0 5 10 15 0 0.5 1 0 5 10 15 0 0.5 1 0 5 10 15 0 0.5 1 0 5 10 15 0 0.5 1
Figure 9. Convection velocity of the turbulent structures along the upper ( ) and lower ( ) shear-layer in the minor axis plane as a function of the axial coordinate for (a) JetL0, (b) JetL1, (c) JetL2 and (d) JetL3. The convection velocity of the turbulent structures of the corresponding free jet is added in lightgrey for comparison purposes.
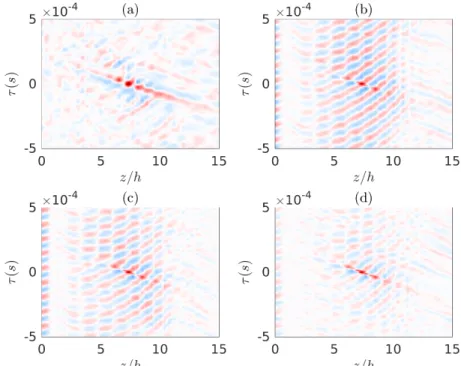
In order to better understand, the results of the lower shear-layer of JetL1, represented in Figure 10(b), are considered first. Different stripes organized vertically can be seen, indicating a strong temporal periodicity of the fluctuating pressure. This periodicity is due to the screech mechanism, organizing the fluctuating pressure in the jet shear-layers. Indeed, a temporal periodicity of T = 1.15 × 10⁻⁴s is found in Figure 10(b). This temporal periodicity is linked to a Strouhal number St = Deq/(T uj) = 0.32 which is identical to the screech frequency observed in Figure 6(b). Moreover, this temporal periodicity is the strongest for JetL1 and JetL2 in Figure 10(b,c), is still visible in Figure 10(d) for JetL3 and is not visible anymore for JetL0 in Figure 10(a). This observation is consistent with the amplitudes of the screech frequency reported in Table 2. Finally, for JetL1, JetL2 and JetL3, in Figure 10(b,c,d), two main regions can be seen as a function of the axial direction. For 3h < z < 12h, a region with lines is visible. The slope of the lines is positive, indicating instabilities propagating in the upstream direction. This result means that in this region, the pressure is mainly driven by upstream propagating instabilities. If those instabilities would have been linked to hydrodynamic instabilities propagating in the upstream direction, they would have been visible in the space-time cross correlation of axial velocity in Figure 7 as positive slope lines of high amplitudes. It can thus be concluded that those instabilities are linked to acoustic waves propagating in the upstream direction. A second zone is visible for 12h < z < 15h, with a negative slope, i.e. with downstream propagating instabilities. This is the result of the screech feedback mechanism establishing mainly between the nozzle lips and the end of the tenth shock cell, at z = 12h. Finally, for the case JetL0, only one pattern is visible with an inclined line of strong cross correlation in red. The slope is negative, indicating a downstream propagating instability. This slope simply corresponds the the convection velocity. Indeed, as JetL0 does not show a dominant flapping motion, no clear organization can be seen.
The results for the upper shear-layer are given in Figure 11. Qualitatively, the results are similar to the one obtained for the lower shear-layer in Figure 10. However, for JetL1 and JetL2, althought the pattern is the same, higher levels of cross correlation are found in the lower shear-layer in Figure 10 compared to the upper one in Figure 11. This result suggests that the amplification of the feedback mechanism creating the screech noise is due to a stronger feedback establishing in the lower jet shear-layer.
Figure 10. Two points space-time cross correlations of the pressure along the lower shear-layer in the minor axis plane as a function of the axial coordinate of the second point for (a) JetL0, (b) JetL1, (c) JetL2 and (d) JetL3. The reference point is located at the z = 7.5h and the second point extends from z = 0 to z = 15h. The color scale ranges from −1 to 1.
Figure 11. Two points space-time cross correlations of the pressure along the upper shear-layer in the minor axis plane as a function of the axial coordinate of the second point for (a) JetL0, (b) JetL1, (c) JetL2 and (d) JetL3. The reference point is located at the z = 7.5h and the second point extends from z = 0 to z = 15h. The color scale ranges from −1 to 1.
VI.
Organization on the plate
The fluctuating pressure on the plate is recorded along time at a sampling frequency of St = 2.3. A first view of the data is proposed in Figure 12 with snapshots of the fluctuating pressure on the plate. For the four jets, the acoustic component of the fluctuating pressure is visible with acoustic waves organized in the same way as in the near acoustic fields. Moreover, the hydrodynamic component of the fluctuating pressure can also be seen in the jet region for JetL0 and for JetL1 at z > 10h. This hydrodynamic component is due to the interaction between the jet plume and the plate in these two cases.
Figure 12. Representation of the fluctuating pressure at the plate surface for (a) JetL0, (b) JetL1, (c) JetL2 and (d) JetL3. The nozzle is in black. The color scale ranges from −2000 to 3000 Pa.
Two post-treatments are applied to the fluctuating pressure fields on the plate. First, the root mean square value is computed in order to look at the locations of maximum acoustic loading on the plate. Then, a Fourier decomposition is also applied to those fields, permitting to look at the organization of the pressure loading at the screech frequency. Results are plotted in Figure 13 for the four jets at the screech frequency. For the three jets undergoing a strong screech mechanism, the maxima in the root mean square of the fluctuating pressure are located on the jet axis, as expected, at z = 2.78h for JetL1, z = 5.3h for JetL2 and z = 6.82 for JetL3. In the amplitude fields, a standing wave pattern can be seen for those three latter jets. Those waves are hydrodynamic-acoustic standing waves created by the screech mechanism. Such structures were previously observed by Panda et al.21 for screeching supersonic jets and by Gojon et al.26 for ideally expanded planar impinging jets. In this standing wave pattern, there are regions with high amplitude, meaning the acoustic loading is organized mainly at the screech frequency, and regions with low amplitude, which means the acoustic loading is not organized mainly at the screech frequency. It can be seen that the localization of the maxima in the root mean square fields coincide with a region of high amplitude for JetL1 and JetL2 but not for JetL3. This suggests that for JetL1 and JetL2, where the acoustic loading of the jet is maximal on the plate, the acoustic waves are organized mainly at the screech frequency, leading to reflective acoustic waves also organized along the screech frequency. These acoustic waves will then excite the jet shear-layer at the screech frequency, leading to an amplification of the screech mechanism in the lower jet shear-layer. This result explains the stronger feedback mechanism establishing in the lower jet shear-layer compared to in the upper jet shear-layer pointed out in Figures 10 and 11 for JetL1 and JetL2.
Figure 13. Representation of the root mean square of the fluctuating pressure (x < 0) and of the amplitude field of the fluctuating pressure at the screech frequency (x > 0) for (a) JetL0, (b) JetL1, (c) JetL2 and (d) JetL3. Both fields are normalized by the maximum value and are represented with color scale ranging from 0 to 1.
plate where the root mean square value of the fluctuating pressure is maximum, the pressure spectra at those points are represented in Figure 14 for those three cases.
0.2 0.3 0.4 0.5 0.6
145 150 155 160
Figure 14. Pressure spectra at the points on the plate where the root mean square value of the fluctuating pressure is
maximum for JetL1, JetL2, JetL3.
In Figure 14, for JetL1, a strong peak can be seen at St = 0.32 at an amplitude of 158 dB/St. For JetL2, a peak can be seen at St = 0.325 at an amplitude of 156 dB/St. The results indicate that for the two jets the acoustic loadings at the specified positions are mainly organized along the screech frequency. However, for JetL3, the screech mechanism is still dominant in the near acoustic field, as observed in Figure 6, but cannot be seen in Figure 14 at the position where the acoustic loading on the plate is maximal. In conclusion, it is observed that if the acoustic waves are organized at the screech frequency at the position of the maximal loading on the plate, an amplification of the screech mechanism is observed. It is also worth noting that this amplification mechanism is in line with the observations made on the space-time cross correlation of the fluctuating pressure in the jet shear-layer in Figures 10 and 11 where it has been observed that the screech mechanism possesses a higher amplitude in the lower jet shear-layer than in the upper jet shear-layer for JetL1 and JetL2.
VII.
Conclusions
In this paper, compressible LES of a rectangular over-expanded supersonic jet interacting with a parallel wall plate are performed. The jet exits from a converging diverging rectangular nozzle of aspect ratio 2 and of design Mach number 1.5. Four simulations with four different distances between the lower inner lip of the rectangular jet and the plate ranging from 0 to 3 equivalent diameters downstream from the inner lip in the minor axis plane are carried out. The geometry of the nozzle, the positions of the plate, and the exit conditions are chosen in order to match those in an experimental study conducted at the University of Cincinnati. Aerodynamic fields are first presented, contrasting the LES mean fields with experimental PIV results. A good overall agreement is reached. The overall sound pressure levels are then plotted along the minor and major axis. It is seen that the screech feedback mechanism is almost suppressed when the plate is located at the inner nozzle lip position. Moreover, its intensity is amplified for some distances between the jet and the plate and weakened for some others. These observations are in good agreement with the ones made by the experimental team. A study of the jets shear-layers is then proposed first by looking at two points space-time cross correlations of the axial velocity. The convection of the turbulent flow structures in the jet shear-layers is thus studied. Then, two points space-time cross correlations of the pressure along the jets shear-layers are proposed and an amplification of the aeroacoustic feedback mechanism leading to screech noise is observed in the lower jet shear-layers for two cases. It is also observed that the screech feedback mechanism establishes mainly between the nozzle lips and the end of the tenth shock cell, at z = 12h. The acoustic loading on the plate is finally studied. As pointed out in a previous study, the flapping motion of the jet at the screech frequency seems to yield to an asymmetric organization of the Mach wave radiation also at the screech frequency. The organized Mach waves impinge on the plate and propagate back towards the jet, exciting the shear-layer at the screech frequency. This feedback amplifies the screech mechanism in the lower jet shear-layer. However, this amplification happens only for some nozzle-to-plate distances. Indeed, the screech mechanism leads to the formation of a standing wave pattern in terms of pressure loading at the screech frequency on the plate. There are regions with high amplitude, meaning the acoustic loading is organized mainly at the screech frequency, and regions with low amplitude, which means the acoustic loading is not organized mainly at the screech frequency. The amplification thus depends on the location of the standing wave compared to the overall acoustic loading on the plate. If a region of high amplitude of the standing wave pattern coincides with the region of maximal acoustic loading, there is an amplification of the screech mechanism.
Acknowledgments
The computations were performed using HPC resources provided by the Swedish National Infrastructure for Computing (SNIC) at the PDC center. Florian Baier, PhD at the Department of Aerospace Engineering & Mechanics of the University of Cincinnati is acknowledged for providing the experimental data used in this paper.
References
1 J. C. Yu and C. K. W. Tam, “Experimental investigation of the trailing edge noise mechanism,” AIAA Journal, vol. 16, no. 10, pp. 1046–1052, 1978. doi: 10.2514/3.61003.
2 J. E. Bridges, “Noise from aft deck exhaust nozzles – differences in experimental embodiments,” AIAA Paper 2014-0876, 2014. doi: 10.2514/6.2014-0876.
3 K. B. M. Q. Zaman, A. F. Fagan, M. M. Clem, and C. A. Brown, “Resonant interaction of a rectangular jet with a flat-plate,” AIAA Paper 2014-0877, 2014. doi: 10.2514/6.2014-0877.
4 P. Mora, F. Baier, K. Kailasanath, and E. J. Gutmark, “Acoustics from a rectangular supersonic nozzle exhausting over a flat surface,” The Journal of the Acoustical Society of America, vol. 140, no. 6, pp. 4130– 4141, 2016. doi: 10.1121/1.4967158.
5 D. McLaughlin, C. W. Kno, and D. Papamoschou, “Experiments on the effect of ground reflections on supersonic jet noise,” AIAA Paper 2008-0022, 2008. doi: 10.2514/6.2008-22.
6 C. A. Brown, M. M. Clem, and A. F. Fagan, “Investigation of broadband shock noise from a jet near a planar surface,” Journal of Aircraft, vol. 52, no. 1, pp. 266–273, 2014. doi: 10.2514/1.C032695.
7 J. Liu, A. Corrigan, K. Kailasanath, R. Ramamurti, N. Heeb, D. Munday, and E. J. Gutmark, “Impact of deck and jet blast deflector on the flow and acoustic properties of an imperfectly expanded supersonic jet,” Naval Engineers Journal, vol. 127, no. 3, pp. 47–60, 2015.
8 R. W. Powers, D. K. McLaughlin, and P. J. Morris, “Noise reduction with fluidic inserts in supersonic jets exhausting over a simulated aircraft carrier deck,” AIAA Paper 2015-2374, 2015. doi: 10.2514/6.2015-2374.
9 R. Gojon, F. Baier, E. J. Gutmark, and M. Mihaescu, “Temperature effects on the aerodynamic and acoustic fields of a rectangular supersonic jet,” AIAA Paper 2017-0002, 2017. doi: 10.2514/6.2017-0002. 10 P. Eliasson, EDGE: A Navier-Stokes solver for unstructured grids. 2001.
11 F. Ducros, V. Ferrand, F. Nicoud, C. Weber, D. Darracq, C. Gacherieu, and T. Poinsot, “Large-eddy sim-ulation of the shock/turbulence interaction,” Journal of Computational Physics, vol. 152, no. 2, pp. 517– 549, 1999. doi: 10.1006/jcph.1999.6238.
12 J. Panda and R. G. Seasholtz, “Experimental investigation of density fluctuations in high-speed jets and correlation with generated noise,” Journal of Fluid Mechanics, vol. 450, pp. 97–130, 2002. doi: 0.1017/S002211200100622X.
13 J. W. Nichols and S. K. Lele, “Large eddy simulation of crackle noise in hot supersonic jets,” The Journal of the Acoustical Society of America, vol. 134, no. 5, pp. 4128–4138, 2013. doi: 10.1121/1.4831161. 14 C. Bogey and C. Bailly, “An analysis of the correlations between the turbulent flow and the sound
pressure fields of subsonic jets,” Journal of Fluid Mechanics, vol. 583, pp. 71–97, 2007. doi: 10.1017/S002211200700612X.
15 N. D. Sandham and A. M. Salgado, “Nonlinear interaction model of subsonic jet noise,” Philosophical Transactions of the Royal Society of London A: Mathematical, Physical and Engineering Sciences, vol. 366, no. 1876, pp. 2745–2760, 2008. doi: 10.1098/rsta.2008.0049.
16 C. K. W. Tam, “Mach wave radiation from high-speed jets,” AIAA Journal, vol. 47, no. 10, pp. 2440–2448, 2009. doi: 10.2514/1.42644.
17 C. K. W. Tam and H. K. Tanna, “Shock associated noise of supersonic jets from convergent-divergent nozzles,” Journal of Sound and Vibration, vol. 81, no. 3, pp. 337–358, 1982. doi: 10.1016/0022-460X(82)90244-9.
18 C. K. W. Tam, J. M. Seiner, and J. C. Yu, “Proposed relationship between broadband shock associated noise and screech tones,” Journal of Sound and Vibration, vol. 110, no. 2, pp. 309–321, 1986. doi: 10.1016/S0022-460X(86)80212-7.
19 M. D. Dahl, “Predictions of supersonic jet mixing and shock-associated noise compared with measured far-field data,” NASA Technical Report, vol. TM-2010-216328, 2010.
20 R. Westley and J. H. Woolley, “The near field sound pressures of a choked jet during a screech cycle,” AGARD Conference Proceedings, vol. 42, pp. 23.1–23.13, 1969.
21 J. Panda, G. Raman, and K. B. M. Q. Zaman, “Underexpanded screeching jets from circular, rectangular and elliptic nozzles,” AIAA Paper 97-1623, 1997. doi: 10.2514/6.1997-1623.
22 B. Andr´e, T. Castelain, and C. Bailly, “Investigation of the mixing layer of underexpanded supersonic jets by particle image velocimetry,” International Journal of Heat and Fluid Flow, vol. 50, pp. 188–200, 2014. doi: 10.1016/j.ijheatfluidflow.2014.08.004.
23 O. S. H., “Kinematics of mach waves inside and outside supersonic jets,” in Recent Developments in Theoretical and Experimental Fluid Mechanics, pp. 121–136, 1979.
24 B. Andr´e, Etude exp´erimentale de l’effet du vol sur le bruit de choc de jets supersoniques sous-d´etendus. PhD thesis, Ecole Centrale de Lyon, 2012. 2012–42.
25 R. Gojon and C. Bogey, “Flow structure oscillations and tone production in underexpanded impinging round jets,” AIAA Journal, vol. 55, no. 6, pp. 1792–1805, 2017. doi: 10.2514/1.J055618.
26 R. Gojon, C. Bogey, and O. Marsden, “Investigation of tone generation in ideally expanded supersonic planar impinging jets using large-eddy simulation,” Journal of Fluid Mechanics, vol. 808, pp. 90–115, 2016. doi: 10.1017/jfm.2016.628.