an author's https://oatao.univ-toulouse.fr/25960
https://doi.org/10.1038/S41561-020-0544-Y
Banerdt, W. Bruce, Smrekar, Suzanne E., Banfield, Don,... [et al.] Initial results from the InSight mission on Mars. (2020) Nature Geoscience, 13 (3). 183-189. ISSN 1752-0894
T
his Perspective provides a brief mission overview and reports key discoveries. We present the first measurement of seismic activity rate, which fundamentally constrains the geological vigour of the planet (note that this study is part of the first set of InSight science reports; two additional papers1,2 also include inter-pretation of InSight seismic data3,4). The data acquired thus far also enable the characterization of Mars’s seismic background and upper crust structure, a preliminary analysis of the basic character of seis-micity, local geology and atmospheric processes at the surface, and the characteristics of the surface magnetic field1,2,5–7. InSight’s pay-load (Extended Data Fig. 1) is similar to that deployed on the Moon by Apollo astronauts and consists of three primary investigations: Seismic Experiment for Interior Structure (SEIS)8; the Heat Flow and Physical Properties Package (HP3)9; and Rotation and InteriorStructure Experiment (RISE)10. These provide a synergistic view of the Martian interior, as seismology is most effective in delineating the outer layers of a planet (crust and mantle) whereas determina-tion of the rotadetermina-tional dynamics by RISE is particularly well suited to probing the properties of the deep core. Heat flow measurements provide insight into the dynamics of the interior that complements the structural information from SEIS and RISE. HP3 and RISE have
not yet collected sufficient data for meaningful analysis; thus their results will not be discussed here. As originally planned, InSight is expected to require upwards of 24 months (∼1 Mars year) to achieve all of its objectives.
The primary investigations are supported by a deployment sys-tem, including a robotic arm and two cameras, and an Auxiliary Payload Sensor Suite (APSS), comprising a set of sensors intended
Initial results from the InSight mission on Mars
W. Bruce Banerdt
1✉, Suzanne E. Smrekar
1✉, Don Banfield
2, Domenico Giardini
3,
Matthew Golombek
1, Catherine L. Johnson
4,5, Philippe Lognonné
6,7, Aymeric Spiga
7,8,
Tilman Spohn
9, Clément Perrin
6, Simon C. Stähler
3, Daniele Antonangeli
10, Sami Asmar
1,
Caroline Beghein
11,12, Neil Bowles
13, Ebru Bozdag
14, Peter Chi
11, Ulrich Christensen
15,
John Clinton
3, Gareth S. Collins
16, Ingrid Daubar
1, Véronique Dehant
17,18, Mélanie Drilleau
6,
Matthew Fillingim
19, William Folkner
1, Raphaël F. Garcia
20, Jim Garvin
21, John Grant
22,
Matthias Grott
9, Jerzy Grygorczuk
23, Troy Hudson
1, Jessica C. E. Irving
24, Günter Kargl
25,
Taichi Kawamura
6, Sharon Kedar
1, Scott King
26, Brigitte Knapmeyer-Endrun
27, Martin Knapmeyer
9,
Mark Lemmon
28, Ralph Lorenz
29, Justin N. Maki
1, Ludovic Margerin
30, Scott M. McLennan
31,
Chloe Michaut
7,32, David Mimoun
20, Anna Mittelholz
4, Antoine Mocquet
33, Paul Morgan
14,34,
Nils T. Mueller
9, Naomi Murdoch
20, Seiichi Nagihara
35, Claire Newman
36, Francis Nimmo
37,
Mark Panning
1, W. Thomas Pike
38, Ana-Catalina Plesa
9, Sébastien Rodriguez
6,7,
Jose Antonio Rodriguez-Manfredi
39, Christopher T. Russell
11, Nicholas Schmerr
40,
Matt Siegler
5,41, Sabine Stanley
42, Eléanore Stutzmann
6, Nicholas Teanby
43, Jeroen Tromp
24,
Martin van Driel
3, Nicholas Warner
44, Renee Weber
45and Mark Wieczorek
46NASA’s InSight (Interior exploration using Seismic Investigations, Geodesy and Heat Transport) mission landed in Elysium Planitia on Mars on 26 November 2018. It aims to determine the interior structure, composition and thermal state of Mars, as well as constrain present-day seismicity and impact cratering rates. Such information is key to understanding the differ-entiation and subsequent thermal evolution of Mars, and thus the forces that shape the planet’s surface geology and volatile processes. Here we report an overview of the first ten months of geophysical observations by InSight. As of 30 September 2019, 174 seismic events have been recorded by the lander’s seismometer, including over 20 events of moment magnitude Mw = 3–4. The detections thus far are consistent with tectonic origins, with no impact-induced seismicity yet observed, and indi-cate a seismically active planet. An assessment of these detections suggests that the frequency of global seismic events below approximately Mw= 3 is similar to that of terrestrial intraplate seismic activity, but there are fewer larger quakes; no quakes exceeding Mw= 4 have been observed. The lander’s other instruments—two cameras, atmospheric pressure, temperature and wind sensors, a magnetometer and a radiometer—have yielded much more than the intended supporting data for seismometer noise characterization: magnetic field measurements indicate a local magnetic field that is ten-times stronger than orbital estimates and meteorological measurements reveal a more dynamic atmosphere than expected, hosting baroclinic and gravity waves and convective vortices. With the mission due to last for an entire Martian year or longer, these results will be built on by further measurements by the InSight lander.
to measure sources of seismic noise (wind, pressure and the mag-netic field). A unique aspect of these sensors is their capacity to provide diverse simultaneous measurements of both endogenic and exogenic phenomena because they were designed to have perfor-mance commensurate with SEIS (for example, the pressure sensor has a sensitivity in the seismic frequency band sufficient to measure variations that can cause ground deformations that appear in the seismic data).
Data are acquired continuously at 100 samples per second (sps) for SEIS and 20 sps for APSS, but only a fraction of this data can be returned due to transmission limitations. High-rate data are stored on the lander for >1 month, while subsampled continuous datasets for SEIS and APSS are returned daily and evaluated rapidly on the ground by the science team. The science team then submits ‘event requests’ for the lander to return full-rate data for specific time inter-vals that contain seismic, atmospheric or magnetic events of interest. On landing, InSight immediately began acquiring images, fol-lowed soon after by APSS, radiometer and SEIS Short Period (SP) observations, along with multiple RISE X-band tracking passes each week. The first three weeks were dedicated to choosing the best locations on the ground for placement of the SEIS and HP3
instruments5. Installation of SEIS and its wind shield was completed on sol 70 (a sol is a Martian day). SEIS data were acquired before this time (including on the deck), but it did not achieve full perfor-mance until completion of its calibration and tuning around sol 85. At present, SEIS is performing considerably better than its design requirements at frequencies between 0.02 and 2 Hz, with a noise floor of ~3 × 10⁻⁹ m s−2 Hz−1/2 for the SP sensors and slightly above 1
× 10−10 m s−2 Hz−1/2 for the Very Broad-Band (VBB) sensors during
the early evening when the atmosphere is still8.
Geologic context and shallow structure of the regolith
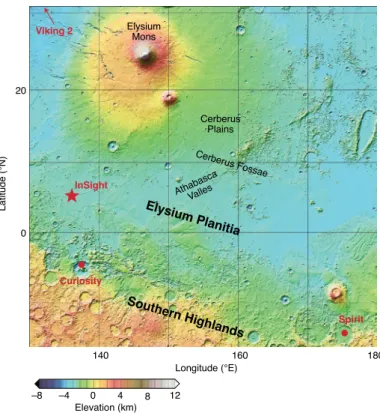
InSight landed in western Elysium Planitia (4.502 °N, 135.623 °E, elevation −2.613 km; see Fig. 1), a volcanic plain with surface agesranging from 3.7 billion years old (Ga) to 2.5 million years old (Ma) (ref. 5). Cerberus Fossae, approximately 1,600 km to the east, con-tains faults, volcanic flows and liquid water outflow channels with ages as recent as 2–10 Ma and possibly younger from impact crater counts11,12. The lander sits in a roughly 25-m-diameter degraded impact crater, informally named Homestead hollow, filled with impact-generated sediments that have been transported and modi-fied by wind. The local depth to a rocky layer that is inferred to be ancient lava flows is approximately 3–5 m based on the depth at which nearby impacts have excavated boulders13,14.
Coordinated synergistic observations by InSight’s instruments are providing new ways of characterizing the near-subsurface of Mars. The seismic recording of the HP3 hammer strokes15 and of seismic signals due to atmospheric vortices16,17 sound the first few metres of the subsurface adjacent to the lander, confirming a high-porosity, low-rigidity layer approximately 3-m thick, above a much more rigid layer1. A unique joint observation of a dust devil vor-tex using orbital imaging with the lander’s cameras, pressure sen-sor and seismometer yielded an independent measurement of a Young’s modulus of 270 MPa in the upper few metres (see Box 1
and Supplementary Discussion). This value, which is localized at a distance of ~20 m from the lander, is larger than that immedi-ately adjacent to the lander. This is consistent with the latter hav-ing an upper layer of relatively unconsolidated aeolian material that filled Homestead hollow after its formation. Finally, the infrared radiometer has measured the thermal inertia of the near surface5 to be 160–230 J m−2 s−1/2 K−1, consistent with expectations of a poorly
consolidated, sandy surface layer13,18.
Atmospheric and magnetic measurements
Although in situ meteorological measurements have been made previously, InSight’s continuous and simultaneous, well-calibrated, high-rate, high-precision pressure, wind and air temperature data provide an unprecedented view of Mars’s surface environment. 20 140 160 180 0 Viking 2 Curiosity Spirit InSight Elysium Mons Cerberus Plains Cerberus Fossae Elysium Planitia Southern Highlands AthabascaValles –8 –4 0 4 8 12 Elevation (km) Latitude (°N) Longitude (°E)
Fig. 1 | Context Map. InSight (shown as a star) landed on an ancient volcanic plain south of Elysium Mons and north of the Martian hemispheric
dichotomy. The locations of the Curiosity and Spirit rovers, and the Viking 2 lander, along with major geologic features are shown on a topographic map45.
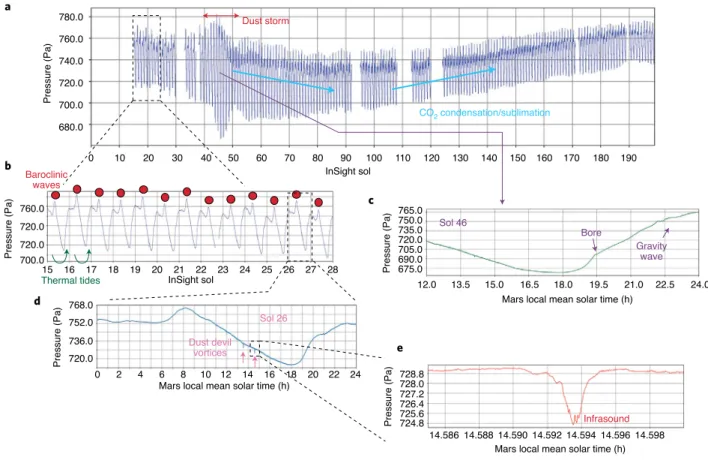
The characteristics of the bulk atmosphere and boundary layer phe-nomena are sampled on timescales of seconds to months6,19 (Fig. 2). And, as discussed above, the sensitivity of SEIS to both wind- and pressure-induced signals1,8,17,20–23 make it a unique complementary meteorological sensor for short-timescale phenomena.
The InSight landing site exhibits strong daytime turbulence, being the most active site among previous and current landed mis-sions for dust-devil-like vortices. The pattern of turbulence and calm is strongly periodic, repeating daily over the time span thus
far observed. This pattern defines the low-noise windows for SEIS marsquake observations1,2. Conversely, the dynamic atmosphere provides vibrational and ground tilt signals that can be used both to help characterize the meteorological phenomena and to probe the mechanical structure of the upper few metres of the regolith (see Lognonné et al.1 and Supplementary Discussion). On synoptic scales, InSight detects surprisingly large signals from mid-latitude baroclinic waves (with periods of 2–7 sols, similar to those detected by previous landers and from orbit), in addition to the expected Box 1 | Subsurface structure from multi-instrument observations of vortices
Through multi-instrument observations of the same phenomena, the InSight mission provides opportunities both to better under-stand atmospheric processes and to investigate the subsurface structure of Mars. An example of this is the first joint observations of a dust devil vortex on a planetary surface made by both orbital imaging and a suite of in situ instruments. From differences be-tween sequential wide-angle Instrument Context Camera (ICC) images, we are able to identify a track left by a vortex and establish its time of passage, allowing the isolation of this particular event in the pressure, wind and seismic data. Using the observed time of passage, we identified the same track in High Resolution Imaging Science Experiment (HiRISE) images from the Mars Reconnais-sance Orbiter, which gave the precise two-dimensional trajectory of the dust devil. Combining this information allows us to take detailed measurements of the compliance of the Martian subsur-face in a specific known location. In addition, whereas dust devil vortex parameters (diameter, core pressure drop) can normally only be determined if the vortex passes directly over the meteoro-logical instrumentation, these synergetic measurements allow us
to remotely access the properties of the vortex without the need for a direct encounter.
Our observations permit us to use the deformation induced by the negative pressure load of the vortex to derive the compliance, or elastic rigidity, of the ground near the InSight lander. This is a key parameter in characterizing the mechanical properties of the Martian subsurface and understanding surface formation and modification processes on Mars. As detailed in the Supplementary Discussion, we derive a mean Young’s modulus of around 270 MPa, increasing with depth, for an area roughly 20 m west-southwest of the lander. This value is larger than that found by Lognonné et al.1 using the seismic shear velocity (measured next to the lander from the HP3 hammer strokes) to constrain the
result from modelling several hundred non-located vortices. This suggests that the regolith 15–25 m from InSight is more rigid than the material immediately adjacent to the lander beneath SEIS and HP3, which is consistent with the latter having an upper layer of
relatively unconsolidated aeolian material that filled Homestead hollow after its formation.
–4 –2 0 2 North –4 –2 0 2 East –4 –2 0 2 Vertical Time (s) –1.0 0 Change in pressure (P a) Data Model 0 –0.5 0.5 10 20 30 40 50 60 70 80 90 100 Acceler ation (× 10 –8 m s –2) Acceler ation (× 10 –8 m s –2) Acceler ation (× 10 –8 m s –2) InSight lander a b c Track 3 Track 2 Track 1 Track 1 40 m N
Multiple observations of the effects of an atmospheric vortex (dust devil). a, Difference between HiRISE images ESP060695_1845 (8 July 2019; sol
218) and ESP059495_1845 (6 April 2019; sol 127) showing new dust devil tracks (dark traces) near the InSight lander. The three main tracks have been highlighted by coloured arrows. b, Difference between ICC images taken on sols 202 and 201. Yellow arrows highlight the faint dark trace of a
dust devil. c, Model data (dashed red lines) demonstrating one example fit to the observed data (black lines) for pressure (lower plot) and north, east
and vertical ground acceleration (upper three plots, respectively) for the vortex that formed track 1. The model parameters for this case are: closest approach distance 19 m; vortex translational speed 9.5 m s−1; core pressure drop 5.5 Pa; vortex diameter 6 m; Young’s modulus 2.7 × 10⁸ Pa. See
diurnally repeating solar-driven pressure variations from thermal tides and the longer-timescale signature of seasonal CO2
conden-sation (which matches in shape that measured from earlier land-ers). A few months after landing, a regional dust storm changed the weather at the InSight landing site, with wind direction shifting diametrically. Other mesoscale phenomena include gravity waves (regular oscillations in pressure, wind or air temperature driven by buoyancy oscillations and with periods >100 s), which are more ubiquitous than previously thought, and the first detections of bore events (soliton-like waves) and infrasound on Mars24. All of these phenomena are interesting from an atmospheric science perspec-tive, but also must be well understood to properly isolate atmo-spheric effects from true seismic sources.
The InSight Fluxgate magnetometer (IFG) is one of the auxiliary instruments that monitor environmental conditions for the SEIS experiment. It is also the first magnetometer on the surface of Mars and allows studies of static and time-varying magnetic fields (Fig. 3). Although the lander itself produces both such fields, signals of Martian origin can contribute to understanding the atmosphere and ionosphere regionally, as well as the interior structure of Mars. Joint studies of InSight and MAVEN (Mars Atmosphere and Volatile Evolution mission) magnetic field data, using new observations from the MAVEN spacecraft above InSight, will provide opportuni-ties to study how external fields measured in and above the iono-sphere are manifest on the ground.
Satellite missions have measured crustal magnetization acquired in an ancient global field25. However, only surface measurements can identify weak and/or small-scale magnetizations that provide
key constraints on crustal structure. The static crustal field mea-sured by InSight has a strength of 2,013 ± 53 nT, and points south-east and upward. The field strength exceeds predicted surface fields at this location from combined MAVEN and MGS (Mars Global Surveyor) satellite measurements by an order of magnitude26–28 and hence implies locally strong magnetization with wavelengths shorter than ~150 km. Furthermore, the inferred magnetization is consistent with an Earth-like ancient dynamo field and is probably carried within a layer that is at least 3.9 Ga (ref. 7).
So far, time-varying signals that have been confidently detected are diurnal variations and shorter-period pulsations (100–1,000 s). Peak-to-peak amplitudes of diurnal variations are ~20 nT and exceed those expected from the interplanetary magnetic field alone, indicating contributions from ionospheric currents. IFG has also detected tran-sient signals that are possibly related to atmospheric or space weather. With a longer time series, we expect to find signals with seasonal and/ or annual variations and 26-sol cyclicity that results from solar rota-tions and the resulting periodic changes in the interplanetary field at Mars. More details are provided by Johnson and colleagues7.
The time-varying magnetic fields are key to future studies of elec-trical conductivity structure, acting as a probe of interior tempera-ture, mineralogy and volatile content. The crustal magnetization and future electrical conductivity sounding therefore contribute directly to the overarching mission science goals.
Seismic activity of Mars
The InSight marsquake catalogue (through 30 September 2019) contains 174 events2,4, 150 of which have a high-frequency
12.0 13.5 15.0 16.5 18.0 19.5 21.0 22.5 24.0 CO2 condensation/sublimation Dust storm Bore Gravity wave Sol 46 Baroclinic waves Thermal tides Dust devil vortices Infrasound Sol 26 780.0 760.0 740.0 720.0 0 15 0 2 4 6 8 10 12 14 16 18 20 22 24 16 17 18 19 20 21 22 23 24 25 26 27 28 10 20 30 40 50 60 70 80 90 100 110 120 130 140 150 160 170 180 190 700.0 680.0 InSight sol InSight sol Pressure (Pa) 720.0 720.0 760.0 700.0 Pressure (Pa) 720.0 736.0 752.0 768.0 Pressure (Pa) 724.8 14.586 14.588 14.590 14.592 14.594 14.596 14.598 725.6 728.8 728.0 727.2 726.4 Pressure (Pa) 675.0 690.0 705.0 720.0 735.0 750.0 765.0 Pressure (Pa)
Mars local mean solar time (h)
Mars local mean solar time (h) Mars local mean solar time (h)
a
b
d
c
e
Fig. 2 | The InSight weather station’s continuous high-frequency coverage monitors the atmospheric activity from large-scale weather to small-scale turbulence. a–e, The first 200 sols of pressure data reveal seasonal processes (a, for example, polar cap CO2 condensation/sublimation indicated by light
blue arrows and a dust storm starting on sol 40), daily variations (b, baroclinic waves delineated by the red dots, indicating the variability of diurnal mean),
diurnal variability (b, thermal tides denoted by round green arrows), mesoscale phenomena (c, gravity waves and bores, indicated by the violet arrows),
character (with appreciable energy only above ~1 Hz) and are not yet fully understood in terms of distance and magnitude. The other 24 have dominantly low-frequency content, and their spec-tral shapes follow the same scaling laws as earthquakes and moon-quakes, leading us to conclude that they are of tectonic origin2. The characteristics of these spectra are compatible with expectations for distant tectonic events, and three of these have a sufficiently high signal-to-noise ratio (SNR) to be clearly located. Assuming similar signatures between these 3 events and another 10 with lower SNR, rough distances and moment magnitudes can be computed for 13 events (see Extended Data Fig. 3 and table 1 in Giardini et al.2). At least two of these events are located in the Cerberus Fossae region, consistent with the interpretation from orbital imaging of a recently active volcano-tectonic system.
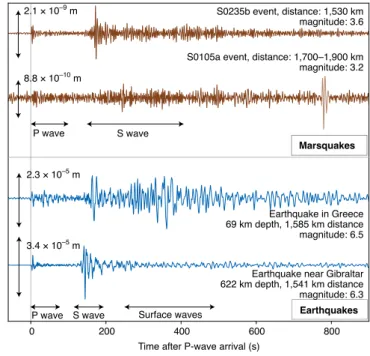
Figure 4 shows two examples of these low-frequency marsquake signals compared with two terrestrial events at similar distances from the receivers. S0235b has clearly defined P- and S-wave arriv-als. The time difference between these arrivals, along with their mea-sured polarization, allows location of the epicentre of the quake and determination of its moment magnitude. P- and S-wave arrivals for lower-SNR signals such as S0105a are difficult to distinguish from simple inspection of the time series, and are estimated using spec-tral density envelopes (see Giardini et al.2 for details). Compared with terrestrial quakes, marsquakes show relatively long codas after each seismic arrival, indicative of strong scattering in the crust, and lack surface waves. Whether the latter is due to deep sources, crustal scattering or other reasons is yet unknown.
Meteoroid impacts are another expected source of seismic events, and can be used to both probe the crust and constrain the impact flux. In theory, factors such as the direction of first motion, the occurrence of surface waves or depth phases, the amplitude ratio of P/S waves and frequency spectrum can all be used to discriminate between impacts and endogenic sources29. Impact detection rates of up to ten per Earth year were predicted29. Using the measured ambient seismic noise1, the updated predicted annual detection rate is ~8 (between 0.1–200) per Earth year for the SEIS VBB and ~2
(between 0.02–20) per Earth year for the SEIS SP30,31. All estimates have roughly an order of magnitude uncertainty due to factors such as unknown impact-seismic efficiency, attenuation and scattering in the Martian interior.
No impacts have yet been unequivocally identified, possibly due to the scattering1 that can obscure surface waves and depth phases2. Thus we cannot definitively rule out an impact origin for any par-ticular event. However, the similarity of observed waveforms points to a common seismic origin2. To actively guide the search for candi-date events in the seismic record, orbital images are being analysed for new albedo features that are characteristic of recent impacts. InSight has also begun using its cameras for night-time imaging to search for meteors. None have so far been identified31.
Knowledge of the level of seismic activity is crucial for investi-gating the interior structure and understanding Mars’s thermal and chemical evolution. Martian seismicity predictions are based on evidence of faulting32,33 and thermal evolution models that directly link seismicity to lithospheric cooling34–36. Before InSight, the only direct constraint was the absence of unambiguous event detections by the Viking 2 seismometer37,38, which limited activity to a few per cent of global terrestrial seismic activity.
Accounting for possible events that may be masked at noisier times and using source-spectral scaling to estimate magnitudes (see Giardini et al.2 for a detailed analysis), we determine magni-tude- and distance-dependent detectability statistics and estimate the total annual seismic activity using the 13 confirmed events. Ionosphere
Interplanetary magnetic field
Solar array currents
IFG with temperature sensor Dust devil External time-varying fields Lander time-varying fields Martian crustal static field Lander static field
Fig. 3 | Multiple phenomena contribute to the magnetic field measured by the IFG. Time-varying fields (orange) can be of external origin, including
the interplanetary magnetic field, ionospheric currents and weather events such as dust devils; they can also be of lander origin (blue), due to movement of the robotic arm, RISE or UHF communications, solar array currents or temperature variations causing deformation of the lander. The Martian static crustal field (red) results from crustal magnetization, represented schematically here as subsurface dipoles. A d.c. field is also associated with the lander itself (green). Inset, the IFG (white cube, about 8 cm across) mounted under the lander deck.
P wave S wave Surface waves P wave 8.8 × 10⁻¹⁰ m 3.4 × 10⁻⁵ m 2.3 × 10⁻⁵ m 2.1 × 10⁻⁹ m S wave
S0105a event, distance: 1,700–1,900 km magnitude: 3.2 S0235b event, distance: 1,530 km magnitude: 3.6 Earthquake in Greece 69 km depth, 1,585 km distance magnitude: 6.5 Earthquake near Gibraltar 622 km depth, 1,541 km distance magnitude: 6.3 Marsquakes
Earthquakes Time after P-wave arrival (s)
0 200 400 600 800
Fig. 4 | Marsquakes have similarities and differences with earthquakes.
Top, vertical displacement times series for two marsquake signals (brown). S0235b is one of the highest-SNR events observed thus far and shows clear P- and S-wave arrivals. S0105a is an example of a lower-SNR event; for such events P- and S-wave arrivals are determined using power density function envelopes2. Note the different amplitude scales. Bottom, vertical
components of two earthquake signals at a similar distance, recorded at the FIESA and DAVOX stations of the Swiss Seismic Network46. The
shallow earthquake in Greece has visible surface waves, which are not detectable for either the deep earthquake or the marsquakes. All waveforms were corrected for instrument response and filtered between 0.125 and 0.5 Hz (marsquakes) or 0.033 and 0.5 Hz (earthquakes). For the marsquakes, the instrument noise exceeds the signal at about 0.1 Hz, hence the different filter.
We extrapolate the number of observed events to: (1) one full year, assuming statistical stationarity of the seismicity release; (2) to the full sol, taking into account the observed, highly variable noise pro-file; and (3) to the full planet, accounting for the detectability of events of different magnitudes with distance (see Methods). For example, the handful of events with Mw = 3.0–3.2 are the detectable
fraction of an estimated several tens to a hundred events per Earth year across the planet.
Our estimated global seismic event rate derived from observed events (Fig. 5) indicates a moderately active planet, with a value far above that of the Moon (excluding deep moonquakes, which are associated with tidal stresses)39 and slightly below intraplate Earth40. We note that the activity is relatively close to the initial predictions32 that were used to guide performance requirements and is within the uncertainty estimates of Knapmeyer and colleagues35.
Another robust observation is the absence of events above Mw
≥ 4. Compared with the Gutenberg–Richter magnitude distribu-tion with b ≈ 1 commonly observed on the Earth and the Moon (where b is the logarithmic slope of the cumulative magnitude– number curve; see Fig. 5), the current distribution of events seems to be skewed towards smaller events (b > 1). On Earth, higher b values are only observed in specific tectonic settings, such as exten-sional areas41 or oceanic intraplate regions with extremely low strain rates42, as well as locally in volcanic areas. We note that the robust determination of b requires much larger datasets43 and will only be
possible later in the mission. To connect the seismicity to geody-namic modelling and the global heat budget36 requires an estimate of the full planetary moment release, which is dominated by the largest events in the distribution44, at least for values of b near 1.
The first results from the InSight seismometer are beginning to unveil Mars’s interior structure, rate of seismicity and locations of current tectonic activity. Observations by other instruments reveal high crustal magnetization and unexpected atmospheric processes, such as high levels of vortex activity and strong mid-latitude baroclinic waves. With more than another year of planned observations, InSight’s focus on interior processes using its diverse suite of highly complementary instruments is expected to refine the rate and distribution of seismic activity and delineate the thick-ness of the crust and the size and density of the core, and bound the planetary heat flow. These observations should continue to lead to new discoveries and constraints on Mars’s interior structure and geologic evolution, as well as processes of planetary differentiation and thermal evolution.
References
1. Lognonné, P. et al. Constraints on the shallow elastic and anelastic structure of Mars from InSight seismic data. Nat. Geosci. https://doi.org/10.1038/ s41561-020-0536-y (2020).
2. Giardini, D. et al. The seismicity of Mars. Nat. Geosci. https://doi.org/10.1038/ s41561-020-0539-8 (2020).
3. SEIS Raw Data, InSight Mission (InSight Mars SEIS data Service, 2019);
https://doi.org/10.18715/SEIS.INSIGHT.XB_2016
4. Mars Seismic Catalogue, InSight Mission V1 2/1/2020 (InSight Marsquake Service, 2020); https://doi.org/10.12686/a6
5. Golombek, M. et al. Geology of the InSight landing site on Mars.
Nat. Commun. https://doi.org/10.1038/s41467-020-14679-1 (2020). 6. Banfield, D. et al. The atmosphere of Mars as observed by InSight.
Nat. Geosci. https://doi.org/10.1038/s41561-020-0534-0 (2020).
7. Johnson, C. L. et al. Crustal and time-varying magnetic fields at the InSight landing site on Mars. Nat. Geosci. https://doi.org/10.1038/s41561-020-0537-x
(2020).
8. Lognonné, P. et al. SEIS: InSight’s seismic experiment for internal structure of Mars. Space Sci. Rev. 215, 12 (2019).
9. Spohn, T. et al. The Heat Flow and Physical Properties Package (HP3) for the
InSight mission. Space Sci. Rev. 214, 96 (2018).
10. Folkner, W. M. et al. The Rotation and Interior Structure Experiment on the InSight mission to Mars. Space Sci. Rev. 214, 100 (2018).
11. Vaucher, J. et al. The volcanic history of central Elysium Planitia: implications for Martian magmatism. Icarus 204, 418–442 (2009).
12. Burr, D. M., Grier, J. A., McEwen, A. S. & Keszthelyi, L. P. Repeated aqueous flooding from the Cerberus Fossae: evidence for very recently extant, deep groundwater on Mars. Icarus 159, 53–73 (2002).
13. Golombek, M. P. et al. Selection of the InSight landing site. Space Sci. Rev.
211, 5–95 (2017).
14. Golombek, M. P. et al. Geology and physical properties investigations by the InSight lander. Space Sci. Rev. 214, 84 (2018).
15. Kedar, S. et al. Analysis of regolith properties using seismic signals generated by InSight’s HP3 penetrator. Space Sci. Rev. 211, 315–337 (2017).
16. Lorenz, R. D. et al. Seismometer detection of dust devil vortices by ground tilt. Bull. Seismol. Soc. Am. 105, 3015–3023 (2015).
17. Kenda, B. et al. Modeling of ground deformation and shallow surface waves generated by martian dust devils and perspectives for near-surface structure inversion. Space Sci. Rev. 211, 501–524 (2017).
18. Morgan, P. et al. A pre-landing assessment of regolith properties at the InSight landing site. Space Sci. Rev. 214, 104 (2018).
19. Spiga, A. et al. Atmospheric science with InSight. Space Sci. Rev. 214, 109 (2018).
Scalar moment (N m)
Cumulative number of events per Earth year
Moment magnitude Mw 1013 1014 1015 1016 1017 1018 1,000 100 10 1 0.1 2.0 2.5 3.0 3.5 4.0 4.5 5.0 5.5 6.0 Mars HF events Mars, observed Shallow moonquakes Earth, global Intraplate, deformed Intraplate, stable Mars, predicted
Mars, whole planet
Fig. 5 | Cumulative annual activity rate for Mars compared with Earth, the Moon and pre-mission predictions for Mars. The brown data points
and curve show the observed number of marsquakes as a function of magnitude from Giardini et al.2. The orange envelope represents these
data extrapolated to the entire planet, with the vertical spread of values representing the uncertainty in the completeness of observations for smaller, distant events. The pre-InSight estimate of Mars seismic activity (red) is from Golombek et al.32. Lunar seismicity (grey data points) is based
on the analysis of shallow moonquake activity by Oberst39, with the grey
envelope representing the unknown completeness. The global seismicity of the Earth (blue) is from the GlobalCMT catalogue47, and is dominated by
plate boundaries. The terrestrial intraplate seismicity estimates separate tectonically deformed regions away from plate boundaries (turquoise) and stable continental interiors (green) (data from ref. 40). Terrestrial
curves and the upper part of the lunar bar are scaled to the surface area of Mars. The diffuse red area in the upper left denotes numerous small, high-frequency (HF) events for which the exact distance, and therefore magnitude, is not yet understood2.
20. Teanby, N. A. et al. Seismic coupling of short-period wind noise through Mars’ regolith for NASA’s InSight lander. Space Sci. Rev. 211, 485–500 (2017). 21. Mimoun, D. et al. The noise model of the SEIS seismometer of the InSight
mission to Mars. Space Sci. Rev. 211, 383–428 (2017).
22. Murdoch, N. et al. Evaluating the wind-induced mechanical noise on the InSight seismometers. Space Sci. Rev. 211, 429–455 (2017).
23. Murdoch, N., Alazard, D., Knapmeyer-Endrun, B., Teanby, N. A. & Myhill, R. Flexible mode modelling of the InSight lander and consequences for the SEIS instrument. Space Sci. Rev. 214, 117 (2018).
24. Banfield, D. et al. InSight Auxiliary Payload Sensor Suite (APSS). Space Sci.
Rev. 215, 4 (2019).
25. Acuña, M. H. et al. Global distribution of crustal magnetization discovered by the Mars Global Surveyor MAG/ER experiment. Science 284, 790–793 (1999). 26. Mittelholz, A., Johnson, C. L. & Morschhauser, A. A new magnetic
field activity proxy for Mars from MAVEN data. Geophys. Res. Lett. 45, 5899–5907 (2018).
27. Smrekar, S. E. et al. Pre-mission InSights on the interior of Mars. Space Sci.
Rev. 215, 3 (2019).
28. Langlais, B., Thébault, E., Houliez, A., Purucker, M. E. & Lillis, R. J. A new model of the crustal magnetic field of Mars using MGS and MAVEN.
J. Geophys. Res. Planets 124, 1542–1569 (2019).
29. Daubar, I. et al. Impact-seismic investigations of the InSight mission.
Space Sci. Rev. 214, 132 (2018).
30. Teanby, N. A. et al. Impact detection with InSight: updated estimates using measured seismic noise on Mars. Lunar Planet. Sci. 50, 1565 (2019). 31. Daubar, I. J. et al. Impact science on the InSight mission—current status.
Int. Conf. Mars 9, 6198 (2019).
32. Golombek, M. P., Banerdt, W. B., Tanaka, K. L. & Tralli, D. M. A prediction of Mars seismicity from surface faulting. Science 258, 979–981 (1992). 33. Golombek, M. P. A revision of Mars seismicity from surface faulting.
Lunar Planet. Sci. 43, 1244 (2002).
34. Phillips, R. J. & Grimm, R. E. Martian seismicity. Lunar Planet. Sci. 22, 1061 (1991).
35. Knapmeyer, M. et al. Working models for spatial distribution and level of Mars’ seismicity. J. Geophys. Res. 111, E11006 (2006).
36. Plesa, A. C. et al. Present-day Mars’ seismicity predicted from 3-D thermal evolution models of interior dynamics. Geophys. Res. Lett. 45, 2580–2589 (2018).
37. Anderson, D. L. et al. Seismology on Mars. J. Geophys. Res. 82, 4524–4546 (1977).
38. Goins, N. R. & Lazarewicz, A. R. Martian seismicity. Geophys. Res. Lett. 6, 368–370 (1979).
39. Oberst, J. Unusually high stress drops associated with shallow moonquakes.
J. Geophys. Res. 92(B2), 1397–1405 (1987).
40. Okal, E. A. & Sweet, J. R. Frequency-size distributions for intraplate earthquakes. Geol. Soc. Am. Bull. 425, 59–71 (2007).
41. Petruccelli, A. et al. The influence of faulting style on the size-distribution of global earthquakes. Earth Planet. Sci. Lett. 527, 115791 (2019).
42. Sasajima, R. & Ito, T. Strain rate dependency of oceanic intraplate earthquake
b-values at extremely low strain rates. J. Geophys. Res. Solid Earth 121,
4523–4537 (2016).
43. Marzocchi, W. & Sandri, L. A review and new insights on the estimation of the b-value and its uncertainty. Ann. Geophys. 46, 1271–1282 (2003).
44. Knapmeyer, M. et al. Estimation of the seismic moment rate from an incomplete seismicity catalog, in the context of the InSight mission to Mars.
Bull. Seismol. Soc. Am. 109, 1125–1147 (2019).
45. Smith, D. E. et al. Mars Orbiter Laser Altimeter: Experiment summary after the first year of global mapping of Mars. J. Geophys. Res. Planets 106, 23689–23722 (2001).
46. National Seismic Networks of Switzerland (Swiss Seismological Service, 1983);
https://doi.org/10.12686/sed/networks/ch
47. Ekström, G., Nettles, M. & Dziewoński, A. M. The global CMT project 2004–2010: centroid-moment tensors for 13,017 earthquakes. Phys. Earth
Planet. Inter. 200–201, 1–9 (2012).
Publisher’s note Springer Nature remains neutral with regard to jurisdictional claims in
published maps and institutional affiliations. © Springer Nature Limited 2020
1Jet Propulsion Laboratory, California Institute of Technology, Pasadena, CA, USA. 2Cornell Center for Astrophysics and Planetary Science, Cornell
University, Ithaca, NY, USA. 3Institute of Geophysics, ETH Zurich, Zurich, Switzerland. 4Department of Earth, Ocean and Atmospheric Sciences,
University of British Columbia, Vancouver, British Columbia, Canada. 5Planetary Science Institute, Tucson, AZ, USA. 6Institut de Physique du Globe de
Paris, Université de Paris, CNRS, Paris, France. 7Institut Universitaire de France, Paris, France. 8Laboratoire de Météorologie Dynamique/Institut Pierre
Simon Laplace (LMD/IPSL), Sorbonne Université, Centre National de la Recherche Scientifique (CNRS), École Polytechnique, École Normale Supérieure (ENS), Paris, France. 9German Aerospace Center (DLR), Institute of Planetary Research, Berlin, Germany. 10Sorbonne Université, Muséum National
d’Histoire Naturelle, UMR CNRS 7590, Institut de Minéralogie, de Physique des Matériaux et de Cosmochimie (IMPMC), Paris, France. 11Department
of Earth, Planetary, and Space Sciences, University of California, Los Angeles, Los Angeles, CA, USA. 12Lunar and Planetary Institute, Universities Space
Research Association, Houston, TX, USA. 13Department of Physics, University of Oxford, Oxford, UK. 14Department of Geophysics, Colorado School
of Mines, Golden, CO, USA. 15Max Planck Institute for Solar System Research, Göttingen, Germany. 16Department of Earth Science and Engineering,
Imperial College London, London, UK. 17Royal Observatory of Belgium, Directorate “Reference Systems and Planetology”, Brussels, Belgium. 18Université
Catholique de Louvain (UCLouvain), Louvain-la-Neuve, Belgium. 19Space Sciences Laboratory, University of California, Berkeley, Berkeley, CA, USA. 20Institut Supérieur de l’Aéronautique et de l’Espace SUPAERO, Toulouse, France. 21NASA Goddard Space Flight Center, Greenbelt, MD, USA. 22Center
for Earth and Planetary Studies, National Air and Space Museum, Smithsonian Institution, Washington, DC, USA. 23Astronika Sp. z o.o., Warsaw, Poland. 24Department of Geosciences, Princeton University, Princeton, NJ, USA. 25Space Research Institute, Austrian Academy of Sciences (ÖAW), Graz, Austria. 26Department of Geosciences, Virginia Tech, Blacksburg, VA, USA. 27Bensberg Observatory, University of Cologne, Bergisch Gladbach, Germany. 28Space
Science Institute, Boulder, CO, USA. 29Johns Hopkins University Applied Physics Laboratory, Laurel, MD, USA. 30Institut de Recherche en Astrophysique
et Planétologie, Université Toulouse III Paul Sabatier, CNRS, CNES, Toulouse, France. 31Department of Geosciences, Stony Brook University, Stony Brook,
NY, USA. 32Laboratoire de Géologie de Lyon - Terre, Planètes, Environnement, Université de Lyon, École Normale Supérieure de Lyon, UCBL, CNRS, Lyon,
France. 33Laboratoire de Planétologie et Géodynamique, UMR6112, Université de Nantes, Université d’Angers, CNRS, Nantes, France. 34Colorado Geological
Survey, Wilsonville, OR, USA. 35Department of Geosciences, Texas Tech University, Lubbock, TX, USA. 36Aeolis Research, Chandler, AZ, USA. 37Department
of Earth and Planetary Sciences, University of California Santa Cruz, Santa Cruz, CA, USA. 38Department of Electrical and Electronic Engineering, Imperial
College London, London, UK. 39Centro de Astrobiología, CSIC‐INTA, Madrid, Spain. 40Department of Geology, University of Maryland, College Park, MD,
USA. 41Department of Earth Sciences, Southern Methodist University, Dallas, TX, USA. 42Department of Earth and Planetary Sciences, Johns Hopkins
University, Baltimore, MD, USA. 43School of Earth Sciences, University of Bristol, Bristol, UK. 44Department of Geological Sciences, State University of New
York at Geneseo, Geneseo, NY, USA. 45NASA Marshall Space Flight Center (MSFC), Huntsville, AL, USA. 46Université Côte d’Azur, Laboratoire Lagrange,
Methods
Estimating seismic activity rate from event statistics. The InSight
Marsquake Service48 has detected 174 seismic events, including 13 higher-
quality regional and teleseismic (low-frequency or broadband) events (as of 30 September 2019). These latter events were all detected during the quiet evening period and all but one (S0167a) have been determined to be closer than about 90 deg (1 deg equals about 60 km on Mars). To estimate the full seismic activity on Mars, we use only these events. The so-called high-frequency events are of considerably smaller magnitude; their distances are probably <500 km, but with large uncertainties2. They therefore relate to local seismicity that would
not be detected over larger distances and is not necessarily representative of global seismic activity.
From the environmental noise evolution between 0.1 and 0.8 Hz from sols 85–325, and the modelling of source spectra described by Giardini et al.2, the
fraction of observation time during which an event of a given magnitude and distance would have been observable has been estimated (Extended Data Fig. 2). We use these detectability statistics to estimate the total annual seismic activity of Mars from the 13 observed events. These 13 events form rate A of our estimate. Extrapolation to full seismicity is done in three steps.
Step 1—Extrapolation to one year. The events were detected during 231
sols of high-quality operations (between sols 85 and 325). Under the
assumption of seasonal temporal stationarity, we estimate the annual (with respect to Earth years) activity by multiplying the number of events by 365/231. This results in rate B.
Step 2—Extrapolation to the full sol. The ambient noise of Mars varies widely over
the course of a sol and none of the events could have been detected during the noisy, turbulent wind periods of late morning and early afternoon. Each event is therefore counted ni = 1/pi times, where pi is the ratio of time in which an event
with its magnitude would have been detectable at a reference distance of 90 deg (see Extended Data Fig. 2). This factor ni varies between 4 for the lowest magnitude
(Mw = 2.8) and 2 for the highest ones (Mw = 3.8); see Extended Data Fig. 3. This
assumes that the events are stationary in time over the duration of one sol. The result is an estimate of the set of events that would have been observed if the noise was at its quietest over the whole mission. In total, it increases the number of events by approximately three times, resulting in rate C.
Step 3—Extrapolation to the full planet. The most distant event is an Mw = 3.8
event at an epicentral distance of about 150 deg, and is about 10 dB above ambient noise. We therefore conclude that the lowest magnitude that can be detected on the whole planet is about 3.5, under best noise conditions. For smaller distances, a threshold magnitude has been estimated from Extended Data Fig. 2. This means that, for example, only on 25% of the surface of the planet could Mw = 3.1 events
have been detected. Assuming a homogeneous distribution of events over the surface of Mars, 75% of the Mw = 3.1 events would therefore remain undetected,
even in the quietest periods of the sol. We therefore divide the number of events in each magnitude bin by the fraction of the surface of the planet corresponding to that bin (Extended Data Fig. 4), resulting, for example in a factor of 4 for the bin around Mw = 3.0.
This results in rate D. As this process is highly sensitive to the minimum magnitude for each distance, it is repeated with Mmin ± 0.2 to estimate
uncertainties, giving the orange bars in Extended Data Fig. 5. This result is shown as the orange range in Fig. 5.
Together, the three extrapolation steps result in an estimated annual rate of 100–500 seismic events above Mw = 2.9. This number is at the
upper end of pre-mission predictions33,35 and almost 100-times higher
than shallow lunar seismicity39. Comparisons with terrestrial seismicity
require us to take the lack of Martian plate boundaries into account. Global catalogues find about 0.5% of the quakes (Mw > 4.5) on Earth in truly intraplate
settings (that is, in non-deformed continental interiors40). This assumption has
previously been used for estimating the number of observable events expected for InSight49, but it was not always scaled to the smaller surface area of Mars. The
estimate of Martian total seismicity presented here is 25–100% of this ‘terrestrial, intraplate’ value for Mw < 3. At the same time, marsquakes of Mw > 3.2 are notably
under-represented in our current catalogue compared with a Gutenberg–Richter distribution with b = 1.
We recognize that there are different possible scenarios for the distribution of seismic activity on Mars. For example, the Tharsis area may be more active than the Southern Highlands36. If we happen to be preferentially observing a more
active region that is relatively close, our estimate of global activity will be biased high. Similarly, if there are active regions that we cannot observe due to distance or obscuration by a seismic shadow zone, our estimate will be low. For now we make the simplest assumption of uniform activity.
Data availability
The data shown in the plots within this paper and other findings of this study are available from the corresponding authors W.B.B. or S.E.S. upon reasonable
request. The InSight Mission raw and calibrated data sets are available via NASA’s Planetary Data System (PDS). Data are delivered to the PDS according to the InSight Data Management Plan available in the InSight PDS archive. All datasets can be accessed at https://pds-geosciences.wustl.edu/missions/ insight/index.html. The InSight seismic event catalogue4 and waveform data3 are
available from the IRIS-DMC and SEIS-InSight data portal ( https://www.seis-insight.eu/en/science). Seismic waveforms as well as data from all other InSight instruments and MOLA topographic data are available from NASA PDS (https://pds.nasa.gov/). The terrestrial stations CH.DAVOX and CH.FIESA are part of the Swiss Seismic Network44. The data from these stations are
accessible from the Incorporated Research Institutes for Seismology (IRIS) at
https://www.iris.edu/hq.
References
48. Clinton, J. et al. The Marsquake Service: securing daily analysis of SEIS data and building the Martian seismicity catalogue for InSight. Space Sci. Rev. 214, 133 (2018).
49. Panning, M. P. et al. Verifying single-station seismic approaches using Earth-based data: preparation for data return from the InSight mission to Mars. Icarus 527, 230–242 (2015).
Acknowledgements
A portion of the work was supported by the InSight Project at the Jet Propulsion Laboratory (JPL), California Institute of Technology, under a contract with the National Aeronautics and Space Administration (NASA). We acknowledge NASA; CNES (Centre Nationale d’Etudes Spatiale); their partner agencies and Institutions UKSA (United Kingdom Space Agency), SSO (Swiss Space Office), DLR (Deutsches Zentrum für Luft- und Raumfahrt), JPL, IPGP-CNRS (Institute de Physique du Globe de Paris-Centre National de la Recherche Scientifique), ETHZ (Eidgenössische Technische Hochschule Zürich), IC (Imperial College), MPS-MPG (Max Planck Institute for Solar System Research-Max Planck Gesellschaft); INTA/CSIC-CAB (Instituto Nacional de Técnica Aeroespacial/Consejo Superior de Investigaciones Científicas-Centro Astrobioligía); and the flight operations team at JPL, SISMOC (SEIS on Mars Operations Center), MSDS (Mars SEIS Data Service), IRIS-DMC (Incorporated Research Institutions for Seismology-Data Management Center) and PDS (Planetary Data Service) for providing the SEED (Standard for the Exchange of Earthquake Data) SEIS data used in the seismicity analysis. French co-authors acknowledge the French Space Agency CNES, CNRS and ANR (Agence Nationale pour la Recherche) (ANR-10-LABX-0023, ANR-11-IDEX-0005-0). The Swiss co-authors were jointly funded by the Swiss National Science Foundation (SNF-ANR project 157133), the Swiss State Secretariat for Education, Research and Innovation (SEFRI project “MarsQuake Service-Preparatory Phase”) and ETH Research grant ETH-06 17-02. This is LPI (Lunar and Planetary Institute) Contribution No. 2250. LPI is operated by USRA under a cooperative agreement with NASA’s Science Mission Directorate. This is InSight Contribution Number 100.
Author contributions
The scientific results of the InSight mission are the result of a team effort, with all the listed authors contributing to aspects of the design, implementation and analysis of results. W.B.B. and S.E.S. are the Principal Investigator and Deputy Principal Investigator, respectively, of the InSight mission, and jointly and equally supervised and participated in the work described in the manuscript, as well as contributed substantially to writing the manuscript. P.L., along with D.G. and W.T.P., co-led the design and implementation of the SEIS experiment. U.C., D.M. and J.T. contributed to the design and implementation of SEIS. C.B., E.B., J.C., J.C.E.I., S. Kedar, B.K.-E., M.K., L.M., A. Mocquet, F.N., M.P., A.-C.P., M.P., N.S. and R.W. contributed to seismic data analysis. P.L. and W.T.P. led the SEIS performance testing, assisted by M.D., B.K.-E., R.F.G., S. King, T.K., D.M. and N.M. D.B. and A.S. co-led the atmospheric science investigation and contributed to writing the manuscript, with N.B., M.L. and C.N. providing input. J.A.R.-M. contributed to the design, implementation and analysis of the atmospheric science investigation. R.F.G. and R.L. contributed to the joint interpretation of the seismic and atmospheric science investigations. J.N.M. led the imaging experiment and contributed to interpretation of results. M. Golombek led the geology investigation and contributed to writing the manuscript, with J. Garvin, J. Grant, S.R. and N.W. providing input. C.L.J. and C.T.R. co-led the magnetic investigation and contributed to writing the manuscript, with input from P.C., M.F. and A. Mittelholz. I.D. led the impact cratering investigation, interpretation of results and write-up for this manuscript, with G.S.C. and N.T. providing contributions. V.D. and W.F. co-led the geodesy investigation and contributed to interpretation of the results, with S.A. providing contributions. T.S. led the heat flow investigation and contributed to writing the manuscript. M. Grott, J. Grygorczuk, T.H., G.K., P.M., N.T.M., S.N., M.S. and S.E.S. contributed to the design, implementation and analysis of the heat flow investigation. C.P. led the analysis and the writing of the regolith properties from ground deformation described in the Supplementary Discussion, with contributions
from N.M., M.D., S.R., M.L., E.S., T.K., P.L., A.S. and D.B. S.C.S. led the analysis and writing of the seismic activity estimate described in the Methods, with M.K., M.v.D. and D.G. providing contributions. D.A., S. King, S.M.M., C.M., S.S. and M.W. contributed to the interpretation of the planetary interior results.
Competing interests
The authors declare no competing interests.
Additional information
Extended data is available for this paper at https://doi.org/10.1038/s41561-020-0544-y.
Supplementary information is available for this paper at https://doi.org/10.1038/
s41561-020-0544-y.
Correspondence should be addressed to W.B.B. or S.E.S.
Peer review information Primary Handling Editors: Tamara Goldin; Stefan Lachowycz.
Extended Data Fig. 1 | Instrument Payload. Description of the complete set of scientific instruments carried by the InSight lander[8–10,25,50–52].
50. Trebi-Ollennu, A. et al. InSight Mars lander robotics instrument deployment system. Space Sci. Rev. 214, 93 (2018). 51. Maki, J. N. et al. The color cameras on the InSight lander. Space Sci. Rev. 214, 105 (2018).
Extended Data Fig. 2 | Probability of marsquake detection. Probability to detect a marsquake of a certain distance and magnitude, given the expected
source spectrum2 and the distribution of ambient noise over sols 85-325. The colored crosses mark the 13 events described in the main article with their
uncertainties in distance and magnitude Mw; numerical labels refer to event names in Giardini et al.2 (e.g., 167a corresponds to event S0167a). The black
Extended Data Fig. 3 | Correction of numbers of events for variable noise across observation window. Events with magnitude Mw= 2.8 are counted 4
times, events with MW = 3.8 are counted 2 times, with linear interpolation in between. Distances and magnitudes are based on waveform alignment and the spectral magnitude MMaFB (see Giardini et al.2 for a full discussion of marsquake magnitudes).
Extended Data Fig. 4 | Minimum detectable magnitude for different distances, with the corresponding fractional surface of the planet. Distances are
Extended Data Fig. 5 | Corrected distribution of events with magnitude. Distribution of events across magnitude Mw, with the corrections described in