1
COMPUTATION OF THE MALPASSET DAM BREAK WITH A
2D CONSERVATIVE FLOW SOLVER ON A MULTIBLOCK
STRUCTURED GRID
ERPICUM1 S., ARCHAMBEAU1 P., DEWALS1,2 B., DETREMBLEUR1 S., FRAIKIN1,3 C., PIROTTON1 M.
1 Laboratory of Applied Hydrodynamics and Hydraulic Constructions (HACH),
Department of Hydraulics and Transport, University of Liège (ULg) Chemin des Chevreuils 1, B52/3+1, B-4000 Liège, Belgium
2 FNRS Research Fellow 3 FRIA Research Fellow
INTRODUCTION
In the global framework of safety, the study of the hydraulic consequences of a dam breaking, sudden and instantaneous for concrete structures, gradual for earth ones, is of major interest in the scope of prevention policies or protection plans for populations and goods.
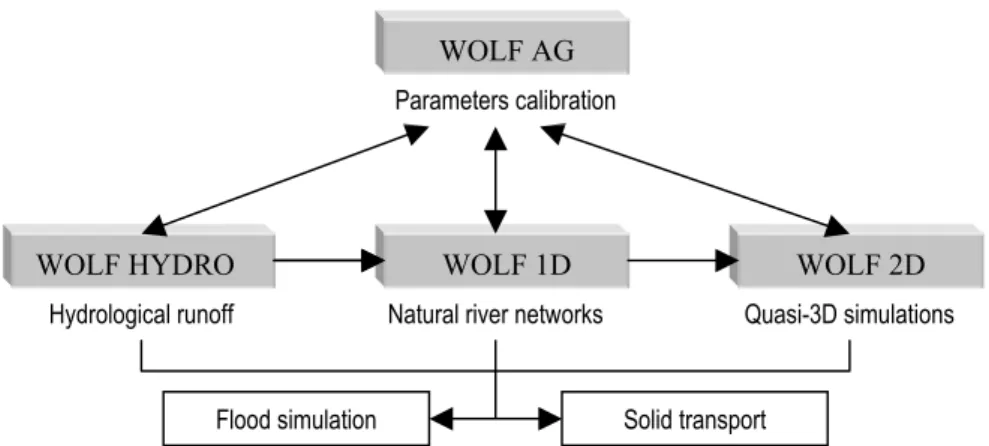
Suitable numerical models, coupled with contemporary computational possibilities, allow engineers to forecast these complex situations with a great reliability. In this field, WOLF 2D is an efficient analysis and optimisation tool, which has been completely developed by the Applied Hydrodynamics and Hydraulic Constructions team (HACH – http://www.ulg.ac.be/hach) of the University of Liege. It is part of WOLF free surface flows computation package, which includes in the same development environment the resolutions of the 1D Saint-Venant equations, the 2D shallow-water equations as well as a physically based hydrological model and powerful optimisation capabilities based on Genetic Algorithms. The interactive and unique user-interface, with high performance pre- and post-processing, allows monitoring 3-D large-scale runs graphically while they proceed, as well as generation of 3D videos. Each code handles general multiblock meshes, dealing with natural topography and mobile bed simultaneously, for any unsteady situation with mixed regimes and moving hydraulic jumps.
By this way, WOLF deals with all free surface hydraulic phenomena, from hydrological runoff and river propagation to extreme erosive flows on realistic mobile topography, such as gradual dam breaching processes. It has moreover proved its efficiency and reliability for years by numerous real applications (Archambeau et al. [1, 2], Erpicum et al. [4]).
Figure 1 : general organization of WOLF computation units.
The first part of this paper covers a brief description of the 2D multiblock flow solver WOLF 2D and the underlying mathematical model. The second part depicts the application of WOLF computation capabilities to the well-known Malpasset dam break (France, 1959), which induced a catastrophic almost instantaneous release of 48 millions m³ of water in the Reyran river valley down to the town of Frejus and the Mediterranean sea. Data available thanks to the CADAM EU-project are used to assess the results. WOLF 2D NUMERICAL MODEL
Equations
The equations governing the movement of a liquid are based on the mass and momentum balances. After integration over the water height, the mass conservation equation for an incompressible open-channel flow states:
0
h uh vh
t x y
∂ +∂ +∂ =
∂ ∂ ∂ (1)
If the vertical velocities are weak enough in comparison with the horizontal ones, so that the square of their ratio may be neglected, then the shallow-water equations can be used in the conservative form :
( )
2 2(
)
1(
)
2 b bx xx xy xx xy z gh hu hu huv gh S S t x y x τ ρ ρ ρ ρ ⎛ ⎞ ∂ ∂ + ∂ + + ∂ + = − + + ⎜ ⎟ ∂ ∂ ⎝ ⎠ ∂ ∂ (2)( )
2 2(
)
1(
)
2 by b yy yx yy yx z gh hv hv huv gh S S t y x y τ ρ ρ ρ ρ ⎛ ⎞ ∂ ∂ + ∂ + + ∂ + = − + + ⎜ ⎟ ∂ ∂ ⎝ ⎠ ∂ ∂ (3)Flood simulation Solid transport WOLF AG
WOLF HYDRO WOLF 1D WOLF 2D
Parameters calibration
with g gravity acceleration,
h water height,
hu and hv unit water discharge components,
t time,
u and v velocity components, x and y space coordinates,
ρij coefficients of uneven velocity profile,
zb bed elevation,
Sij diffusive terms (viscous and turbulent),
ρ water density,
n Manning roughness coefficient, τbx and τby shear stress components.
It must be outlined that no restrictive assumption is needed for the bottom slope, as shown by Pirotton [7].
Spatial and temporal discretisation
The spatial discretisation of the 2D conservative shallow-water equations is performed by a finite volume method. This ensures the mass and momentum properties to be conserved, even across discontinuities such as hydraulic jumps.
Designing a stable flux computation has always been a challenging and tough issue in computing fluid dynamics, especially if discontinuous solutions are expected. Flux treatment is here based on an original flux-vector splitting technique developed for WOLF. The hydrodynamic fluxes are split and evaluated partly downstream and partly upstream according to the requirements of a Von Neumann stability analysis. Special care is done for consistent bottom slope evaluation (Mouzelard [6]). Optimal agreement with non-conservative and source terms as well as low computational cost are the main advantages of this original scheme.
As we are mostly interested in transient flows and flood waves, an accurate and non-dissipative explicit temporal scheme has been chosen for the time integration. In this way, the explicit Runge-Kutta method is applied here to solve the ordinary differential equations obtained after spatial discretisation.
However, implicit time integration schemes are also available in WOLF in order to accelerate the convergence process for steady state solutions.
Other main features of WOLF 2D
WOLF2D includes an efficient mesh generator and deals with multiblock structured grids. These features increase the size of potential problems to be solved and allow mesh refinement close to interesting areas without leading to prohibitive CPU times. Coordinates (x, y) of the simulation domain and of the different blocks, with their respective mesh sizes, are the only data needed to automatically define the computational grid.
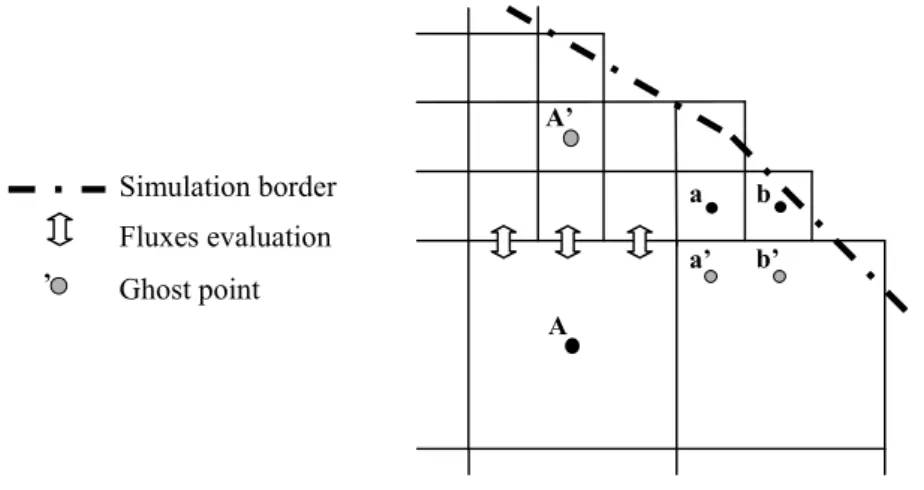
The fluxes at blocks interfaces are built on each border side, using linear reconstruction efficiently limited to ensure a proper order of precision, by the way of ghost points, the unknowns values of which are adequately evaluated from subjacent real cells data. Moreover, to be conservative through adjacent blocks and to compute accurate mass and momentum balances, fluxes interesting larger boundary meshes are taken into account at the level of the smaller ones.
Figure 2 : ghost points and fluxes evaluation level description.
The algorithm is designed to deal automatically with any moving boundary. It incorporates an original method to handle covered and uncovered (wet and dry) cells. Tanks to an efficient iterative resolution of the continuity equation at each time step, based on a correction of the discharge fluxes before any evaluation of momentum balances, the conservation of the hydrodynamic properties is ensured in the whole simulation. In addition, an adaptative grid extension technique achieves a drastic reduction in computation time, by restricting the simulation domain to the wet cells (and a surrounding narrow strip).
In order to adequately compute friction terms on steep topography, an original evaluation of the friction areas is realized. Moreover, friction side edges are taken into account where a boundary between dry and wet cells is detected.
DAM BREAK SIMULATION Malpasset dam break
Located in a narrow gorge of the Reyran river in the Departement of Var in France, the double curvature 66.5 meters high Malpasset arch dam has been built for irrigation and drinking water storage. Its crest was 223 meters long and the maximum reservoir capacity was approximated to be 55 millions m³.
At 21:14 on 2nd December 1959, during the first filling of the reservoir, the dam suddenly broke, inducing a catastrophic almost instantaneous release of 48 millions m³ of
b’ A A’ a b a’ Ghost point Simulation border Fluxes evaluation ’
water in the 12-kilometer long river valley down to the town of Frejus and the Mediterranean sea. A total of 433 casualties were reported (Goutal [5]).
Further investigations showed that key factors in the dam failure were ground water pressure and left bank rock nature. Due to the increasing pressure of rising water, the arch has disconnected from its left foundation and rotated as a whole around its upper right extremity before collapsing (Goutal [5]).
As it is well documented, this dramatic real dam break case has been used as a benchmark in the frame of the EU-CADAM project (Concerted Action on Dam-break Modeling) in 1999. Indeed, some propagation times are available as exact shutdown times of 3 electric transformers destroyed by the wave are known. In the same way, a survey done by the police showed the highest water marks on both left and right banks of the Reyran valley. Finally, a non-distorted 1/400 scale model was built in 1964 by EDF, the former owner of the dam and member of CADAM group, and was calibrated against field measurements. It provided water levels and propagation times supplementary data (Goutal, [5], Soares et al. [8]).
Simulation data and initial conditions
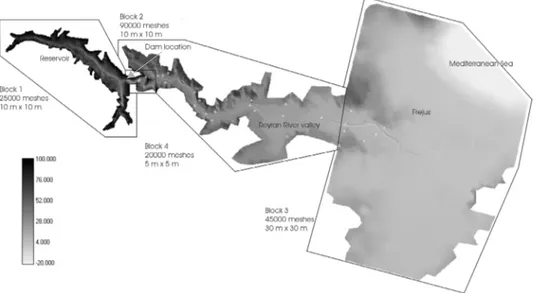
Because of the important changes in the topography after the accident, an old map (1/20 000 IGN map of Saint-Tropez n°3, dated 1931) has been used by EDF to generate the initial bottom elevation of the valley. 13 541 points (x,y,z) have been digitized to cover the 17.5 to 9 kilometers area of the study reach. These points have been interpolated to generate a denser topographic information on the 180,000 finite volumes of the 4 blocks chosen to cover the whole simulation domain in WOLF 2D (See figure 3).
Figure 3 : blocks definition on shaded view of the interpolated topography. Position of the field and laboratory measurement points.
Elevation of the valley ranges from minus 20 meters ABS at the sea bottom to plus 100 meters ABS, this latter being the estimated initial free surface level in the reservoir (with an uncertainty of about 50 cm).
From physical scale model tests, the Strickler roughness coefficient K has been estimated to be in the range of 30 to 40. Four simulations have been carried out with K values of 20, 30, 35 and 40.
Upstream of the reservoir, the inlet discharge value is unknown so it has been assumed to be null. No boundary conditions are needed since the topography is high enough to include a dry strip all around the computation domain. In the sea, the free surface water level is just assume to be constant at 0 m ABS.
Initially, the dam is defined as a straight line between two points, with a reservoir at constant level of plus 100 meters ABS. Except in the reservoir and in the sea, the computation domain is totally dry, even if a negligible but unknown base flow escaped from dam outlet. All the simulations were run with a CFL number of 0.1 to maximize time accuracy.
Results
Figures 4 and 5 of next page show computed results in regard with field and laboratory measurements.
Marks A to C design the 3 electric transformers. Since transformer A is located in the bottom of the valley, its shutdown time is the wave arrival time. For the two others, as the shutdown time is supposed to be between wave arrival time and time of maximum water level, it is more convenient to compare the time interval between shutdowns (Figure 4).
Computed times propagation are in good agreement with measurements. The value for K of 35 seems to be the best suited, what corroborates scale model results.
Figure 4 : wave arrival times to electric transformers (A to C) and to physical scale model gauges (S6 to S14) A B C S6 S7 S8 S9 S14 S13 S12 S11 S10 0 200 400 600 800 1000 1200 1400 1600 Time (s) EDF data K=20 K=30 K=35 K=40
Regarding topography precision, maximum water levels are also in good agreement with measurement points (Figure 5). The small influence on the results of the roughness coefficient value has to be underlined.
Figure 5 : maximum water levels at police survey points (P1 to P17) and at physical scale model gauges (S6 to S14)
WOLF interface easily allows the edition of risk maps, for example drawings of wave arrival times and highest water levels. These maps corroborate again the good results of the simulation, for example in terms of flood extension (Figure 6).
Figure 6 : map of higher water levels. Comparison of the flood extension with the police survey points. S14 S13 S12 S11 S10 S9 S8 S7 S6 P17 P15 P12 P11 P10 P9 P8 P7 P6 P5 P4 P3 P2 P1 0 10 20 30 40 50 60 70 80 90 100 Free surf ace elevat ion ( m ) EDF data K=20 K=30 K=35 K=40
CONCLUSIONS
WOLF 2D multiblock flow solver has shown its ability to accurately compute extreme wave propagation following the instantaneous breaking of the Malpasset dam on the real dry bed topography with very good agreements in regards of EU-CADAM Project comparison data. Improvements towards this project is the gain in discretisation precision allowed by multiblock possibilities and the efficient wetting-drying treatment, which leads to an exact water volume conservation.
Even if the results provided by WOLF 2D are in good agreement with real measurements, further computations have to be realized, for example, taking into account sediment movements due to wave propagation. Indeed, HACH dam break modelling experience showed that these phenomena can strongly affect wave propagation time as well as water level (Dewals & al. [3]).
Anyway, this kind of study is of the utmost importance for establishing efficient people and goods protection policies. For instance, the results often show that a short but fast movement is in general enough to place people in a safe area because of the hilly landscape all around dams location. Insurance companies also demonstrate an obvious interest for this form of simulations.
REFERENCES
[1] Archambeau P., Dewals B., Erpicum S., Detrembleur S., Pirotton M., “A set of efficient numerical tools for floodplain modeling”, Proc. of International Symposium
on Shallow Flows, IfH & TU Delft, The Netherland, (2003).
[2] Archambeau P., Erpicum S., Mouzelard T., Pirotton M., “Impact studies and water management with WOLFHYDRO : a new physically based hydrological solver”,
Proc. of International Symposium on Environmental Hydraulics, Arizona State
University, USA, (2001).
[3] Dewals B., Archambeau P., Erpicum S., Mouzelard T., Pirotton M., “Dam break hazard assessment with geomorphic flow computation, using WOLF 2D hydrodynamic software”, in Risk Analysis III, Ed. C. A. Brebia, WIT Press, (2002). [4] Erpicum S., Archambeau P., Dewals B., Mouzelard T., Pirotton M., “Optimising a
cascade of hydroelectric power stations with the WOLF package”, in Water
Resources Management II, Ed. C. A. Brebia, WIT Press, (2003), pp 65-74.
[5] Goutal N., “The Malpasset dam failure. An overview and test case definition”, Proc.
of CADAM Zaragoza meeting, 18th and 19th Nov. 1999, Zaragoza, (1999), pp 1-7. [6] Mouzelard T., “Contribution à la modélisation des écoulements quasi
tridimensionnels à surface libre”, PhD Thesis, HACH, Liège, Belgium, (2002).
[7] Pirotton M., “Modélisation des discontinuités en écoulement instationnaire à surface
libre”, PhD Thesis, LHCN, Liège, Belgium, (1994).
[8] Soares Frazão S., Morris M., Zech Y., “Concerted Action on Dam Break Modelling :