Quality of collaboration in a distant
collaborative architectural educational
setting
Stéphane Safin
LUCID-ULg: Lab for User Cognition and Innovative Design, Faculty of Applied Sciences, University of Liège, Belgium
Aurélie Verschuere
LUCID-ULg: Lab for User Cognition and Innovative Design, Faculty of Applied Sciences, University of Liège, Belgium
Jean-Marie Burkhardt
University Paris Descartes, France
Françoise Détienne
LTCI, UMR 5141, Telecom Paritech – CNRS, France
Anne-Marie Hébert
LTCI, UMR 5141, Telecom Paritech – CNRS, France
Abstract. This paper analyses the quality of collaboration of two student teams in a
longitudinal study of a collaborative distant architectural studio. Based on a simple method to assess several dimensions of this quality of collaboration, we compared the two groups at three stages of the design process. We also analysed how the quality of collaboration evolved over time and as a function of the design stage. We finally discuss the interests of the method and some insights to support a better understanding of mechanisms of collaboration.
1 Introduction
This study aims at assessing the quality of collaboration in a distant computer-mediated collaborative setting, in the domain of architectural design. We have analysed several dimensions of the quality of collaboration in two sudents teams which collaborated remotely during three months in a distant architectural studio,. The teams used both asynchronous (emails, file exchange servers) and synchronous collaborative tools (chat, a videoconferencing system,) including a prototype of augmented tabletop called Distributed Collaborative Design Studio (DCDS). The present report focuses on a selection of synchronous work sessions with the DCDS, in order to observe the challenges of a good collaboration and its evolution regarding the design process. The quality of collaboration was assessed with a rating-based method previously validated on short(er) episodes of collaborative design activities (Burkhardt et al., 2009b).
The remaining of this paper is organized as follows. We provide first a brief presentation of the pedagogical context of the study. It is followed by a description of the main features of the DCDS prototype used in this experiment. We then report on the method of the study. The main results are provided followed by a short discussion.
2 A pedagogical experiment with a distant
computer-mediated collaborative design
studio
The experiment takes place in the framework of a collaboration between the Nancy School of Architecture (France) and the Faculty of Applied Sciences of the University of Liège (Belgium). 16 students, 5 in Belgium and 11 in France, worked during one term (3 months, 4 hours a week) on an architecture program. The students were distributed by groups of 4 (2 in Belgium and 2 in France, or 1 in Belgium and 3 in France). The teams were given the task of designing collaboratively and remotely a polyvalent concert hall. The program was completely defined, and the proposed site was visited during the first meeting in presence of all the participants. Each student in a team were assigned two predefined role among the following ones: Architectural design, interior
students proposed their architectural solution, as well as a critical analysis of their collaborative work and of the tools to support this collaboration.
3 The Distant Collaborative Digital Studio
prototype
The Distributed Collaborative Design Studio (DCDS) is composed of:
a hardware part – the Design Virtual Desktop – (fig 1) which consists of an electronic A0 table with a suspended ceiling equipped with a projection system offering a large working surface (approximately 150x60 cm). An electronic stylus allows the drawing of virtual sketches onto this surface. The central unit is located in the ceiling. This leaves the stylus as the only interaction tool, so that the computer can disappears from designers’ mind. a software part SketSha (for sketch sharing) which is a shared drawing
environment allowing several virtual desktops to be connected to the same drawing space (fig. 2). Various functionalities, such as importation of CAD plans and bitmap images, a panel of colored pens (and an eraser) and navigation functions (zoom, translate, rotate), are proposed through intuitive graphical widgets. This software captures the strokes that compose the sketch and shares them between the distant locations (through internet connection).
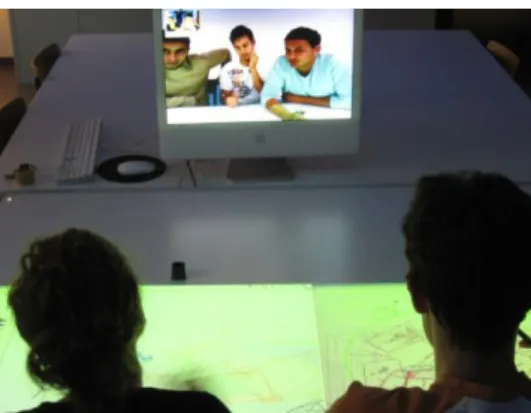
a 24 inches display with an integrated camera and a videoconferencing commercial module, that allows the participants to see and talk to each others, in an almost 1/1 scale, during a real-time conference (see fig 3).
Fig. 3 : Distributed Collaboration Design Studio.
This environment aims to recreate at distance the conditions of copresence. It has proven to be efficient in supporting design activities, in professional and educational settings (Safin et al. 2009; 2010; Kubicki et al. 2008; Elsen & Leclercq 2008).
4 Methodology
We followed two groups among the four during the entire experiment. All their exchanges were recorded and their weekly meetings on the DCDS were videotaped. These groups have been chosen regarding to their efficiency, as assessed by the pedagogical staff at the beginning of the project (after 3 weeks). One group (G1) has been evaluated as efficient, while the second (G2) has experienced a difficult start. The whole process has been monitored by a researcher, and three selected extracts per groups have been more deeply analyzed to assess the quality of collaboration and the role of the pedagogical staff.
To assess the quality of collaboration, we use a method we previously developed (Burkhardt et al, 2009a, 2009b). It is partly based on the rating scale by Spada et al. (2005) adapted to collaborative design activities. This method allows a quick coding of video extracts, by judges required to give explicit answers (yes, no, yes/no) to paired questions with positive or negative valence, targeting specific indicators relative to 7 dimensions of collaboration (see table 1). This method has proven to have a strong reliability based on inter-raters correlations (see Burkhardt
functions). documents) 3. Information
exchanges for problem solving
It assesses design ideas pooling, refinement of design ideas and coherency of ideas.
- Generation of design ideas (problem, solutions, past cases, constraints) - Refinement of design ideas - Coherency and follow up of ideas 4. Argumentation
and reaching consensus
It assesses whether or not there is argumentation and decision taken on common consensus.
- Criticisms and argumentation
- Checking solutions adequacy with design constraints
- Common decision taking 5. Task and time
management It assesses the planning (e.g. task allocation) and time management.
- Work planning - Task division
- Distribution and management of tasks interdependencies
- Time management 6. Cooperative
orientation It assesses the balance of contribution of the actors in design, planning, and in verbal and graphical actions.
- Symmetry of verbal contributions - Symmetry of use of graphical tools - Symmetry in task management - Symmetry in design choices 7. Individual task
orientation It assesses, for each contributor, its motivation (marks of interest in the collaboration), implication (actions) and involvement (attention orientation).
- Showing up motivation and encouraging others motivation
- Constancy of effort put in the task - Attention orientation in relation with the
design task
Table 1 : Dimensions and indicators (note the last dimension has not been investigated) in this paper).
5 Results
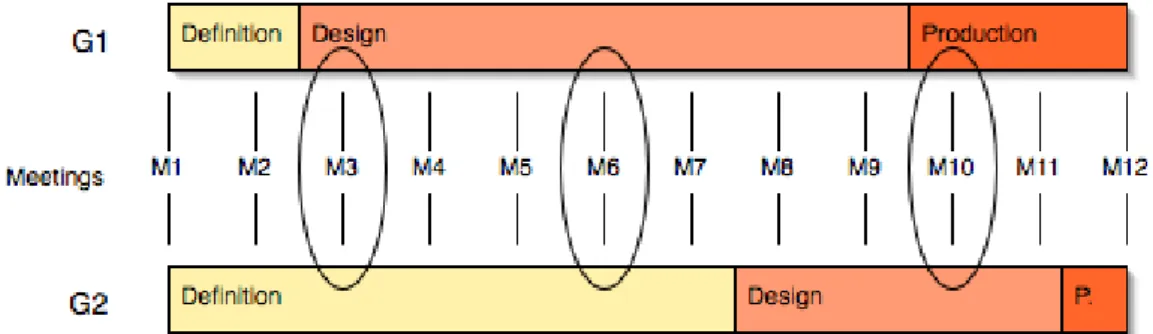
We first characterized the evolution of the design process in both groups along three stages (figure 4.) : (1) a stage of definition of the main components of the building, (2) a stage of decision about the whole set of building components and (3) a stage of production of representations (plans, 3D). The results show that the two groups clearly managed the design process in a different way. The first group G1 was more advanced while the second one G2 took a lot of time to converge during the definition phase. .
During the whole process, each group participated in 12 meetings (figure 4.). The first one was in copresence at Liège, while the last one was in copresence at Nancy. The remaining 10 meetings were done through the DCDS. We applied our method to assess the quality of collaboration on the 3rd, the 6th and the 10th collaborative synchronous distant sessions with the DCDS, Scores on the several dimensions of quality of collaboration grid are given in figure 5.
The main results are provided afterward. We compared the scores of the two group at each of the three meeting, as well as how the scores evolved in a group across the three meetings.
5.1 Between-group comparison
At the meeting M3, results show that the two groups do not collaborate on the same basis : G1 is far more efficient in collaborating than G2, except on the dimensions linked to the process management (TM) and the balance of contributions (CO), which are comparable. These two latter dimensions refer to the “form” of the collaboration, rather to the “contents”.
Meeting M3 Meeting M6 Meeting M10 G
1
G 2
At the meeting M6, G1 remained better than G2 in terms of quality of collaboration. Both groups enhanced the TM and CO dimensions, but G2 experienced however troubles in the Argumentation and Consensus (AC) dimension.
At the meeting M10, however, the situation seems inverted. G2 exhibited a higher quality of collaboration than GI, regarding the scores in our grid. The two groups had excellent scores, but G1 showed a clear weakness in the balance of contributions (CO).
These results suggest the quality of collaboration to be a multidimensional property that changes over time and that also depends on the task and the phase. For example, G2 was initially rated very low but became excellent in regard to our grid at the end of the design process. At the end of the process, G1 exhibited a lower score for the dimension of balance of contributions than G2. This is easily explained by the fact that at this production phase of design, G1 exhibited a clear distribution of the different production tasks between the team members.
5.2 Intra-groups comparison
The first group G1 exhibited the same pattern during the meetings M3 and M10 (strong collaboration with a weakness in the balance of contributions), whereas during M6, there was an equilibrium between participants. The second group G2 showed a quite difficult start in terms of quality of collaboration (M3 scores were quite low, particularly in management and balance of contributions), followed by a crisis at M6 as the weak score on the Consensus dimension demonstrated. Inversely, G2 exhibited a very good quality of collaboration at the last meeting.
These results may surprised. They must be considered in the light of the design process stages however (see figure 4 : timelines). On the M3 meeting, although G1 is more advanced than G2, the two groups experience difficulties in collaborating (management and balance), that may be explained by the fact they are starting the process. They are able to agree about content but they failed to manage their time and process due to the novelty of the collaboration group and of the collaborative environment. At M6, G1 is collaborating efficiently. The group is engaged in the core design stage, where all decisions may be taken. G2 will have the same collaborative pattern, once the design stage reached, at M10 (M10-G2 is comparable to M6-G1). The Meeting 6 for (M10-G2 shows a “crisis” : the group experience difficulties in collaborating, and difficulties to take the core decisions (they are still at the definition stage of the project). At this moment, the pedagogical staff had to intervene, to unblock the decision process. After that, the group is characterized by a great quality in collaboration, and is much more efficient in the design process. Finally, the decrease of the balance of contributions in G1 is due to the fact that the group has entered the production stage. The themes of discussions are related to specific issues relative to the work of only a part of the group, which explain that the contributions are out of balance.
6 Discussion and conclusion
These few results lead us to a number of interesting conclusions. At first, the method, quite simple to apply, allows us to make comparison between and intra groups, which is quite useful to understand the mechanisms of collaboration. They also confirm that collaboration is multidimensional. Indeed, the whole set of dimensions enables us to show how the different dimensions evolve quite differently. Giving a unique score regarding the quality of collaboration would have weakened the richness of what can be observed.
Our data show also that the quality of collaboration and the design process have a double relation : a good collaboration allows the design process to progress, and the progression of the process gives the conditions for a good collaboration. It is thus necessary to take into account the context to draw conclusions about the quality of collaboration: depending on external factors (the stage in the design process, the task at hand), some dimensions may be judged differently. Furthermore, it shows that our prototype DCDS enables to support efficiently distant collaboration design processes.
Finally, another part of this study (which is not described here) shows also some strong relations between the quality of collaboration and the role assumed by the teacher during the meetings (see Safin et al. 2010).
7 Acknowledgments
This research has taken place in the framework of a Tournesol Wallonia-France collaboration funding.
8 References.
Burkhardt, J-M., Détienne, F., Hebert, A.-M.., Perron, (2009a) Assessing the “Quality of Collaboration” in Technology- Mediated Design Situations with Several Dimensions.
Proceedings of INTERACT 2009 , pp. 157–160
Burkhardt, J-M., Détienne, F., Hebert, A.-M.., Perron, L. , Safin, S. Leclercq, P. (2009b) An approach to assess the quality of collaboration in technology-mediated design situations.
Safin, S., Delfosse, V., & Leclercq, P. (2010) Mixed-reality prototypes to support early creative design. In E. Dubois, P. Gray & L. Nigay (Eds). The Engineering of Mixed Reality Systems. London : Springer
Safin, S. & Leclercq, P. (2009). User studies of a sketch-based collaborative distant design solution in industrial context. Proceedings of CDVE 2009. The 6th International Conference on
Cooperative Design, Visualization and Engineering. Luxembourg, Septembre.
Safin, S., Verschuere, A., Burkhardt, J.-M., & Détienne, F. (2010). Adaptation mutuelle du processus de conception, du rôle de l’enseignant et de la qualité de la collaboration dans une situation de conception collaborative à distance. 45me Congrès de la Self, Lièges, Belgique. Spada, H., Meier, A., Rummel, N., Hauser, S.: A new method to assess the quality of col-
laborative process in CSCL. In: Koschmann, T., Suthers, D., Chan, T.W. (eds.) Computer
Supported Collaborative Learning 2005: The Next 10 Years!, pp. 622–631. Lawrence Erl-