Remagnetization of bulk high-temperature superconductors subjected to
crossed and rotating magnetic fields
P Vanderbemden1, Z Hong2, T A Coombs2, M Ausloos3, N Hari Babu4, D A Cardwell4 and A M Campbell4 1 SUPRATECS and Department of Electrical Engineering and Computer Science B28, Sart-Tilman, B-4000 Liège, Belgium
2 Centre for Advanced Photonics and Electronics, Engineering Department, University of Cambridge, 9 JJ Thomson Avenue, Cambridge CB3 OFA, UK
3 SUPRATECS and Department of Physics B5, Sart-Tilman, B-4000 Liège, Belgium
4 IRC in Superconductivity, University of Cambridge, Madingley Road, Cambridge CB3 OHE, UK
Abstract
Bulk melt-processed Y-Ba-Cu-O (YBCO) has significant potential for a variety of high-field permanent-magnet-like applications, such as the rotor of a brushless motor. When used in rotating devices of this kind, however, the YBCO can be subjected to both transient and alternating magnetic fields that are not parallel to the direction of magnetization and which have a detrimental effect on the trapped field. These effects may lead to long-term decay of the magnetization of the bulk sample. In the present work, we analyze both experimentally and numerically the remagnetization process of a melt-processed YBCO single domain that has been partially demagnetized by a magnetic field applied orthogonal to the initial direction of trapped flux. Magnetic torque measurements are used as a tool to probe changes in the remanent magnetization during various sequences of applied field. The application of a small magnetic field between the transverse cycles parallel to the direction of original magnetization results in partial remagnetization of the sample. Rotating the applied field, however, is found to be much more efficient at remagnetizing the bulk material than applying a magnetizing field pulse of the same amplitude. The principal features of the experimental data can be reproduced qualitatively using a two-dimensional finite-element numerical model based on an E-J power law. Finally, the remagnetization process is shown to result from the complex modification of current distribution within the cross-section of the bulk sample.
1. Introduction
Single domain bulk melt-processed RE-Ba-Cu-O ((RE)BCO, where RE represents a rare-earth ion) has
significant potential for use in permanent-magnet-like engineering applications [1], such as magnetic bearings [2, 3] and high-power-density rotating machines [4-8] due to its ability to trap relatively large magnetic fields [9, 10]. In the so-called 'trapped-field' or 'pre-fluxed' synchronous motor, for example, the bulk (RE)BCO artefact is placed in the machine rotor and permanently magnetized parallel to its c-axis before the machine is started [4, 5]. In such a configuration, the superconductor, which acts effectively as a permanent magnet, is expected to follow continuously the rotating magnetic field produced by the three-phase stator windings. In practice, however, any sudden variation of the applied torque on the shaft may cause the magnetization of the sample to mis-align with the direction of the stator field for a short period of time [8]. In addition, the sample itself may effectively be exposed to a rotating field during such a process due to the reaction with the armature reaction and to inhomogeneities of the stator field itself [11]. Such phenomena result generally in the reduction of the field trapped in the superconductor, with the most severe demagnetizing effects arising when the ac field perturbations are perpendicular to the direction of permanent magnetization [12].
The situation in which a magnetized bulk high-temperature superconductor (HTS) sample is subjected to a field applied orthogonal to the original direction of magnetization (i.e. the so-called 'crossed magnetic fields' configuration) has been studied extensively for several years [13-18]. It is now well established that small transverse field cycles may cause a significant decay of the sample magnetization, which is also known as
'collapse of the magnetic moment' [14,15]. The repetition of a transverse field cycle in rotating machinery,
therefore, may result in a long-term decay of the field produced by any bulk HTS magnet used in the design of the device and result, ultimately, in its failure. Unlike in a standard 'crossed-field' experiment where the sample is demagnetized by a series of transverse field cycles only, a superconducting permanent magnet used in a machine rotor is also subjected to parallel fields that can re-magnetize the sample. A detailed understanding of the remagnetization process in this configuration remains unknown. One relevant issue, however, is to determine the minimum amplitude of applied magnetic field required to recover fully the original magnetization following the demagnetization process. It is also necessary to determine whether rotating the field continuously from the transverse to the parallel direction is equivalent to applying successive pulses of transverse and parallel field.
Several theoretical approaches have been made in the literature to attempt to describe the magnetic behaviour of irreversible type-II superconductors subjected to crossed magnetic fields, including the double critical-state model [19, 20], the two-velocity hydrodynamic model [14, 15], the elliptic flux-line-cutting critical-state model [21-23] and a number of vari-ational approaches [24-27]. In such studies performed to date on the crossed-field problem, the length of the sample is assumed to be infinite in the direction of the applied fields, such as the case of an infinite slab with crossed magnetic fields parallel to the slab surface. In contrast, different theoretical approaches have been developed in the case of thin strips [28-30] or very thin platelets (thickness d « dimensions
w, L) subjected, for example, to a dc field applied perpendicular to the platelet face with an ac field applied
perpendicular to the platelet thickness [31]. The magnetic properties of type-II superconductors, taking into account finite size effects, have been studied successfully for rotating fields [32, 33] and various configurations of the transverse fields [34-38]. To our knowledge however, none of these approaches has been applied to the case of the bulk HTS samples used in several engineering applications, and which are first permanently magnetized along their shortest direction and then subjected to transverse or rotating magnetic fields. We reported previously the use of a finite-element method (FEM) [39] to model the two-dimensional magnetization of superconductors of finite thickness in the crossed-field configuration [40-43]. Rather than assuming a vertical E-J characteristic, which is the approach of the techniques described above, our method involves modelling the superconductor with a E-J power-law relation, E α Jn, with n » 1 [44, 45]. In addition, the
currents are assumed to flow perpendicularly to the sample cross-section and to close at infinity in our particular geometry. As a result, the electric field, E, and the current density, J, are maintained parallel to each other and are always orthogonal to the magnetic field H. An important consequence of this geometry is that it avoids both flux-free configurations and flux cutting, which simplifies the physical understanding of the problem. Strikingly, this simple approach was able to reproduce successfully the main features of the collapse of magnetic moment under the action of a transverse field [39].
The objective of the present work is to investigate both experimentally and numerically the conditions of remagnetization of the bulk sample after application of a transverse field. This involves measuring the
magnetization of a YBCO single domain under crossed and rotating magnetic fields by torque magnetometry and comparing the results with those of a two-dimensional model in order to analyze the physical processes involved in remagnetizing the sample and to draw conclusions of practical significance.
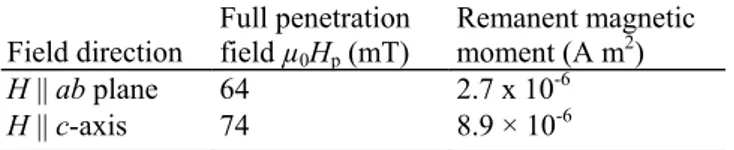
Table 1. Full-penetration field and remanent magnetic moment determined for the YBCO sample at T = 77 K.
The sample dimensions are 0.855 mm x 0.855 mm x 0.26 mm; the shortest side is parallel to the c-axis.
Field direction Full penetration field µ0Hp (mT) Remanent magnetic moment (A m2) H || ab plane 64 2.7 x 10⁻⁶ H || c-axis 74 8.9 × 10⁻⁶ 2. Experiment
Bulk melt-processed single domains of YBCO, consisting of a superconducting YBa2Cu3O7-δ (Y-123) matrix with discrete Y2BaCuO5 (Y-211) inclusions, were fabricated by a top seeded melt growth (TSMG) technique, as described in [46-49]. Small samples with an aspect ratio of ~1:3 (typical size 0.8 mm × 0.8 mm × 0.25 mm) and faces coinciding with the major crystallographic planes of the Y-123 unit cell were cut from the parent single domain using a wire saw. These samples were characterized magnetically for applied field conditions of H || ab and H || c at T = 77 K using a Quantum Design superconducting quantum interference device (SQUID) magnetic property measurement system (MPMS). The properties of one of these samples are summarized in table 1. Measurements of the YBCO samples in the crossed-field configuration were carried out using magnetic torque magnetometry in a Quantum Design physical property measurement system (PPMS). In all experiments, the melt-processed sample was initially magnetized parallel to the c-axis by field cooling (FC) down to T = 77 K in an applied field of 0.5 T. In order to ensure that the maximum (trapped) magnetic moment mc is achieved, the
field amplitude was intentionally much larger than the full-penetration field of the sample, µ0Hp = 74 mT (i.e. the magnetic field at which the flux fronts reach the centre of the sample) [50, 51]. A constant time interval of approximately 5 min was allowed for magnetic relaxation following removal of the applied (c-axis) field [51-53]. A transverse magnetic field Hab was then applied parallel to the ab plane of the sample and the magnetic
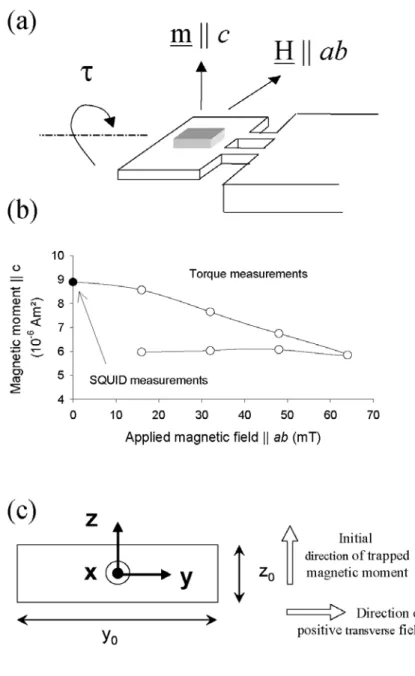
torque τ recorded, as illustrated schematically in figure 1(a). In this case, the magnetic torque can be expressed as
by mc(Hab) = τ(Hab)/(µ0Hab), since mc and Hab are mutually orthogonal. This technique is particularly convenient
for determining accurately the magnetic moment of small-size superconductors subjected to crossed and rotating fields. One constraint of the method, however, is that the measurements must always be performed in the presence of a small but finite transverse field Hab. As shown in figure 1(b), the measured mc(Hab) data obtained
by torque measurements agree perfectly with the initial value of magnetic moment determined by SQUID magnetometry in the absence of a transverse field. The collapse in magnetization shown in figure 1(b) is also qualitatively similar to that reported in the literature [13-17] and to Hall probe measurements performed on larger samples of the same material [18, 39].
Figure 1. (a) Schematic illustration of the sample mounted on the platform used for torque measurements. (b)
Magnetic moment || c-axis during the application of one sweep of transverse field || ab. The closed symbol indicates the initial trapped magnetic moment without transverse field. The open symbols represent data determined from magnetic torque measurements. (c) Geometry used for the two-dimensional model: the sample is of cross-section y0 × z0 and is infinite in the x direction. In all cases, the sample is pre-magnetized along the
z-axis and the transverse field is applied parallel to the y-z-axis.
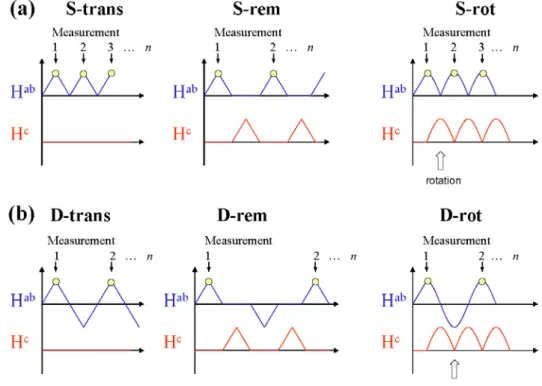
Three different sequences of applied field were performed and the results were compared in order to analyze the remagnetization process, as illustrated schematically in figure 2(a). In the classical demagnetization sequence ('S-trans'), the transverse field is cycled several times between 0 and +Hmax and the magnetic moment is
measured at H = +Hmax, as indicated by the arrows in figure 2. A transverse field cycle is again employed in the so-called 'remagnetization' sequence ('S-rem'), but with the incorporation of an intermediate field cycle stage between each transverse field cycle in which magnetic field is applied parallel to the direction of original magnetization. In this case, the amplitude of the remagnetizing field (Hmax) is identical to that of the transverse field and the magnetic moment is measured at each transverse field maxima. Finally, in the so-called 'S-rot' sequence, the applied transverse field is ramped initially to H = +Hmax and rotated repeatedly by 90° to the parallel direction (H || c) and back to the transverse direction (H || ab). In this case, the magnetic moment is measured when the field is perpendicular to the magnetic moment. Experimentally, the three sequences were adjusted so that the time interval between two successive measurements is constant (500 s).
A similar set of applied field sequences was also performed, but under conditions of double polarity, as shown in figure 2(b). This involved (i) the 'D-trans' sequence (cycling the transverse field between +Hmax and -Hmax), (ii) the 'D-rem' sequence (cycling the applied magnetic field parallel to the direction of original magnetization once between the transverse field cycles), and (iii) the 'D-rot' sequence (rotating the field by 180° from the +Hmax to
the -Hmax directions during each transverse field cycle).
In addition, a separate rotation sequence was investigated where a field of constant amplitude Hmax was applied parallel to the direction of trapped flux, rotated at some angle α and then cycled between two symmetric angular positions + α and - α. The particular case of α = 90° corresponds to the 'rotation' sequence in the condition of double polarity described above. In this experiment, the magnetic torque τ was measured when the applied field was directed at angle +α with respect to the c-axis, in which case the magnetic moment mc is given by τ/(µ0Hmax sin α).
Figure 2. Sequences of magnetic fields applied to the sample. The transverse field has either (a) single or (b)
double polarity.
3. Modelling parameters
The numerical method used for modelling the electromagnetic behaviour of a bulk superconductor is based on solving the set of Maxwell equations in two dimensions using the finite-element method (FEM) software Comsol
Multiphysics 3.2, and a numerical evaluation scheme described in detail in [40]. In the present case, 2068
assuming E = Ec(J/Jc)n, where Ec(= 1 µV cm-1) is the threshold electric field used to define the critical current
density Jc. A constant n = 21 value was used, corresponding to typical values of this parameter reported for bulk melt-processed YBCO [54, 55]. From the SQUID magnetization measurement results, we used a field-dependent
Jc(B) = Jc0(l + |B|/B0)-1 [56], where |B| denotes the modulus of the local magnetic induction. The constant
parameters Jc0 and B0 were determined to reproduce the experimental M(H) curve for H || c; the procedure yields Jc0 = 105 A cm-2 and B0 = 16 mT.
Space is assumed to be infinite in the x direction (i.e. perpendicular to the plane of the paper) in the two-dimensional model used in this study, as shown in figure 1(c). The direction of the remanent magnetization and transverse applied fields are denoted hereafter by z and y. The sample is assumed to consist of an infinitely long rectangular bar of cross-section y0 × z0· In this geometry, the magnetic flux lies in the y-z plane and the current density field lines flow in the x direction. Although the two-dimensional geometry used in the model does not represent the true geometry of the superconducting samples used in the experiments, the key point is that the sample has finite dimensions along both the remanent magnetization (z) and the applied transverse field (y) directions. In the present model, the sample was magnetized initially by a field pulse of duration 0.1s applied parallel to z. A constant time interval (10 s) was then employed in order to allow the trapped magnetic moment to relax due to flux creep effects. The sample was then subjected to the applied magnetic field sequences described in section 2 and the program was used to compute both the average magnetic moment along the z direction and the current distribution J (y,z) within the sample cross-section.
4. Results and discussion
4.1. Magnetization sequences in the conditions of single polarity
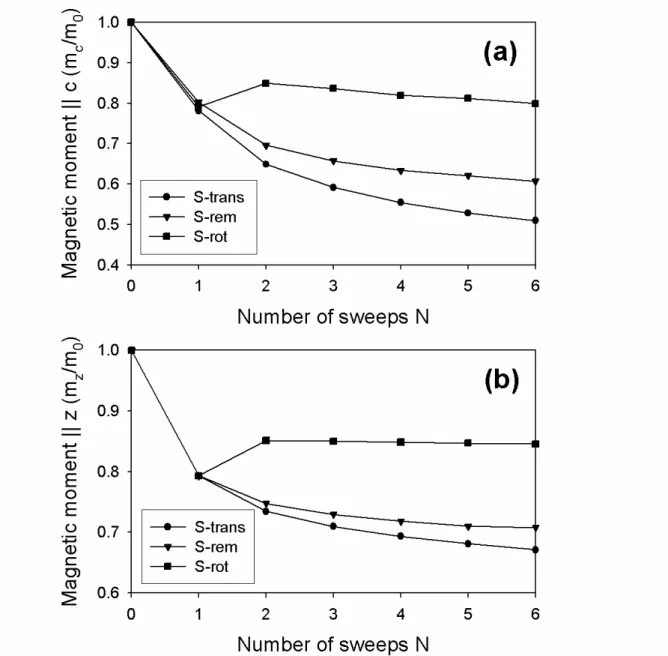
Figure 3(a) compares the evolution of the measured c-axis magnetic moment mc with the number of sweeps N
for the three unipolar magnetic field sequences ('S-trans, S-rem and S-rot') shown in figure 2(a). The amplitude of the magnetic field Hmax is half that of the full-penetration field Hp parallel to the ab plane. It should be
remembered that the full-penetration fields determined for H || c and for H || ab differ by ~15% in the case of the sample studied here (c.f. table 1). In the following discussion, the term 'penetration field Hp' will always refer to
the value determined for a field configuration of H || ab, i.e. µ0Hp = 64 mT. It is apparent from figure 3(a) that the (N = 1) data points in each sequence are very close to each other, since they result from the application of the same 0.5Hp transverse field. A subsequent series of transverse field cycles only ('S-trans') leads to a monotonic decrease of the magnetization, as is observed usually [14, 17, 18]. Applying a magnetizing field pulse parallel to the initial direction of magnetization between each transverse field cycle ('S-rem') yields a slightly less
pronounced decay in magnetization. Rotating the applied field by 90° to the parallel direction and back to the transverse direction ('S-rot') is found to be more efficient in remagnetizing the sample than applying a magnetizing field pulse (H || c) of the same amplitude.
Figure 3(b) shows the results of the model, corresponding to the same experimental conditions as those described above. From a quantitative point of view, the normalized magnetization decays resulting from the various field cycles are found to be less pronounced than those measured experimentally. From a qualitative point of view, however, the modelled mz(N) curves are remarkably similar to the experimental data. Rotating the applied field
after the first transverse field sweep increases the magnetic moment (mZ(N = 2) > mZ(N = 1) for the 'S-rot' curve),
whereas further rotations lead to a slow decay of the magnetization. The rotation mode always remagnetizes the sample more efficiently than that obtained by incorporating a parallel field cycle stage between the transverse field cycles.
Figure 3. (a) Measured magnetic moment || c-axis at the end of each unipolar magnetic field cycle shown in
figure 2. The magnetic moment is normalized with respect to its initial value m0 determined by SQUID
measurements and the field amplitude is 0.5Hp, where Hp denotes the full-penetration field || ab plane. (b)
Modelled magnetic moment under the same experimental conditions.
In order to identify the possible reasons for such behaviour, we have modelled the current distribution within the sample cross-section at several selected times between the two first data points (N = 1 and 2) for each of the three sequences. The results of this model are presented in figures 4(a)-(e). For each case, the magnetic moment normalized to the initial value, mz/m0, is also given. The initial current distribution that gives rise to a positive trapped magnetic moment (i.e. mz > 0) is shown in figure 4(a). The two half cross-sections carry currents with
opposite signs, although the magnitude of current density is not uniform within each half of the cross-section; this feature arises because a field-dependent Jc(B) is used in the model [39]. The application of a positive transverse field Hy = 0.5Hp leads to a reversal of the current density in the top-left and bottom-right regions of the sample, as shown in figure 4(b); a thin horizontal layer located at the top (respectively, the bottom) of the sample carries negative current (respectively, positive). These current directions correspond to those required for shielding the increasing applied field dHy/dt > 0. Consequently, both upper and lower layers of the sample no longer contribute efficiently to the z-axis magnetic moment mz. This corresponds to the (N = 1) data point in
In the next part of the cycle, both the 'S-trans' and the 'S-rem' sequences involve decreasing the transverse field to zero without any parallel field (figure 4(c)). Consequently, the results in both cases are the same, i.e. the
shielding currents in the top and bottom layers change their sign, as required for shielding the decreasing applied field dHy/dt < 0. In the rotation mode ('S-rot'), the decreasing transverse field is coupled to an increasing parallel field that induces negative current (respectively, positive) at the left-hand (respectively, right-hand) side of the sample, as required for shielding the increasing applied field, dHz/dt > 0. The corresponding current distribution is shown in figure 4(c). Figure 4(d) shows the current distribution after application of the magnetizing pulse in the 'S-rem' mode. In this case, two 'double layers' containing currents of opposite signs have appeared at the bottom-left and the top-right of the sample. The current distribution corresponding to the second data point (N = 2) is shown in figure 4(e). In the 'S-trans' and 'S-rem' modes, the application of a second increasing transverse field dHy/dt > 0, has imposed the sign of the current density at the top and at the bottom of the sample. The current distributions in these modes are very similar to each other, resulting in very close values of magnetic moment (mz/m0 = 0.73 and 0.74 for the 'S-trans' and 'S-rem' modes, respectively). Conversely, a rotation of the
magnetic field from the parallel direction to the transverse direction ('S-rot' mode) has imposed the sign of the current density along the four faces of the sample, as required for shielding both the increasing transverse field dHy/dt > 0 and the decreasing applied field dHz/dt < 0. The resulting magnetic moment mz/m0 (= 0.85) is
noticeably larger than that of the two other modes (cf. figure 3). In view of investigating the detrimental effect of a given number of such sequences on the magnetic moment mz, the model was used to compute the remaining
current distribution after six sequences identical to those used in (b)-(e) are applied and the magnetic field is removed after the last application of the transverse field. As can be seen in figure 4(f), the remaining magnetic moment at the end of the six sweeps in the 'S-rot' mode is found to be larger than the value obtained after six sweeps of the 'S-rem' mode.
These results can be summarized schematically by considering the sign of current density in the outer zones of the sample cross-section, as illustrated in figure 5. The left-hand (respectively, right-hand) part initially contains positive (respectively, negative) currents, giving rise to a positive trapped magnetic moment, mz > 0. When
transverse or parallel magnetic fields are applied, the current distribution is modified according to the sign of the electric field induced by magnetic flux density variations dB /dt in various regions of the sample. During the increasing part of the transverse field (dHy/dt > 0), the induced electric field tries to impose the sign of the current density at the top and bottom parts of the sample; J < 0 at the top, J > 0 at the bottom. Similarly, time-variations of the parallel field Hz try to impose the sign of the current density along the left-hand and right-hand
edges of the sample. In the present case, we focus on the current distribution that remains after the parallel (remagnetizing) field has decreased to 0 (dHz/dt < 0), i.e. J > 0 at the left, J < 0 at the right of the sample. A
conflict occurs at two corners of the sample (the top-left and the bottom-right) where the positive and the remagnetizing fields try to impose currents of opposite signs. The results of the model shown in figure 4 suggest the following simple rules for determining the sign of the current density in these regions: (i) the field applied most recently later imposes its sign if the fields are applied sequentially; (ii) the field corresponding to the largest dB/dt imposes its sign if the fields are applied simultaneously. When the transverse field is applied after the remagnetizing field, the two pairs of corners that are symmetric with the z-axis carry currents of the same sign and no longer contribute to the z-axis magnetic moment. When the fields are applied simultaneously (rotation of the magnetic field), however, the four corners recover currents that have the same sign as the initial current distribution and can therefore contribute efficiently to the z-axis magnetization. The assumption of relatively simple physical phenomena involved in the magnetization process, illustrated schematically in figure 5, account remarkably well for the efficiency of the 'S-rot' magnetization mode compared to the 'S-rem' mode, as is both observed experimentally and predicted by the model.
Figure 4. Modelled data of the current density distribution Jx(y, z) within the cross-section of the sample at
selected times during each of the three cycles of magnetic field ('S-trans, S-rem and S-rot') of amplitude Hmaκ =
0.5Hp—the magnetic moment normalized to the initial value, mz/m0, is given below each figure: (a) initial state;
(b) transverse field increased to Hmaκ; (c) transverse field component reduced to 0; (d) state after a magnetizing
field pulse is applied in the 'S-rem' cycle; (e) transverse field component increased to Hmaκ; (f) current
distribution after six sequences identical to those used in (b)-(e) are applied and the magnetic field is removed after the last application of the transverse field.
4.2. Influence of the field amplitude in the rotation mode
We focus now on rotating the field repeatedly by 90° between the transverse and parallel directions ('S-rot' mode). Figure 6 shows the variation of the measured c-axis magnetic moment mc with the number of rotations N
for several amplitudes of magnetic field ranging from 0.125 Hp to 2Hp. In each case, the magnetic moment is normalized with respect to its initial value. The (N = 1) measurements refer to the remaining magnetic moment after the first application of the transverse field; the corresponding values decrease as the field amplitude
increases, as expected [18]. In all cases, the first magnetic field rotation increases the magnetic moment:
mc(N = 2) > mc(N = 1). At low amplitudes (H ≤ 0.75Hp) further rotations yield a monotonic decay of the
magnetization, whereas at large amplitudes (H > 0.75Hp) the magnetic moment stabilizes at a plateau of maxima for field amplitudes lying between Hp and 1.5Hp (inset of figure 6). The existence of an optimum applied field can be understood as follows. At small amplitudes of rotation, the parallel field is not large enough to
remagnetize the sample. At large amplitudes of rotation, the sample is almost fully remagnetized between the cycles but the large value of the transverse field is responsible for a significant decay of the c-axis magnetic moment. This decay is ascribed to the modification of the current distribution within the sample as well as a reduction of the current amplitude at every point of the sample because of the Jc(B) dependence. A field amplitude of Hp was found to be sufficient to provide a satisfactory remagnetization of the sample in the
Figure 5. Schematic illustration of the sample cross-section during the application of demagnetizing and
remagnetizing fields. The signs (+) or (-) refer to the sign of the induced current density during either the increasing part of the transverse pulse (dHy/dt > 0) or the decreasing part of the magnetizing pulse (dHz/dt < 0).
Figure 6. Measured magnetic moment || c-axis at the end of each rotation cycle ('S-rot') for several amplitudes
of magnetic field ranging from 0.125HP to 2HP. The magnetic moment is normalized with respect to its initial
value m0. Inset: measured magnetic moment || c-axis at the end of the sixth cycle as a function of the normalized
4.3. Magnetization sequences in the conditions of double polarity
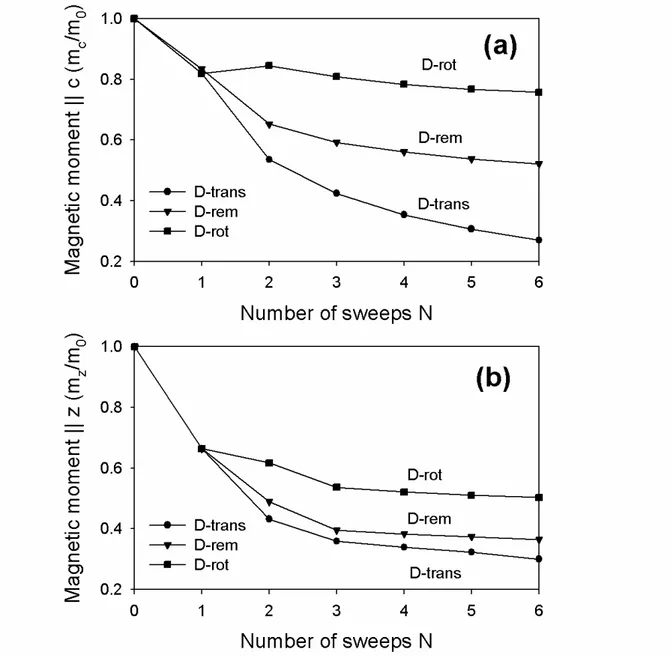
The measured magnetic moment mc versus the number of sweeps N curves for the three bipolar magnetic field
sequences ('D-trans, D-rem and D-rot') are compared in figure 7(a) for an amplitude of magnetic field equal to 0.5Hp. In comparison with the results obtained in the unipolar sequences (figure 3), the corresponding decays are significantly larger, although the qualitative features are very similar. In particular, rotating the applied field by 180° between the two transverse field directions ('D-rot' sequence) is again more efficient at remagnetizing the sample than incorporating a remagnetizing field pulse (H || c) between the transverse cycles. The modelled current distribution (not shown here) suggests that the sign of induced currents at the corners of the sample cross-section is responsible for such behaviour, as is the case for the sequences under single polarity (figure 5). The modelled magnetic moment (figure 7(b)) under identical experimental conditions is fully consistent with the experimental measurements of magnetic moment.
Figure 7. (a) Measured magnetic moment || c-axis at the end of each bipolar magnetic field cycle shown in
figure 2. The magnetic moment is normalized with respect to its initial value m0; the field amplitude is 0.5Hp. (b)
Figure 8. Normalized magnetic moment mc measured at the end of each cycle involving the rotation of a
magnetic field Hmaκ between two symmetric angular positions +α and - α with respect to the c-axis. Inset:
schematic representation of the cycles (Hmax = 0.5Hp, α = 90°, and Hmaκ = Hp, α = 30°); the magnetic moment is
measured when the transverse field component is a maximum (black arrow).
Figure 9. Modelled data of the current density distribution Jx(y, z) within the cross-section of the sample at
selected times during two cycles involving the rotation of a magnetic field Hmax between two symmetric angular
positions +α and — α with respect to the initial direction of magnetic moment (|| z): (a) initial state; (b) field applied parallel to the z-direction; (c) initial rotation of the field at an angle +α; (d) field rotated a second time; (e) state after the tenth rotation cycle; (f) state after the field is rotated back parallel to the z-axis and then decreased to 0.
Finally, we investigated the rotation of a field of constant amplitude Hmax cycled between two symmetric angular positions +α and -α with respect to the sample c-axis. Two different cycles are compared in figure 8: (i) Hmax = 0.5Hp, α = 90°; and (ii) Hmax = Hp, α = 30°. Both of these cycles share a common characteristic, in that the amplitude of the field component perpendicular to the initial direction of magnetic moment (mc) is equal to 0.5Hp
(inset of figure 8). The magnetic moment mc is measured when the transverse field component is maximum and
equal to 0.5Hp. As may be seen in figure 8, the magnetic moments measured at H = 0.5Hp, α = 90°, are significantly larger than those measured at H = Hp, α = 30°. After a few (~8) rotation cycles, the normalized magnetic moment appears to stabilize at saturation levels of 0.78 (H = 0.5Hp, α = 90°) and 0.25 (H = Hp, α =
30°). This can be understood by modelling the current distribution within the sample cross-section in each case (figure 9). The initial current distribution leading to a permanent magnetic moment is shown in figure 9(a). The application of a field parallel to the z-axis direction induces shielding currents that oppose the initial current distribution. The regions where these currents circulate is larger for H = Hp than for H = 0.5Hp, as shown in figure 9(b). Rotating the magnetic field distorts noticeably the current distribution (figure 9(c)). When the field is oriented at 30°, the z-component (equal to Hp cos(30°) ~ 0.87Hp) is associated with shielding currents that oppose the field and, therefore, reduce the magnetic moment significantly, as observed experimentally ('N = 1' point in figure 8). The current distributions at the end of the second sweep (i.e. corresponding to the 'N = 2' points in figure 8) are shown in figure 9(d). For H = 0.5Hp and α = 90°, both right-hand and left-hand border sides of the sample carry currents that have the same sign as the initial current distribution and contribute efficiently to a positive mz. Conversely, for H = Hp and α = 30°, the two border zones carrying currents giving rise to a positive
mz are restricted to a small region near the horizontal middle plane of the sample, which explains reasonably the
small value of the magnetic moment in this configuration. Further field rotations were modelled in order to obtain the current distribution after ten cycles (figure 9(e)). The corresponding modelled magnetic moments (70% and 6% of the initial value) are again consistent with the experimental data.
In order to investigate the detrimental effect of a given number (N = 10) of field rotations on the trapped field, the model was used to compute the remaining current distribution when the magnetic field is rotated back to the initial direction of magnetic moment and decreased to 0 after the last cycle. As can be seen in figure 9(f), the current distributions display an intricate 'yin-yang' shape, resulting from the preceding applied field cycles. The associated magnetic moments are 73% and 122% of the initial magnetic moment, respectively. The existence of a final magnetic moment that is larger than the initial value can be explained by remembering that the initial current distribution shown in figure 9(a) is obtained after a constant time interval (~10 s) has elapsed following initial magnetization; the magnetic moment decreases by approximately ~25-30% during this period [39]. If the same time interval is allowed for magnetic relaxation after the last cycle, both remaining moments are smaller than the initial value, as expected intuitively. The values of the remaining magnetic moments calculated after the applied field has been switched off cannot be compared to the experimental data because the torque
measurements reported here must be performed in the presence of a finite transverse field. Nevertheless, the results of the model suggest clearly that, when the applied field is tilted periodically around the direction of the permanent magnetic moment while maintaining a constant amplitude of the transverse field, the trapped flux that remains after having rotated the magnetic field back to the initial direction and switched it off is larger for smaller tilt angles. In addition, the decay of the magnetic moment resulting from such rotation cycles is much less pronounced than the 'magnetization collapse' measured with transverse fields only (cf figure 7).
5. Conclusions
We have analyzed both experimentally and numerically the remagnetization process of a melt-processed YBCO single domain that has been partially demagnetized by a magnetic field applied orthogonal to the initial direction of trapped flux. Magnetic torque measurements have proved to be an efficient tool for determining accurately the magnetic moment of small-size superconductors subjected to crossed and rotating fields. The experimental data could be reproduced successfully using a two-dimensional finite-element model based on a E-J power law and avoiding both flux-free and flux-cutting configurations. The value of magnetization was shown to be governed predominantly by the sign of the current density at the corners of the sample cross-section. This feature cannot be predicted by a model that assumes an infinite length in the direction of the crossed and rotating fields. In the present experimental conditions (aspect ratio ~1:3, field-dependent Jc), rotating the applied field by 90° or 180° between the two transverse field directions was shown to be more efficient at remagnetizing the sample than inserting a remagnetizing field pulse (H || c) of the same amplitude between the transverse cycles. A field amplitude on the order of the full-penetration field was found to be sufficient to provide a satisfactory remagnetization of the sample. The comparison between two 'tilting field' configurations corresponding to the
same amplitude of the transverse field component showed that the smaller rotation angle leads to a much less pronounced decay of the magnetic moment that remains after the magnetic field is rotated back to the initial direction and removed. The differences in the values of remaining magnetic moments after the different transverse/rotation cycles were shown to result from the complex distribution of the induced currents within the sample cross-section.
Acknowledgments
PhV is grateful to the Fonds National de la Recherche Scientifique (FNRS) for a travel grant. We acknowledge J F Fagnard and professors R Cloots and B Vanderheyden for fruitful discussions and comments. We also thank the FNRS, the University of Liège (ULg) and the Royal Military Academy (RMA) of Belgium for cryofluid and equipment grants.
References
[1] Campbell A M and Cardwell D A 1997 Cryogenics 37 567
[2] Coombs T A, Campbell A M, Storey R and Weller R 1999 IEEE Trans. Appl. Supercond. 9 968
[3] Mulcahy T M, Hull J R, Uherka K L, Abboud R G and Juna J J 2001 IEEE Trans. Appl. Supercond. 11 1729 [4] McCulloch M D and Dew-Hughes D 1998 Mater. Sci. Eng. B 53 211
[5] Kovalev L K, Ilushin K V, Kovalev K L, Penkin V T, Poltavets V N, Koneev S M-A, Akimov I I, Gawalek W, Oswald B and Krabbes G 2003 Physica C 386 419
[6] Oswald B, Best K J, Setzer M, Soll M, Gawalek W, Gutt A, Kovalev L, Krabbes G, Fisher L and Freyhardt H C 2005 Supercond. Sci.
Technol. 18 S24
[7] Álvarez A, Suárez P, Cáceres D, Granados X, Obradors X, Bosch R, Cordero E, Pérez B, Caballero A and Blanco A 2002 Physica C 372-376 1517
[8] Qiu M, Huo H K, Xu Z, Xia D, Lin L Z and Zhang G M 2005 IEEE Trans. Appl. Supercond. 15 3172 [9] Tomita M and Murakami M 2003 Nature 421 517
[10] Eisterer M et al 2006 Supercond. Sci. Technol. 19 S530
[11] Qiu M, Huo H K, Xu Z, Xia D and Lin L Z 2004 IEEE Trans. Appl. Supercond. 14 1898
[12] Ogawa J, Iwamoto M, Yamagishi K, Tsukamoto O, Murakami M and Tomita M 2003 Physica C 386 26 [13] Park S J and Kouvel J S 1993 Phys. Rev. B 48 13995
[14] Fisher L M, Kalinov A V, Savel'ev S E, Voloshin I F, Yampol'skii V A, LeBlanc M A R and Hirscher S 1997 Physica C 278 169 [15] Fisher L M, Il'enko K V, Kalinov A V, LeBlanc MAR, Pérez-Rodriguez F, Savel'ev S E, Voloshin I F and Yampol'skii V A 2000 Phys.
Rev. B 61 15382
[16] Hasanain S K, Manzoor S and Amirabadizadeh A 1995 Supercond. Sci. Technol. 8 519 [17] Pérez-Rodriguez F, LeBlanc M A R and Gandolfini G 2001 Supercond. Sci. Technol. 14 386
[18] Vanderbemden P, Dorbolo S, Hari-Babu N, Ntatsis A, Cardwell D A and Campbell A M 2003 IEEE Trans. Appl. Supercond. 13 3746 [19] Clem J R 1982 Phys. Rev. B 26 2463
[20] Clem J R and Pérez-González A 1984 Phys. Rev. B 30 5041
[21] Caballo-Sánchez A F, Pérez-Rodriguez F and Pérez-González A 2001 J. Appl. Phys. 90 3455 [22] Romero-Salazar C and Pérez Rodriguez F 2003 Appl. Phys. Lett. 83 5256
[23] Romero-Salazar C and Pérez Rodriguez F 2004 Physica C 404 317 [24] Bhagwat K V, Nair S V and Chaddah P 1994 Physica C 227 176 [25] Badía A and López C 2001 Phys. Rev. Lett. 87 127004 [26] Badía A and López C 2002 Phys. Rev. B 65 104514 [27] Badía A and López C 2003 J. Low Temp. Phys. 130 129
[28] Mikitik G P, Brandt E H and Indenbom M 2004 Phys. Rev. B 70 014520 [29] Brandt E H and Mikitik G P 2002 Phys. Rev. Lett. 89 027002
[30] Mikitik G P and Brandt E H 2003 Phys. Rev. B 67 104511 [31] Mikitik G P and Brandt E H 2004 Phys. Rev. B 69 134521
[32] Prigozhin L 1996 J. Comput. Phys. 129 190
[33] Del Valle N, Sanchez A, Pardo E, Chen D-X and Navau C 2007 Appl. Phys. Lett. 90 042503 [34] Badía A and López C 2005 Appl. Phys. Lett. 86 202510
[35] Badía A 2006 Am. J. Phys. 74 1136
[36] Prigozhin L 1997 IEEE Trans. Appl. Supercond. 7 3866
[37] Pardo E, Gömöry F, Souc J and Ceballos J M 2007 Supercond. Sci. Technol. 20 351 [38] Karmakar D and Bhagwat K V 2001 Phys. Rev. B 65 024518
[39] Vanderbemden P, Hong Z, Coombs T A, Denis S, Ausloos M, Rutel I B, Schwartz J, Hari Babu N, Cardwell D A and Campbell A M 2007 Phys. Rev. B 75 174515
[40] Hong Z, Campbell A M and Coombs T A 2006 Supercond. Sci. Technol. 19 1246 [41] Coombs T A, Samad I, Hong Z, Eves D and Rastogi A 2006 J.Phys.: Conf. Ser. 43 1011
[42] Coombs T A, Campbell A M, Murphy A and Emmens M 2001 COMPEL-Int. J. Comput. Math. Electr. Electron. Eng. 20 240 [43] Ruiz-Alonso D, Coombs T A and Campbell A M 2005 Supercond. Sci. Technol. 18 S209
[44] Brandt E H 1996 Phys. Rev. B 54 4246
[45] Amemiya N, Miyamoto K, Banno N and Tsukamoto O 1997 IEEE Trans. Appl. Supercond. 7 2210 [46] CardweU D A 1998 Mater. Sci. Eng. B 53 1
[47] Hari Babu N, Kambara M, Shi Y H, CardweU D A, Tarrant C D and Schneider K R 2002 Supercond. Sci. Technol. 15 104 [48] Cloots R, Koutzarova T, Mathieu J P and Ausloos M 2005 Supercond. Sci. Technol. 18 R9
[49] Vanderbemden P, Bradley A D, Doyle R A, Lo W, Astill D M, Cardwell D A and Campbell A M 1998 Physica C 302 257 [50] Jiang X H, AstUl D M, Lo W, CardweU D A, Coombs T A, Campbell A M and Larsen J G 1995 Physica C 249 171 [51] Cardwell DA et al 2004 Physica C 412-414 623
[52] Anderson P W and Kim Y B 1964 Rev. Mod. Phys. 36 39 [53] Higuchi T, Yoo S I and Murakami M 1999 Phys. Rev. B 59 1514 [54] Yamasaki H and Mawatari Y 2000 Supercond. Sci. Technol. 13 202
[55] Noudem J G, Reddy E S, Tarka M, Goodilin E A, Noe M, Zeisberger M and Schmitz G J 2002 Physica C 366 93 [56] Kim Y B, Hempstead C F and Strnad A R 1962 Phys. Rev. Lett. 9 306