C
ONSIDERATION OF NONLINEAR CREEP STRAIN OF SILICEOUS CONCRETE ON CALCULATION OF MECHANICAL STRAIN UNDER TRANSIENT TEMPERATURES AS AFUNCTION OF LOAD HISTORY
ULRICH SCHNEIDER1, MARTIN SCHNEIDER2, JEAN-MARC FRANSSEN3
ABSTRACT
The paper is given of an extended model for concrete in compression at elevated temperature that incorporates elastic, plastic and creep strain as a function of temperature and stress history. The mechanical strain calculated as a function of elastic strain, plastic strain and thermal induced strain. The thermal induced strain is relative independent compared to dependence of Young’s Modulus by load history. Actually the term comprises elastic, plastic and (pure) transient creep strains as we will show. A comparison is given between experimental results with cylindrical specimens and calculated results.
1 INTRODUCTION
For the calculation of deformation and load bearing capacity of structures at high temperatures, the material laws depend on loads and temperatures. Both effects are interactive and have to be included in the calculation of deformation and load bearing for the material. Analysis revealed that, at high temperature, restrained parts of the structure show a relative increase of stiffness compared to unrestraint components [1].
1
Professor, University of Technology Vienna, Karlsplatz 13/206, 1040 Wien, Austria, email: ulrich.schneider+e206@tuwien.ac.at
2
PhD Student, University of Technology Vienna, Karlsplatz 13/206, 1040 Wien, Austria, email: e0527948@stud4.tuwien.ac.at
3
Professor, NFSR Belgium, University of Liege, 1, Ch. Des Chevreuils, 4000, Liège, Belgium, email: jm.franssen@ulg.ac.be
Thermal strain doesn’t depend on load. The mechanical strain depends on both temperatures and loads [2]. Therefore this behaviour is further referred to as „load history“, because we assume transient temperatures, i.e. the temperature is a function of time.
In this paper is presented a concrete model for the calculation of separate strains of concrete under compression based on transient temperature effects. The results relate to temperature and load history.
2 GENERAL DEFINITIONS
It is generally agreed that the total strain εtot comprises the following parts: th tr pl el tot ε ε ε ε ε = + + + (1)
where: εtot total strain, εel elastic strain, εpl plastic strain, εtr total transient creep strain, th
ε thermal dilatation
It is therefore convenient to write for the pure mechanical strain:
th tot tr pl el m ε ε ε ε ε ε = + + = − (2)
During an isothermal creep test the following types of deformation occur, see Figure 1:
Fig. 1 - Deformations of concrete at ambient temperatures subjected to a constant compressive load, according to [3].
According to [4], in this case the term εm is called „load inducted thermal strain“. It
consists of transient creep (transitional thermal creep and drying creep), basic creep and elastic strains.
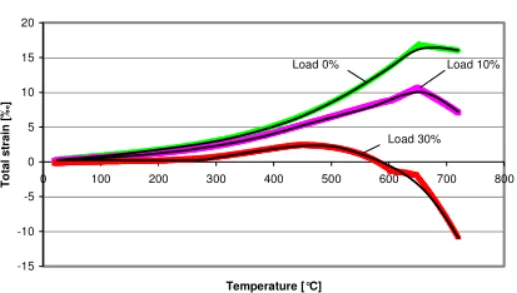
Figure 2 shows the evolution of the total strain for specimens under different constant loads during heating up based on the calculation with the concrete model presented in this paper. The high influence of load during transient heating up is to be seen. The elastic strain is very small at temperature T = 20°C compared to the high deformation at high temperatures.
Total strain at high temperatures as function of load history -15 -10 -5 0 5 10 15 20 0 100 200 300 400 500 600 700 800 Temperature [°C] T o ta l s tra in [ ‰ ] Load 0% Load 10% Load 30%
Fig. 2 - Total strain at high temperatures as a function of load history.
In the following the temperature at any time is referred as T and the maximum experienced temperature as Tmax.
3 THERMAL STRAIN
Figure 3 shows the thermal strains of concrete with different aggregates and the thermal strain of steel compared to it.
Thermal strain of concrete with different aggregates and steel
0 2 4 6 8 10 12 14 16 18 0 200 400 600 800 1000 1200 Temperature [°C] T h e rm a l s tra in [ ‰ ]
Siliceous concrete [EC2] Limestone conrete Steel 420/500 RK Lightwight concrete with expanded clay Siliceous concrete [with high siliceous content]
Fig. 3 - Thermal strain of concrete with different aggregates and steel; according to [1, 5]. According to Figure 3, the line of siliceous concrete with a high siliceous content is calculated according to a regression function:
4 6 2 8 3 11 10 * 369 . 1 * 10 * 9 * 10 * 7 . 1 * 10 * 6 . 6 − − − + − + − = T T T th ε (T 650°C) (3) 0342 . 0 * 10 * 94 . 3 * 10 * 2 8 2 5 + − = − T − T th ε (T > 650°C) (4)
It is assumed that concrete has different moisture content inside. Drying occurs through capillary pores and micro cracks. Shrinkage is accounted for by the thermal strain as this is usually determined by testing unsealed concrete specimens[3], i.e. shrinkage occurs simultaneously to thermal expansion during transient temperatures.
4 CALCULATION OF MECHANICAL STRAIN
4.1 Consideration of load history
To calculate the mechanical strain a load factor is established. This factor is calculated as follows: ) 20 ( C fc hist ° = σ α (5)
This factor presents the load history and is used for structures which are loaded in the elastic range α 0.3, whereas some researchers adopt α 0.4 as upper limit for the application of this method.
In compression, thermal induced cracks will be closed. Therefore one can observe a relative increase of stiffness compared to unstressed concrete during first heating. Even though the dehydratation of cementitious binder generally leads to a decreasing stiffness (see Figure 4).
Ratio of compressive strength at high temperatures as a function of load history
0 0.2 0.4 0.6 0.8 1 1.2 0 200 400 600 800 1000 Temperature [°C] fc(T ,P )/ fc(20 °C ) Load 20% Load 40% Load 60% Load 0%
Fig. 4 - Comparison of concrete strength for different stress-temperature history; according to [7]. Figure 4 shows that an increase of the load factor up to 0 <α 0.3 respective 0 < α 0.4 indicates very clearly the relative increase of strength compared to α = 0. A further increase of the load factor doesn’t increase significantly the stiffness.
4.2 Compressive strength
Figure 5 shows the compressive strength as a function of temperature and load history compared to measurements [1]. fc
(
20°C)
is an experimental result for the OPC tested and curedRatio of compressive strength at high temperatures as a function of load history
0 0.2 0.4 0.6 0.8 1 1.2 0 200 400 600 800 Temperature [°C] fc(T ,P )/ fc(20 °C ) Load 0% Load 10% Load 30% Load 0% (Results) Load 10% (Results) Load 30% (Results)
Fig. 5 - High temperature compressive strength of siliceous concrete being loaded or not loaded during heating up – experimental and calculated results, according to [1].
The following equations according to Figure 5 are based on experimental results. Without load history the behaviour of compressive strength as a function of temperature is according to [9]:
(
T)
f(
C)
fc ,α0 = c 20° (T ≤ 250°C) (6)(
T, 0)
= f(
20°C)
*[
1−0.0018*(T −250)]
fc α c (250°C <T ≤ 750°C) (7)(
T, 0)
= f(
20°C)
*[
0.1−0.0004*(T −750)]
fc α c (750°C< T ≤ 1000°C) (8)(
T,α0)
=0 fc (1000°C < T) (9)With load history the compressive strength is calculated as followed:
(
, 0.1)
(
20)
*[
2*10 6* 2 4.7*10 4* 0.977]
+ + − ° = = f C − T − T T fc α c (T ≤ 750°C) (10)(
, 0.3)
(
20)
*[
2*10 6* 2 6.8*10 4* 0.9875]
+ + − ° = = f C − T − T T fc α c (T ≤ 750°C) (11)(
T, =0.1)
= f(
20°C)
*[
0.25−0.001*(T −750)]
fc α c (750°C< T ≤ 1000°C) (12)(
T, =0.3)
= f(
20°C)
*[
0.38−0.00152*(T −750)]
fc α c (750°C< T ≤ 1000°C) (13)(
T,α =0.1)
=0 fc (1000°C < T) (14)(
T,α =0.3)
=0 fc (1000°C < T) (15) An interpolation is allowed. 4.3 Young’s ModulusThe Young’s Modulus as a function of load history and temperature, E
(
T = C20 °)
must be measured according to RILEM or National Code with respect to the geometry of specimens being used in the high temperature range.Ratio of Young's Modulus at high temperatures as function of load history 0 0.2 0.4 0.6 0.8 1 1.2 0 100 200 300 400 500 600 700 800 Temperature [°C] E(T ,P )/ E (20 °C ) Load 0% Load 10% Load 30% Load 0 % (Results) Load 10 % (Results) Load 30 % (Results) Range I Range II Range III Range IV
Fig. 6 - Influence of high temperature on the Young’s Modulus of siliceous concrete - experimental and calculated results; according to [1].
The following equation can be used with α = 0, α = 0.1 and α = 0.3 to calculate the Young’s Modulus at high temperature, based on measurements of E(T,α) according to Figure 6
[10] . Range I (T ≤ 320°C):
( )
(
)
[
3(
)
6(
)
2]
20 * 10 * 085 . 4 20 * 10 * 3 1 * 20° − − + − = − − T T C E T E (16)(
, 0.1) (
20)
*[
3*10 6* 2 2.311*10 3* 1.04505]
+ − ° = = E C − T − T T E α (17)(
T, =0.3) (
=E 20°C)
*[
2*10−6*T2−1.57*10−3*T+1.0306]
E α (18) Range II (320°C <T ≤ 450°C):( ) (
)
[
3 5 2 8 3]
* 10 * 2801 . 1 * 10 * 0081 . 1 * 10 * 2445 . 3 89406 . 0 * 20 C T T T E T E = ° − − + − − − (19)(
T, =0.1) (
=E 20°C)
*[
−5.1*10−6*T2+2.73*10−3*T+0.262]
E α (20)(
, 0.3) (
20)
*[
4*10 6* 2 2.5*10 3* 0.342]
+ + − ° = = E C − T − T T E α (21) Range III (450°C <T ≤ 600°C):( ) (
)
[
7.52*103*( 400)]
* 45 . 0 * 20° − − − = T e C E T E (22)(
T, =0.1) (
=E 20°C)
*[
−6*10−8*T3+1*10−4*T2−0.056*T +10.874]
E α (23)(
) (
)
[
T]
e C E T E 0.0022* * 767 . 1 * 20 3 . 0 ,α= = ° − (24) Range IV (T > 600°C):( ) (
)
[
4*103*( 20)]
* 20° − − − = T e C E T E (25)(
) (
)
[
T]
e C E T E 0.0016* * 82554 . 0 * 20 1 . 0 ,α = = ° − (26)(
) (
)
[
T]
e C E T E 0.001* * 86 . 0 * 20 3 . 0 ,α= = ° − (27)Furthermore it was found that the Young’s Modulus is relative constant above α = 0.3, as shown in Figure 7. Considering α ≡ 0.3 is therefore acceptable when α > 0.3.
Ratio of Young`s Modulus at high temperatures as a function of load history
0 0.1 0.2 0.3 0.4 0.5 0.6 0.7 0.8 0.9 1 0 10 20 30 40 50 60 70 80
Ration of load history [%]
E(T ,P )/ E (2 0° C ) 150°C250°C 350°C 450°C 550°C 650°C 750°C
Fig. 7 - Young’s Modulus of siliceous concrete being loaded during heating up; according to [9]. 4.4 Ultimate strain
The ratio between ultimate strain at 20°C εu
(
T =20)
and ultimate strain as a function of load history and temperature εu( )
T,α is shown in Figure 8. It’s also based on measurements[1]
.
Ratio of ultimate strain at high temperatures
0 50 100 150 200 250 300 350 400 0 200 400 600 800 1000 Temperature [°C] R a ti o of ul ti m a te s tr a in a t 2 0 °C an d u lti mate str a in at el ev ated temp er a tu res [ % ] Load 0% Load 10% Load 30%
Fig. 8 - Ratio of ultimate strain of heated and loaded/not loaded specimens compared to specimens tested at 20°C; according to [1].
According to Figure 8, the material behaviour is a function of f(α), )Δεu(T and
(
T C)
u = 20° ε [9] . εu( )
T,α is calculated as follows:( )
,α ε (20 ) ε ( )* (α) εu T = u °C +Δ u T f (28) with( )
3 10 * 8 . 7 ,α ≤ −εu T as an upper limit for all cases (α=0). Where:
3 10 * 2 . 2 ) 20 ( °C = − u ε (29)
[
4.2*10 ( 20)*5.4*10]
*(
20)
) ( = 6+ − 9 − Δ T − T − T u ε (30) ) (αf is a function of load history. A linear interpolation is applied for intermediate values of load factor α. f(α)=1 (α=0), f(α)=0.227 (α=0.1), f(α)=−0.095 (α0.3)
4.5 Elastic strain Elastic strain is:
( )
α σ( )
α ε , ) ( , T E t T el = (31)where: σ
( )
t stress at time t,( )
T,αE Young’s Modulus as a function of load history and temperature 4.6 Plastic strain
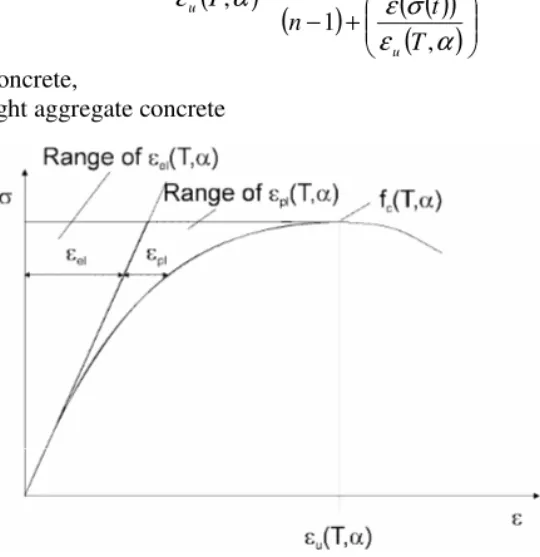
Two parts of the stresses induced strain at high temperatures can be explained as stress-strain relationship according to Figure 9 and the following equations:
( )
( )
( )
( )
( )
(
)
( )
( )
( )
n u u c T t n n T t T f t ¸¸ ¹ · ¨¨ © § + − = α ε σ ε α ε σ ε α σ , 1 * , * , (32)where: n=3 ordinary concrete,
n=2.5 lightweight aggregate concrete
Fig 9 - Range of elastic and plastic strain of stress-strain-relationship.
The elastic and plastic strains should generally be taken from measured stress-strain-relationship. Here is:
( )
α ε(
σ( ) ( )
ε α α)
ε(
σ( )
α)
εpl T, = t , u T, ,T, − el t,T, (33) respectively( )
α ε(
σ( ) ( )
ε α)
ε(
σ( )
α)
εpl T, = t, u T, ,T − el t ,T, (34) whereby 0εpl ≡ if εel >εplA numerical approximation for the ascending branch of the stress-strain-relationship is:
( )
) , ( ) ( * , α σ κ α ε T E t T pl = (35)The function κ given in [2]:
» » ¼ º « « ¬ ª ¸¸ ¹ · ¨¨ © § − − = 4 ) , ( ) ( 1 1 * 2 1 α σ κ T f t c (36)
4.7 Total mechanical strain
Thermal induced total strain minus thermal strain is given in the following equation. This equation comprises elastic, plastic and creep contents [5].
th tot tr pl el m ε ε ε ε ε ε = + + = − (37)
( )
σ( ) (
( )
ϕ)
ε = *1+ T E t T m (38)The thermal induced strain is relatively independent compared to dependence of Young’s Modulus by load history [11] and the term
( )
( )
T E t cr tr σ ϕε , = * defined as transient creep in literature
[12]
. Actually the term comprises elastic, plastic and (pure) transient creep strains as we show below [10]. The elastic strain is calculated in the following equation:
( )
α ε( )
ε( )
αεel T, = el T −Δ el T, (39)
The ϕ-function is calculated in the next equation. It utilizes new parameters as shown in table 1, those were obtained by recent scientific results [2, 6] based on ongoing research.
(
)
2 0(
)
31*tanh *T 20 C *tanh *T T C
C w − + − g +
= γ γ
ϕ (40)
Tab. 1 - Parameters for transient creep functions of structural concretes; according to [5].
Parameter Dimension Quarzit
concrete Limestone concrete Lightwight concrete C1 1 2.50 2.50 2.50 C2 1 0.70 1.40 3.00 C3 1 0.70 1.40 2.90 0 γ °C-1 7.5*10-3 7.5*10-3 7.5*10-3 Tg °C 800 700 600 3 5 . 0 3 10 * 2 . 2 * 10 * 3 . 0 − + − = w w γ with γw ≤2.8*10−3 (41)
w is the moisture content of concrete in % by weight [5].
The equation above is similar to the equation for creep strain at room temperature. That is why the ϕ-function is called „transient creep function“ in RILEM literature [11], although it was
known that ϕ contains in addition plastic and small elastic strain parts [11]. Therefore it was also called “thermal induced strain“ according to [13]. The separate creep part εtr will not be calculated within the proposed calculation procedure described below.Figure 10 shows the ϕ-function for siliceous concrete.
phi-function for siliceous concrete
0 0.5 1 1.5 2 2.5 3 3.5 4 0 200 400 600 800 1000 Temperature [°C] phi-func ti on Load 10% Load 20% Load 30% Load 40% Load 50% Load 60% Equation
Fig. 10 - Transient creep function for siliceous concrete; according to [5].
After calculation of plastic strains and elastic strains the pure transient creep strain should be calculated as follows:
( )
α ε( )
ε( )
α ε( )
αεtr T, = m T − el T, − pl T, (42)
5 DEVELOPMENT OF DIFFERENT STRAINS IN COMPRESSION AT HIGH
TEMPERATURES IN A CONCRETE MODEL BY TRANSIENT EFFECTS
5.1 Thermal strain during heating up
The thermal strain increases in any case by heating up to 650°C. Above that point thermal strain gradual slightly decreases until the final strain is 14.8 ‰ at a temperature of 1000°C. At each time step there is a final strain according to the reached temperature. It is essential:
( )
T th nth ε
ε = (43)
During cooling down the thermal strain is irreversible. That is because in concrete crack opening starts during heating up to the maximum temperature. These cracks don’t close completely during cooling down, which leads to residual deformations [1].
5.2 Elastic and plastic strain during heating up including load history Any time in the ascending branch the elastic strain is:
( )
α ε ε el T,n
el = (44)
When cooling down, the elastic strain is reversible. The deformation energy could be released after heating up assuming that further cracking takes places during cooling, which is not always the case.
Plastic strain cannot decrease because it is irreversible. Subsequent behaviour in the ascending and descending branch of the stress-strain-relationship is assumed. The plastic strains are calculated as described before including the load history in stress-strain-relation. If temperature or load history decreases the plastic strain, then the deformation is taken as permanent.
( )
α ε ε max pl T, n pl = (45)For cooling down the deformations are constant. In the range of εpl+εel ≥εu it may be
calculated according to the linear model of EC2 [6].
Tab. 2 - Ultimate strain and stress induced strain in ascending and descending branch of the stress-strain-relationship; according to [6].
Concrete
temperature εu
( )
T,α see chapter 4.4 εu,1( )
T 20 … 1100 °C( )
,α ε (20 ) ε ( )* (α) εu T = u °C +Δ u T f and( )
3 10 * 8 . 7 ,α ≤ − εu T( )
3*10 5* 0.0199 1 , = − − T T u ε (46)where: εu
( )
T,α ultimate strain in ascending branch( )
αεu,1T, maximum strain of the descending branch of stress-strain-relationship, according to [6]
5.3 Transient creep during heating up and load history
The component of deformation of the creep-function is irreversible. The consideration is discrete. For each timestep exists a point of the creep function, that rises to the thermal induced strain and the part of transient creep strain depends on load history and temperature [14].
By increasing the temperature and changing the load simultaneously, the parts of plastic and transient creep are irreversible. The part of elastic strain Δ is reversible. The stepwise εel
calculation of strains based on the total strain approach is done as follows:
( )
α ε ε ε 1 tr T, n tr n tr = +Δ − (47) where: n new timestep with T=T(t) and n-1 old timestepwith εtrn ≥εtrn−1 (temperature increase and stress increase)
( )
1 , = − − Δ n tr n tr tr T α ε ε ε (48)with εtrn <εtrn−1 (temperature increase and stress decrease)
( )
α ε ε( )
α εtr T, =max trn −Δ eln T, Δ (49) Whereas Δ is: εel( )
T el( )
T el( )
T el α ε α ε ε = − Δ , , (50)From the basic equations we receive:
( )
ε( )
α ε( )
α ε( )
α( )
σ( ) (
( )
ϕ)
ε = *1+ T E t T m (52)( )
( )
( )
T E t T el σ ε = (53)( )
( )
σ ε( )
α ε( )
α ε( )
α ϕ , , , * T T T T E t tr el pl +Δ + = (54)For the pure transient creep we receive finally:
( )
α ϕ( )
σ( )
ε( )
α ε( )
α ε , * T, T, T E t T pl el tr = − −Δ (55)It is astonishing to observe that the influence of load history originates from plasticity effects and to a small extent from the load effect on the modulus of elasticity.
6 Results by transient effects
The calculation results of thermal induced strain, considering unsteady temperatures and loads according to the material laws above, are shown in Figure 11. The specimens are cylinders with 80 mm diameter and 300 mm height. Heating rate is 2 K/min. The compressive strength at 20°C is 38 MPa. The results are obtained from heated specimens under different stress-time-relationships [11].
There is a rather good agreement between measured and calculated results. The results are calculated with consideration of material laws depending on temperature and load history as discussed before. Stress-Time-Relationship 0 2 4 6 8 10 12 14 16 18 0 5000 10000 15000 20000 25000 Time [sec] S tr ess [M P a ]
Comparision between measuring results and caculation results 0 5 10 15 20 25 30 35 40 0 200 400 600 800 Temperature [°C] M ech an ical st ra in [ ‰ ] Calculation Measuring Stress-Time-Relationship 0 2 4 6 8 10 12 14 16 18 20 0 5000 10000 15000 20000 25000 Time [sec] St re s s [ M Pa ]
Comparision between measuring results and caculation results 0 5 10 15 20 25 30 35 40 0 200 400 600 800 Temperature [°C] M ech an ical st ra in [ ‰ ] Calculation Measuring
Stress-Time-Relationship 0 5 10 15 20 25 0 5000 10000 15000 20000 25000 Time [sec] St re s s [ M Pa ]
Comparision between measuring results and caculation results 0 5 10 15 20 25 30 35 40 0 200 400 600 800 Temperature [°C] M ech an ical st ra in [ ‰ ] Calculation Measuring Stress-Time-Relationship 0 5 10 15 20 25 0 50 100 150 200 250 300 350 400 Time [sec] St re s s [ M P a ]
Comparision between measuring results and caculation results 0 5 10 15 20 25 30 35 40 0 200 400 600 800 Temperature [°C] M ech an ic al st ra in [ ‰ ] Calculation Measuring
Fig. 11 - Comparison between calculated results and experimental results, according to [11].
7 OUTLOOK
To calculate the load bearing behaviour of structures subjected to fire the material laws for the most important material properties of ordinary concrete were developed. This model was made to complete the existing concrete model of EC2 to consider the thermal creep and the effect of load history. It is possible with this model to consider the load history in all phases of thermal exposition. With this complex model one can calculated total strain with variances of load history and variances of temperature. Different parts of deformations are approximated with discrete equations interacting in concrete model. This technique is usable to calculate realistic behaviour of structures [15, 16], also in the case of cooling, which is not allowed in EC2.
By considering the load history during heating up in several cases an increasing load bearing capacity due to a higher stiffness of concrete may be obtained. With this model it is possible to consider the thermal-physical behaviour of material laws for calculation of structures. By applying this model to the ordinary calculation system of EC2 it will lead to a better evaluation of the safety level. This opens space for optimizing concrete structure and material design.
8 REFERENCES
[1] Schneider, U., Diederichs, U.; Weiß, R.: Hochtemperaturverhalten von Festbeton, Sonderforschungsbereich 148 – Brandverhalten von Bauteilen – TU Braunschweig, 1977
[2] Schneider, U.; Morita, T.; Franssen, J.-M.: A Concrete Model Considering the Load History Applied to Centrally Loaded Columns Under Fire Attack, Fire Safety Science – Proceedings of the Fourth International Symposium, Ontario, 1994
[4] Khoury, G.A.; Grainger, B.N.; Sullivan, P.J.E.: Transient thermal strain of concrete: Literature review, conditions with specimens and behaviour of individual constituents, Magazine of Concrete Research Vol. 37 No. 132, 1985
[5] Schneider, U.; Lebeda, C.; Franssen, J.-M.: Baulicher Brandschutz, Bauwerk Verlag GmbH, Berlin, 2008
[6] Eurocode 2: Design of concrete structures – Part 1-2: General rules – Structural fire design; 2004 [7] Xudong, S. et al: Concrete Constructive Relationships Under Different Stress-Temperature-Paths,
Journal of Structural Engeneering, 12/2002
[8] RILEM TC HTC 200: Mechanical Concrete Properties at High Temperature - Recommendation Part 1: Mat.&Struct., Vol. 44, Paris, June 2007
[9] Schneider, U.: Concrete at High Temperatures – A General Review, Fire safety Journal, 13, 1988 [10] Schneider, U., Diederichs, Rosenberger, W.; U.; Weiß, R.: Hochtemperaturverhalten von Festbeton,
Sonderforschungsbereich 148 – Brandverhalten von Bauteilen – TU Braunschweig, 1980
[11] Schneider, U.: Ein Beitrag zur Frage des Kriechens und der Relaxation von Beton unter hohen Temperaturen, Institut für Baustoffe, Massivbau und Brandschutz, TU Braunschweig, Heft 42, Braunschweig, 1979
[12] RILEM TC 129-MHT: Test Methods for Mechanical Proberties of Concrete -Recommendation: Part 7: Transient creep for service and accident conditions, Mat.&Struct., Vol. 31, Paris, June 1998 [13] Khoury, G.A.; Grainger, B.N.; Sullivan, P.J.E.: Strain of concrete during first heating to 600°C
under load, Magazine of Concrete Research Vol. 37 No. 133, 1985
[14] Bockhold, J.; Stangenberg, F.: Modellierung des nichtlinearen Kriechens von Beton, Beton- und Stahlbetonbau 99, Heft 3, Verlag Ernst & Sohn, Berlin 2004
[15] Franssen, Jean-Marc: Plastic Analysis of Concrete Structures Subjected to Fire in: fib Task Group 4.3 - Fire Design of Concrete Structures: Whats now? What next? Milano 2004
[16] Li, L.; Purkis, J.: Stress-strain constitutive equations of concrete material at elevated temperatures in: Fire Safety Journal (40) 2005
![Fig. 1 - Deformations of concrete at ambient temperatures subjected to a constant compressive load, according to [3]](https://thumb-eu.123doks.com/thumbv2/123doknet/6438078.170829/2.1263.364.891.708.1118/deformations-concrete-ambient-temperatures-subjected-constant-compressive-according.webp)
![Fig. 4 - Comparison of concrete strength for different stress-temperature history; according to [7]](https://thumb-eu.123doks.com/thumbv2/123doknet/6438078.170829/4.1263.367.909.643.937/comparison-concrete-strength-different-stress-temperature-history-according.webp)
![Fig. 5 - High temperature compressive strength of siliceous concrete being loaded or not loaded during heating up – experimental and calculated results, according to [1]](https://thumb-eu.123doks.com/thumbv2/123doknet/6438078.170829/5.1263.389.917.137.441/temperature-compressive-strength-siliceous-concrete-experimental-calculated-according.webp)
![Fig. 6 - Influence of high temperature on the Young’s Modulus of siliceous concrete - experimental and calculated results; according to [1]](https://thumb-eu.123doks.com/thumbv2/123doknet/6438078.170829/6.1263.374.900.157.436/influence-temperature-modulus-siliceous-concrete-experimental-calculated-according.webp)
![Fig. 7 - Young’s Modulus of siliceous concrete being loaded during heating up; according to [9]](https://thumb-eu.123doks.com/thumbv2/123doknet/6438078.170829/7.1263.388.908.132.441/fig-young-modulus-siliceous-concrete-loaded-heating-according.webp)
![Tab. 1 - Parameters for transient creep functions of structural concretes; according to [5]](https://thumb-eu.123doks.com/thumbv2/123doknet/6438078.170829/9.1263.151.1134.1049.1273/tab-parameters-transient-creep-functions-structural-concretes-according.webp)
![Fig. 10 - Transient creep function for siliceous concrete; according to [5].](https://thumb-eu.123doks.com/thumbv2/123doknet/6438078.170829/10.1263.364.909.312.634/fig-transient-creep-function-siliceous-concrete-according.webp)
![Fig. 11 - Comparison between calculated results and experimental results, according to [11]](https://thumb-eu.123doks.com/thumbv2/123doknet/6438078.170829/13.1263.165.1110.136.631/fig-comparison-calculated-results-experimental-results-according.webp)
