This is an author-deposited version published in:
http://oatao.univ-toulouse.fr/
Eprints ID: 8960
To cite this version:
Martinez, Francisco Javier and Canales, Margarita and Alcalà, Noelia and
Jiménez, Miguel Angel and Yahiaoui, Malik and Ural, Aydemir Güralp
and Paris, Jean-Yves and Delbe, Karl and Denape, Jean Analysis of wear
mechanism in TPU-steel contact pair by means of long stroke tribometer
tests. (2012) In: LubMat'12, 6-8 June 2012, Bilbao, Spain.
O
pen
A
rchive
T
oulouse
A
rchive
O
uverte (
OATAO
)
OATAO is an open access repository that collects the work of Toulouse researchers and
makes it freely available over the web where possible.
Any correspondence concerning this service should be sent to the repository
administrator:
[email protected]
Analysis of wear mechanism in TPU-steel contact pair
by means of long stroke tribometer tests
F.J. Martínez1, M. Canales1, N. Alcalá1, M.A. Jiménez1, M. Yahiaoui2, A.G. Ural2, J.-Y. Paris2, K. Delbé2, J. Denape2
1
Materials and Components Division, Instituto Tecnológico de Aragón (ITA), Zaragoza, Spain
2
University of Toulouse, Manufacturing Engineering Laboratory, National Engineering School of Tarbes, Tarbes, France
Abstract
A complete wear characterisation of a thermoplastic polyurethane (TPU) sliding against steel is presented. Wear tests were performed using a long stroke tribometer under sliding reciprocating movement and dry conditions. The dependence of some of the most significant parameters was studied. Before and after wear tests, complementary observations, analyses and measurements were also performed on both contacting materials. These various characterisations involved weight loss of TPU, physico-chemical and thermo-mechanical analyses of TPU, included topographical measurements and morphological observations of worn surfaces of contacting pairs and calculations of the temperature rise generated by friction.
Keywords:
Thermoplastic polyurethane, Long stroke tribometer, Wear.
1 INTRODUCTION
A study of thermoplastic polyurethane (TPU) wear in contact with steel under reciprocating and dry conditions is presented in this work. This study is carried out, firstly, by means of wear tribometer tests, and secondly, by means of a material analysis of the samples involved in the tests. The aim of this analysis is to study the physical phenomena governing the wear process in the contact pair. The parts involved in the contact pair are obtained from an industrial component, a lift car installation: guide shoes, made of TPU, which slide over a fixed lift guide, made of machined steel.
An initial step of a wear tribometer characterization should include the influence of several variables in the tests: applied load, travelled distance, test velocity or test temperature. Additionally, other parameters should be controlled along wear tests: the shape of the material to be tested, the presence of coatings in the contact, shape and velocity of abrasive particles in the test, type of contact and possible influence of humidity in tests. Tribometer tests are one of the most studied test types in literature to evaluate wear under low intensity test conditions. One of the tribometer configuration is linear reciprocating one. Based on ASTM G133-05 standard, this test covers a periodic linear movement with relative movement between both sliding contact surfaces. One of the parts of the test acts a pin which slides over a fixed flat contact part. Load, generally constant, is applied in perpendicular direction to this flat contact part. The movement is applied to the pin with a form depending on the design of the mechanism which guides its movement. Authors who have developed works in tribometer tests under reciprocating configuration analysing the influence of different factors (velocity, load, countermaterial rugosity) are Suh et al. [1], Song et al. [2] and Franklin [3]. The tribometer wear test methodology presented in the work has as antecedent the work described by Martínez [4]. A wear law between TPU and steel was obtained by characterisation from results of wear tests carried out in commercial tribometer PLINT TE77 of short stroke, 25
mm of maximum stroke, under reciprocating configuration and dry conditions. A robust test procedure was carried out in order to attain test repeatability under the same conditions, fixing the influence of some of the test variables, such as frequency, stroke and temperature. In order to solve the inconveniences of testing with this commercial short stroke tribometer, a long stroke tribometer was designed and developed, with broader specifications in stroke, velocity and temperature control than in the short commercial one.
This paper, after a short description of the new long stroke tribometer, shows the methodology followed to characterise wear tests with the parallel analysis of the material of both parts involved in the contact pair, including acoustic emission measurements.
2 DESCRIPTION OF THE WEAR TEST DEVICE 2.1 Device configuration
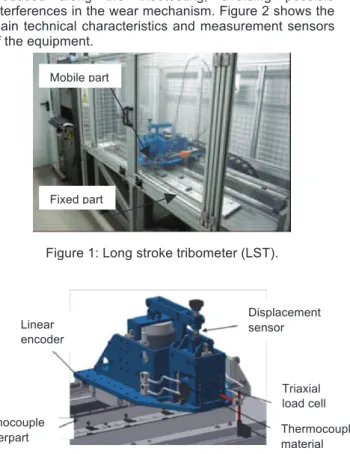
Long stroke tribometer, hereinafter LST, is developed in order to study the tribological behaviour of two materials in flat-in-flat contact and relative reciprocating motion. Figure 1 shows a general view of the tribometer. The mobile part of the tribometer has the next characteristics: vertical load, applied by means of a magnetic engine with cantilever 2.3:1, up to 1320 N; load measured by means of a triaxial load cell and torque (Fz = 2200 N, Fx = Fy = 1100 N, Mz =
28 Nm, Mx = My = 56 Nm); displacement sensor also
located in order to measure a range up to 50 mm; thermocouples placed at different zones in order to control the temperature evolution of parts involved in the contact, up to 100 ºC; linear movement, with a maximum travel of 1446 mm, established by means of a linear encoder (3.5 kHz / 2.2 V). Maximum values of acceleration and linear velocity are 5 m/s2 and 2 m/s, respectively. Maximum horizontal stroke 1400 mm. The countermaterial is placed by screwing in the test frame. The tribometer allows the testing with lubrication condition and cooling environment as well. Lubrication can be fixed by regulation in drop or pulverization way by nozzle. The cooling is made by air at 6 bar pressure that allows a maximum flow of 70 l/min.
This flow helps to remove from test surface the debris produced along the tribotesting, avoiding possible interferences in the wear mechanism. Figure 2 shows the main technical characteristics and measurement sensors of the equipment.
Figure 1: Long stroke tribometer (LST).
Figure 2: Measurement sensors of LST.
This methodology is carried out with tests in which specimens are extracted from lift car application parts, maintaining the same contact faces as in the real application. On the one hand, a TPU specimen of parallelepiped shape of 25 mm long, 15 mm width and 10 mm height is extracted from the guide shoe insert. This TPU specimen is encapsulated in a tool of steel, which is screwed to the loading arm of the tribometer. This whole part, specimen and encapsulating tool, acts as moving pin of the configuration. On the other hand, a rectangular sheet (1100 mm long, 34 mm width and 9 mm height) is extracted from the lift guide and is screwed to the frame of the tribometer, acting as the fixed counterpart of the configuration.
(a) (b) Figure 3: Parts of the contact pair.
Figure 4: Sketch of the configuration.
Mechanical properties of commercial TPU are detailed next: shore A hardness: 95; density: 1.23 g/cm3, tensile resistance: > 45 N/mm2, module at 100%: > 20 N/mm2, module at 300%: > 42 N/mm2, elongation at break: > 440%.
On the other hand, the counterpart steel corresponds to brushed steel with the following chemical composition (maximum percentage): carbon 0.21%, manganese 1.50%, silicon 0.40%, phosphorus 0.045% and sulphur 0.045%. Mechanical properties of this material are: load at break: 410-520 N/mm2 and minimum yield: 275 N/mm2. In general, a methodology set up for wear testing in tribometer should include the analysis of the most critical parameters in the test in order to assure the test repeatability and reproducibility [5]. In the antecedent to this work, developed in a commercial tribometer of shorter stroke, it was critical the control of parameters such as the temperature in the contact pair, the counterface roughness evolution and the test frequency at which the tests are done [4]. In the current work, one of the objectives of the long stroke tribometer testing is to improve the control of the test parameters in a more precise way. Regarding contact temperature, an improvement is produced in long stroke tribometer due to the fact that a longer stroke and a higher time are required for the counterpart to dissipate the heat properly along tests. Regarding velocity control, except at initial and final test strokes, where acceleration and deceleration stages take place, linear velocity can be covered almost all the stroke set up in the test. This fact does not limit the test frequency or velocity in order to attain repeatability of the tests, as in previous wear test methodology with shorter stroke tribometer [4]. All of improvements in control parameters approach the test conditions to those of real application.
Taking into account the previously commented specifications of the long stroke tribometer, a test planning at different applied load and test temperature was developed in order to analyze the separated influence of these variables in the TPU wear as well as the crossed effects in TPU wear between variables. In the next sections, examples of these tests will be described in order to show the applicability of this methodology to different cases.
3 MATERIAL CHARACTERIZATION
3.1 General structure of TPU and physical properties Thermoplastic polyurethanes (TPU) belong to the class of elastomers. They combine vulcanized rubber mechanical properties and processability of thermoplastics. TPU morphology is consisting of a linear segmented semi-crystalline copolymer alternating with short hard semi-crystalline segments (urethane blocks) connected to rather long soft segments (amorphous and flexible chains). Soft segments can be a mixture of polyether and polyester. Polyester gives better mechanical properties and chemical resistance while polyether provides higher hydrolyse and micro-organisms resistance.
3.2 Chemical identification
Chemical identification was carry out by Fourier Transformed Infra-Red Spectoscopy (FTIR). This technique consists to measure the molecular emission and absorption spectra of the TPU under IR radiations (figure 5). Results prove PTU is an ester-polyurethane. Moreover, thermogravimetric analysis (TGA) shows that PTU does not contain mineral addition.
Fixed part Mobile part Linear encoder Thermocouple counterpart Displacement sensor Triaxial load cell Thermocouple material Sample holding Steel counterpart TPU sample
3.3 Thermo-mechanical analyses
Glass transition temperature and melting temperature of TPU was measuring by Differential Scanning Calorimetry (DSC). This thermo-analytical technique measures the difference in the amount of heat required to increase the temperature of the TPU comparing to a reference, which follows the same temperature throughout the experiment. As expected for TPU materials, a low glass temperature was found around – 40 °C associated to soft segments behaviour. Two melting temperatures were also recorded at 206°C and 210°C resulting from the hard segments collapse (figure 6).
Figure 5: Absorption spectrum of TPU by FTIR.
Figure 6: Heat flow as a function of temperature of TPU by DSC.
Figure 7: Shear modulus evolution of TPU for low temperatures (from – 90°C to 25°C) obtained by DMTA. Dynamic Mechanical Thermal Analysis (DMTA) confirmed these results. This rheological technique permits the determination of the complex shear modulus G = G’ + jG’’
of the TPU (where G’ is the conservative component of the modulus and G’’ is the loss component) by applying a sinusoidal strain (0.01% at 100 Hz) as a function of temperature (figure 7). Elastic modulus reaches 120 MPa at 20°C and further investigations shows a reduction to 80 MPa à 75°C. Thus, a rubbery behaviour of the TPU is expected over room temperature as a consequence of its viscoelastic response under mechanical stresses.
In addition, hardness measurements (EN ISO 868) indicate 54 Shore D at room temperature and 40 Shore D at 75°C.
3.4 Surface characterization
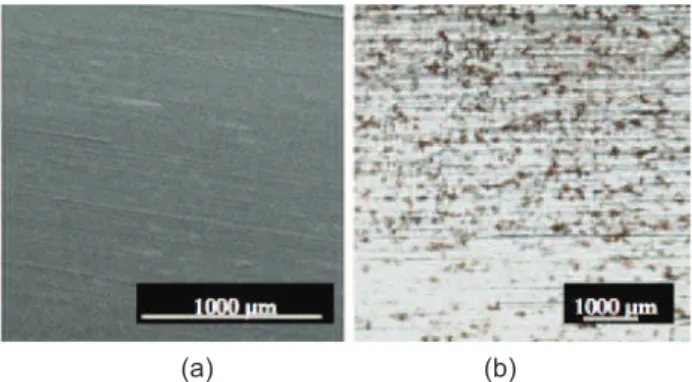
Surface observations provide surface morphology and evaluate the presence of surface defects (figure 8). 3D optical profilometer gives initial roughness parameters: average roughness Ra, quadratic roughness Rq and
maximum height of the profile Rt are respectively 0.3 µm,
0.4 µm and 9.5 µm for TPU and 4.9 µm, 5.9 µm and 31,2 µm for steel, which reveals a significant difference between the slider (TPU) and the steel counterface.
(a) (b)
Figure 8: Observation of initial surfaces (a) of the TPU slider (SEM) and (b) the steel counterface (OM).
4 EXPERIMENTAL PROCEDURE 4.1 Test conditions
A first series of tests was performed at room temperature (21 ºC) with a sliding speed v of 0.32 m/s over a traveled distance d of 500 m (stoke of 0.5 m) and under a constant normal load Fn of ranged from 166 N to 401.3 N,
corresponding to mean contact pressures ranged from of 0.44 MPa to 1.07 MPa. This range of contact pressures is within the real working application. During experiments, air was blowing (1 bar) over the counterpart.
A second series of experiments was focused on the same sliding speed (0.32 m/s) and traveled distance (500 m), but on different temperature conditions T from 37,5°C to 75°C, under a constant load of 330 N (0.88 MPa). In that case, no air was blowing over the counterpart. Temperature tests were repeated twice for each condition. 4.2 Friction coefficient signal treatment
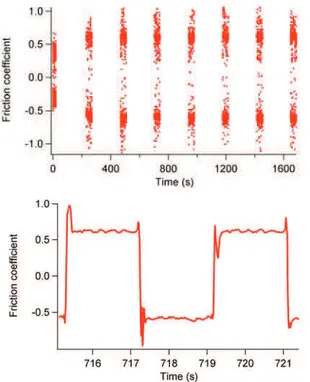
The friction coefficient µ was recorded each 210 s during 40 s as illustrated by figure 9a. During one way stroke, corresponding to a half period, friction coefficient often reaches maximum values higher than 1 at the beginning and at the end, respectively related to sample acceleration and deceleration (figure 9b).
An average fitting curve of the absolute values of friction coefficients shows two stages identified as a transitory stage lasting approximately 300 s and characterized by an increase in friction coefficient, followed by a steady stage with an oscillating friction coefficient (figure 10).
Finally, a box and whiskers chart is used to characterize the mean value and the scatter extend of the fiction
coefficient population (figure 11). Q1 and Q5 quartiles
represent 5 and 95 % of the overall population and define the maximum extents. Q3 is the mean value (i.e. 50 % of
a µ series). Q2 and Q4 represent 25 and 75 % of µ
population and thus delimit the discrepancy around the mean value, which isn’t necessary symmetric. Q1 and Q5
are not fixed at 0 and 100 % to avoid extreme outlier values due to acquisition setup.
Figure 9: Friction coefficient sequential measurement signal (a) at Fn = 215.5 N and v = 0.32 m/s on d = 500 m,
(b) highlight on signal periods.
Figure 10: Absolute value of the friction coefficient and its mean value along experiment.
Figure 11: Fiction coefficient box and whiskers plot parameters.
4.3 Wear treatment
Wear measurements were carry out by weight difference of TPU specimen with its encapsulating tool, before and after each test (precision 10-5 g). Wear volumes W were calculated by dividing the weight difference of TPU by density.
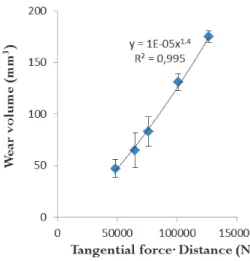
Classical Archard’s model (wear volume vs. applied load × distance) or energetic approach (wear volume vs. tangential force × distance) was used to quantify the wear damage.
5 EXPERIMENTAL RESULTS
5.1 Effect of load at room temperature
A slight rise of friction coefficient with increasing loads was noticed (figure 12) associated to a similar evolution of the absolute acoustic energy (figure 13).
Figure 12: Effect of load on friction coefficient for a constant sliding distance of 500 m at 0.32 m/s.
Figure 13: Effect of load on acoustic emission activity for a constant sliding distance of 500 m at 0.32 m/s.
Figure 14: Archard’s model applied to tests carried out under various loads.
Wear volumes are ranged between 47.4 mm3 at 166 N and 175.2 mm3 at 401 N. Associated Archard’s wear rates reach respectively 5.7·10-4 mm3·N-1·m-1 and 8.7·10-4 mm3·N-1·m-1. However, no linear evolution of wear was observed with increasing applied loads or tangential forces (figures 14 and 15). As a consequence, wear is not proportional to load, but wear accelerates when load increases. Further experiments show that wear is no more proportional to the sliding distance.
Figure 14: Energetic approach applied to tests carried out under various loads.
5.2 Observation of the worn surfaces
General observations of TPU samples show slight longitudinal scratches and agglomeration of numerous debris out of the sliding track, in the front side of the sample.
(a)
(b)
Figure 15: (a) Example of wear damage on TPU at 166 N (tilt 60°) showing a Schallamach wave pattern (0.32 m/s,
500 m, room temperature) and (b) roll formation. SEM observations reveal a typical Schallamach wave pattern [6]. This type of damage is usually observed on soft and smooth elastomeric materials sliding on hard and
flat surfaces (figure 14a). This phenomenon is dominated by the onset and the propagation of elastic instabilities in the form of waves, but it occurrence is not yet completely understood. The relative displacement between slider and plate produces deformation and interfacial relaxation like a local strick-slip process or a macro-dislocation mode of propagation [7]. These waves cross the sliding interface and relative displacement between the rubbing parts occurs only in regions where the contact is temporarily lost. Such matter displacements involve detachments of debris in the form of rolls (figure 14b).
Topographical measurements (figure 15a) show that roughness of TPU increases with increasing loads (Ra
grows from 0.67 µm to 0.99 µm respectively for loads from 166 N to 401 N), while the maximum spatial frequency decreases from 42 mm-1 to 28 mm-1 i.e. the distance between two waves increases from 24 µm to 36 µm (figure 15b).
Figure 15: (a) 3D topography of a worn surface of TPU and (b) associated spatial frequency spectrum at 401 N
(profilometer 3D Wyko NT1100). 5.3 Effect of temperature
The friction coefficients are slightly higher than at room temperature (µ = 0,61) and present some larger fluctuations, but remain quite stable around 0.7 to 0.8 up to 75°C (figure 16).
Figure 16: Effect of temperature on friction coefficients for (500 m at 0.32 m/s under 330 N).
Acoustically, the sliding contact becomes significantly less energetic at higher temperature (figure 17).
Wear volumes are now increasing from 130 mm3 at 23°C to 175 ± 15 mm3 at 50°C, and suddenly decrease to 55 ± 4 mm3 at 60°C and even 40 ± 8 mm3 at 75°C (figure 18). This last data can be compared with the wear volume recorded at room temperature, but under only 166 N. Associated Archard’s wear rates correspond respectively to 7.9·10-4 mm3·N-1·m-1 (21°C) and 10.6·10-4 mm3·N-1·m-1 (50°C) before the temperature transition and 3.3·10-4 mm3·N-1·m-1 (60°C) and 2.4·10-4 mm3·N-1·m-1 (75°C) which is the lower value of wear rate recorded in this study. This behaviour suggests a wear threshold temperature closed to 55°C in the studied conditions of sliding. Energy dissipation by friction is suspected to involve a significant temperature rise at the contact interface, which affects the rheological properties of TPU.
Figure 17: Effect of temperature on acoustic emission activity (500 m at 0.32 m/s under 330 N).
Figure 18: Effect of temperature on wear volumes (500 m at 0.32 m/s under 330 N).
Figure 19: SEM observation of TPU at 75°C (500 m at 0.32 m/s under 330 N).
A series of pictures was taken with a speed rate camera along the test duration. These sequences undoubtedly show that the temperature increase implies a reduction of
adhesion and agglomeration of wear debris at the contact extremities.
SEM observations display the same worn pattern as previously whatever the temperature. However, some wave tearing off affect the TPU surface involved by the contact separation at the end of the test.
Like for load results, topographical measurements show an increase of TPU roughness with increasing temperature (Ra grows from 0.90 µm to 1.15 µm
respectively for temperatures from 37.5°C to 75°C), while the maximum spatial frequency slowly decreases from 26 mm-1 to 22 mm-1 i.e. the distance between two Shallamach waves increases from 38 µm to 45 µm. 6 CONCLUSION
Friction and wear behaviour of a commercial thermoplastic polyurethane (TPU) sliding on a steel plate have been studied using a long stoke tribometer.
Characterization of TPU was first attempt to precisely identify its chemical composition (FTIR) and its mechanical behaviour as a function of temperature (DSC, DMTA).
Two series of experiments were conducted to analyse the influence of contact pressure and temperature changes under unlubricated conditions.
Friction coefficient slowly increases with load increase while it fluctuates when temperature rises. Acoustic emission remains constant with load but significantly decreases with temperature. Wear rates continuously increase with load but suddenly decrease from a temperature threshold.
Wear damage on TPU are identify to slight abrasion and speed accommodation of the interface is clearly determined by Schallamach wave propagation whatever load and temperature conditions.
Acknowledgements
This study was franco-spanish cooperation performed by the Interreg IVA RICAT+ and supported by FEDER funds. 7 REFERENCES
[1] Suh N.P., Mosleh M., Arinez J. (1998) Tribology of polyethylene homocomposites, Wear, 214, 231-236. [2] Song J., Liu P., Cremens M., Bonutti P. (1999)
Effects of machining on tribological behavior of ultra high molecular weight polyethylene (UHMWPE) under dry reciprocating sliding, Wear, 225-229, 716-723.
[3] Franklin S.E. (2001) Wear experiments with selected engineering polymers and polymer composites under dry reciprocating sliding conditions, Wear 251, 1591-1598.
[4] Martínez F.J., Canales M., Bielsa J.M., Jiménez M.A. (2010) Tribological behaviour of thermoplastic polyurethane elastomers, Wear, 268, 388-398. [5] Samyn P., Quintelier J., Schoukens G. (2008) On
the repeatability of friction and wear tests for polyamides in a Hertzian line contact, Experimental
Mechanics, 48 (26), 233-246.
[6] Rand C.J., Crosby A.J. (2006) Insight into the periodicity of Schallamach waves in soft material friction Appl. Phys. Lett. 89, issue 2, 261907. [7] Briggs G.A.D, Briscoe B.J. (1978) How rubber grips
and slips Schallamach waves and the friction of elastomers Phil. Mag. A, 38, issue 4, 387-399.