AN AUTOMATIC SYSTEM FOR MEASURING ROAD AND TUNNEL
LIGHTING PERFORMANCE
Greffier, F.1, Charbonnier, P.2, Tarel, J.-P.3, Boucher, V.1, Fournela, F.1
1 Cerema/Département Laboratoire et CECP d’Angers, Les Ponts-de-Cé, FRANCE,
2 Cerema/DTer Est/Laboratoire Régional de Strasbourg, Strasbourg, FRANCE, 3 Université Paris Est & IFSTTAR/Cosys/lepsis, Marne-la-Vallée, FRANCE
florian.greffier@cerema.fr
Abstract
Various problems in different domains are related to the operation of the Human Visual System (HVS). This is notably the case when considering the driver's visual perception, and road safety in general. That is why several standards of road equipments are directly derived from human visual abilities and especially in road and tunnel lighting installations design. This paper introduces an automatic system for measuring road and tunnel lighting performance. The proposed device is based on an embedded camera recording of photometric and colorimetric images. The normative measurement grid for performance calculation is projected onto the images by using road marking detection and robust fitting. After a detailed presentation of the methodology, some examples of measurement operations are presented.
Keywords: road lighting, tunnel lighting, lighting measurement, photometry, luminance, ILMD
(Imaging Luminance Measurement Device), dynamic measurements, road marking detection, robust fitting of road markings
1 Introduction
As is well known, a large part of the information used by a driver is supplied by his visual system. That is why several standards of road equipments are directly derived from human visual abilities. We can mention standards referring to road markings or road signs, and especially to road and tunnel lighting installations.
Traditionally, luminance measurements for lighting performance evaluation are performed with a spot-luminance meter in static configuration. This measurement method remains a reference method but is very time consuming. Thus, results from some measurement points are often extrapolated to an entire road or tunnel. In this paper, we introduce an alternative approach, based on an embedded sensor called CYCLOPE, for surveying road and tunnel lighting performance in an automatic and dynamic fashion.
The rest of the paper is structured as follows. After a short recall (section 2) about the standards referring to road and tunnel lighting, section 3 introduces the CYCLOPE device and the process that transforms an ordinary camera into a photometric and colorimetric dynamic measurement system. Then, the steps for projecting the normative measurement grid points onto the images recorded by CYCLOPE are given in sections 4 and 5. Finally, some examples of measurement operations are also presented and discussed.
2 International standards referring to road and tunnel lighting performance
Performance requirements of road lighting are well defined in CIE (International Commission on Illumination) (CIE, 2010) or CEN (European Committee for Standardization) (CE N, 2004) documents. These documents specify a set of photometric requirements aiming at the visual needs of road users. For drivers of motorized vehicles for use on traffic routes, the main lighting criteria are based on the road surface luminance of the c arriageway.
Performance requirements of tunnel lighting are also well defined in CIE (CIE, 2004), (CEN, 2003a) or in French standardization (CETU, 2000) documents. Inside tunnels, photometric
requirements aiming at the visual needs of road users are simila r to photometric requirements in road lighting. The specificity of tunnel lighting concerns tunnel entrances because of the human visual system: outside the tunnel, the driver cannot simultaneously perceive details on the road under lighting levels existing in a highly illuminated exterior and a relatively dark interior. The tunnel entrance can appear as a black hole in the centre of the field of view. The adaptation process takes a certain time, depending on the amplitude of the reduction: the greater the difference between the lighting level outside and inside the tunnel, the longer the adaptation time. Hence, the lighting is normalized in the entrance and calculated to allow time for the driver’s visual system to adapt. The main criteria, such as road lighting, are based on the road surface luminance of the carriageway. There are also requirements on the luminance level of the lower part of the tunnel walls.
The metrology to verify that the actual installation fits the requirements essentially relies on static measurements with a spot-luminance meter. These are mainly established for the reception of new installations, but cannot be applied for the diagnostic of a whole network. Dynamic measurements (CIE, 2002) have thus been developed and CIE has published a document on these devices (CIE, 2011). They are adapted to the diagnostic on carriageways over a large territory or the whole length of a tunnel.
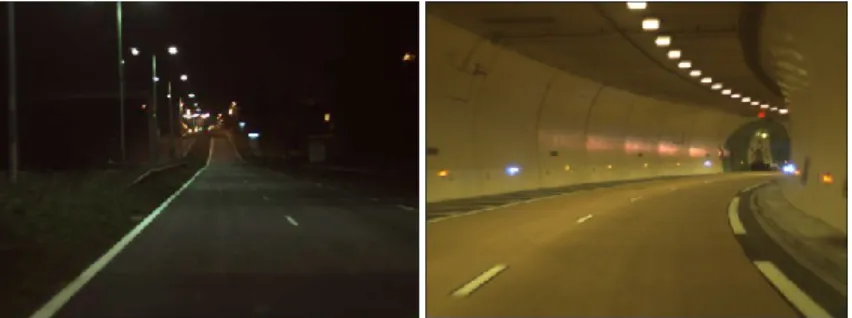
The two images given in Figure 1 have been recorded under road lighting and in tunnel with the CYCLOPE system which is presented hereafter. These images will be the reference images in all following figures to illustrate the proposed methodology.
Figure 1 – Examples of road and tunnel lighting
3 Presentation of CYCLOPE system
The Cerema and Ifsttar, two public institutes of the scientific network of the French Department of Transportation, are working to promote innovative camera-based solutions for assessing and improving highway visibility (Aubert, 2014). In this context, the Département Laboratoire et CECP d'Angers (DLRCA) of Cerema has developed an innovative system for human visual signal capture called CYCLOPE (Boucher, 2008).
3.1 Photometric and colorimetric calibration
CYCLOPE is a camera-based system which is calibrated both photometrically and colorimetrically and fitted onboard a road operation vehicle. For the photometric component, this device is also called ILMD (Imaging Luminance Measuring Device). The first stage in the development of the system is to adapt the spectral response of the optical system t o the spectral characteristics of the human eye. As the system would have to measure the physical magnitudes constitute the visual signal, it is necessary that the optical process of image capture demonstrates spectral sensitivity curves as near as possibl e to the human eye curves (CIE, 1932).
The camera used is a CCD camera of 640 x 480 pixels with a 12 -bits dynamic. The CCD array permits colour image acquisition by means of Bayer micro-filters. Data transmitted by the camera are split into three channels: red, green and blue. Spectral adaptation takes place in two steps. First we use an infrared filter on the camera lens. Indeed the eye is not sensitive to these wavelengths whereas the CCD array is. The second step consists in fitting the spectral sensitivity of the system to the colour matching function in the CIE 1931 colour space. This is done by post-processing the images to mathematically recombine the three camera channels.
Each raw image recorded contains, in a single shot, all photometric and colori metric data of the imaged scene and there is no effect on the initial frame rate of the camera.
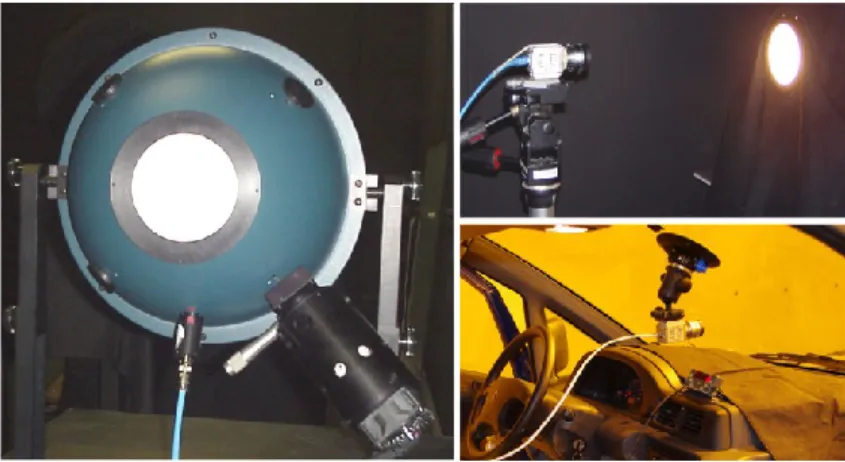
The adapted gray levels (that are combination of the RGB gray levels) are then representative of the photometric magnitudes of the captured scenes. However, the se gray levels are not yet luminance values. A relation has to be determined which allows those adapted gray levels images to be transformed into luminance distributions. This is the purpose of calibrating for luminance (CIE, 2002). An integrating sphere is used to generate homogeneous luminance levels varying for example from 0.1 cd/m² to 30,000 cd/m² onto a circular output port. The camera is placed in front of the sphere and images from the output port of the sphere are recorded. With the luminance value known, the gray levels in the image can be directly assigned to a luminance value. Thereafter, by varying the luminance of the sphere, step by step, and recording an image for each stage, the relation between luminances and gray levels can be determined. Moreover this function is only available for the current acquisition parameters and other parameters are likely to cause variations in the gray levels recorded by the CCD camera. These can be the focal length (F) of the camera lens, the aperture (N) of the lens diaphragm and the exposure time (T) used to capture the image. These parameters imply determining a new calibrating relation each time one of them changes.
Figure 2 – Integrating sphere of luminance (left), CYCLOPE system during calibration of camera (top right), CYCLOPE system in the vehicle (bottom right)
3.2 Dynamic measurements
The process of spectral adaptation and the different calibrations previously explained have a double advantage. On the one hand, they can all be applied successively to a single image captured by the camera. Each image recorded contains all the luminance and chrominance data of the scene. On the other hand, they are applied to the raw images recorded by the camera and, therefore, after capture. They have no effect whatsoever o n the initial frame rate of the camera. This double advantage is exploited by taking the system on board a vehicle equipped with an odometer and a GPS device and this enables capturing scenes in motion.
3.3 Metrological approach
CYCLOPE measurements are operated using embedded instrument in a moving vehicle. Dynamic measurement systems are mentioned in standards (CIE, 2011) but without quoting particulars requirements (unless making links with static measurements). This embedded measurement procedure is also not formally standardized. A standard (ISO/CEI, 2005) defines an appropriate frame which allows validating our measurement method. For that purpose, a first step consists in using an integrating sphere of luminance, according to the metrological traceability chain. The embedded instrument is then periodically subjected to calibration on the range of nominal indication interval usually used in road and tunnel lighting. Next, a measurement method analysis allows identifying the influence quantities so as to estimate a measurement uncertainty, concordantly to the GUM: 1995 (ISO/CEI, 2008). Nowadays, we estimate the measurement uncertainty to nearly 20 % in real experimental conditions. This value seems very high according to luminance levels (often lower than 2 cd/m² on the road). However, it integrates both the error due to the measuring instrument iself (± 5 %) (ISO/CEI, 2014) and also the impact of the environmental conditions (climatic
conditions, road surface, extraneous light, etc.) (Fiorentin, 2005). In a few months, a fine estimation of the uncertainty will be produced by inter -laboratory comparisons.
Figure 3 – Luminance image of road lighting (left) and tunnel lighting (right)
4 Road detection for luminance measurements
One of the CYCLOPE abilities is to provide luminance maps of road scenes from each recorded image (Boucher, 2008). The system is therefore used to measure road and tunnel lighting performance in accordance with CIE recommendations (CIE, 2000 & 2004) and CEN standard requirements for road lighting (CEN, 2003a, 2003b & 2003c). Since each pixel of each image recorded provides a luminance measurement, the proposed methodology mainly consists in projecting the real world measurement field specified by the reference documents onto the image plane. It is thus needed to localize the road surface in the image by detecting lane markings.
4.1 Road marking detection
In the first image processing step, potential road marking elements are extracted using both photometric and geometric features, as proposed in (Veit, 2008); (Sebsadji, 2010). More specifically, the image is scanned line-wise from the horizon line to the bottom. On each line, the gray level of every pixel is first compared to the median value of its neighbours. The median is a robust estimator of the “central” value of a sample that can tolerate up to 50% outliers. Hence, since the neighbourhood is mostly composed of background pixels, the median value corresponds to the neighbouring road intensity level. For wider lane markings, a lower percentile may be considered, see (Sebsadji, 2010). If the difference between the pixel value and the local road level is more than a given threshold, then the pixel is labelled as “marking”. Once pixel classification has been performed, potential marking segments are filtered according to their width. The selection threshold is adapted to the line position to account for perspective. Finally the centres of line segments are computed. Figure 4 shows results of road marking detection on the reference images.
Figure 4 – Original images (left), filtered images (centre), extraction results: marking elements are in blue (right)
4.2 Robust fitting of road markings by curves
Once road markings elements have been detected, we fit them using polynomial s. To make regression robust to outliers, we use M-estimation, see (Huber, 1981). This amounts to replacing the usual sum of squared residuals by a function of the form:
ii
J
r
, (1)where is the vector of model parameters, is a non-quadratic penalty function defined in (Tarel, 2002) and ri is the residual, i.e. the difference between the i-th observation and its
prediction by the model. In the half-quadratic setup, see e.g. (Charbonnier, 1997) or (Tarel, 2002), it is shown that minimizing J is equivalent to minimizing a weighted least-square criterion:
2
* ,
i i ii
J
b
b r
b
, (2)where is a convex penalty and bi is an auxiliary variable, whose role is both to mark outliers
and to linearize the problem. Indeed, J* is quadratic in r (hence, w.r.t. ) when b is fixed, and convex w.r.t.b when r is fixed. Moreover, in the latter case, the minimum is given by a closed -form expression. Such properties suggest a deterministic algorithmic s trategy, that consists in alternately fixing each variable and minimizing J* w.r.t. the other, which leads to the well-known Iterated Reweighted Least-squares (IRLS) algorithm. Since it is deterministic, this algorithm needs to be carefully initialized. In practice, we use a simple tracking procedure in the image sequence, i.e. we initialize the estimation using the model stemming from the previous image. This algorithm is very robust: it can tolerate up to 50 % outliers for the penalty functions we use. Figure 5 shows results of curve fitting on the reference images.
Figure 5 – Road markings fitting by curves for road lighting (left) and tunnel lighting (right)
5 Road and tunnel lighting measurements with CYCLOPE
5.1 Normalized measurement fields in road and tunnel lighting
In road lighting, the nominal position of the grid points at which measurements are taken is defined in (CEN, 2003b); (CIE, 2000). In the longitudinal direction, the measurement field shall enclose two luminaires in the same row. In the trans versal direction, the measurement field is positioned between two lane markings and can include several driving lanes as shown in Figure 6 at the left. The spacing of the points in the longitudinal and transverse directions shall be determined as follows:
D = S/N in the longitudinal direction where D is the spacing between points in the longitudinal direction in meters and S is the spacing between luminaires in the same row in metres. N is the number of points in the longitudinal direction with N = 10 for S <= 30 m and N is the smallest integer giving D<= 3 m if S > 30 m.
d = W/3 in the transverse direction where d is the spacing between points in the transverse direction in metres and W is the width of the lane in metres.
In tunnel lighting, the nominal position of the grid points at which measurements are taken is defined in (CEN, 2003a). In the longitudinal direction, the position of the grid points is based on the principle of equidistant spacing between luminaires. The proposed number of longitudinal grid points (seven as a prime number) is based on practical reasons of avoiding a multiple of the luminaire spacing, which would give less resolution of the distribution (Figure 6). In the transversal direction, the position of grid points is the same as the position of grid points specified for road lighting.
As shown in Figure 6 at the right, we have: B, the width of the lane
D, the spacing between luminaires
L, the length of measuring field (typically between 15 and 25 m)
N, the number of luminaire distances included in the measurement field
Figure 6 – Measurement grid points in road lighting case (left) and tunnel lighting case (right) For static luminance measurement, the position of the luminance meter (symbolized with a smiley in Figure 6) is 1.5 m above the road level and at 60 m ahead the field of the relevant area (CEN, 2003a & 2003b). In the transverse direction, the luminance meter shall be positioned in the centre of each lane in turn. Measurement can also be carried out at a closer distance and at a proportional lower height so that the angle of view shall be the same (CEN, 2003c). In the CYCLOPE case (Figure 7), the camera is fixed on the front windshield of the vehicle and is 1.3 m above the road level. Measurement is done at 52 m ahead the f ield of the relevant area to preserve the same viewing angle.
Figure 7 - Scheme of CYCLOPE angle of view (example of road lighting measurements)
5.2 Automatic grid points positioning in CYCLOPE images
For grid points positioning in images, we compute a model which associates a distance to each line of the image. We apply the pinhole model for the camera and presuppose a locally flat road. The horizon line position (white line in Figures 8 & 9) is known by calibration or can be automatically detected in image (Tarel, 2007).
In the longitudinal direction, the pinhole model allows determining the row s in the image which correspond to the limits of the measurement field (blue lines in Figures 8 & 9). In the transverse direction, the road markings equations, computed as explained in section 4, delimit each lane (red curves in Figures 8 & 9). Thus, we extract a Region Of Interest (ROI) from the image which matches the field of luminance measurement for the relevant area. The last step is to calculate in the ROI the best pixels corresponding to the grid points described in 5.1. The angular subtense of the measured road surface at each grid point shall not be greater than 2 min of arc in the vertical plane and not greater than 20 min of arc in the horizontal plane (CEN, 2003a). The pixels of CYCLOPE camera present separately an angular aperture of 2 x 2 min of arc. The final luminance value at each grid point (green points in Figures 8 & 9) is calculated by taking the mean of 10 pixels in transverse direction and 1 p ixel in longitudinal direction.
Figure 8 – Road lighting case: measurement grid points positioning (left), luminances at the grid points (right)
From these luminance values, the following photometric parameters can be then calculated (CEN, 2003a & 2003b); (CETU, 2000); (CIE, 2000):
The average luminance shall be calculated as the arithmetic mean of the luminances at the grid points in the field of measurement
The overall uniformity shall calculated as the ratio of the lowest luminance, occuring at any grid point in the field of measurement, to the average luminance
The longitudinal uniformity shall be calculated as the ratio of the lowest to the hightest luminance on points in the longitudinal direction along centre line of lane.
These parameters represent road or tunnel lighting performances.
Figure 9 – Tunnel lighting case: measurement grid points positioning (left), luminances at the grid points (right)
5.3 Examples of road and tunnel lighting measurement operation over a large
territory
Figure 10 gives an example of a typical road lighting measurement report along a street with CYCLOPE. All information about the measurement operation can be f ound in the header lines. Then, we present evolutions of average luminance, overall uniformity and longitudinal uniformity along the street. Luminance measurement points are also presented in cartographic mode and all CYCLOPE measurements can be imported into a GIS (Geographical Information System).
Figure 10 – Typical CYCLOPE report (in French) when measuring road lighting performance Figure 11 gives an example of a typical tunnel lighting measurement report in a tunnel. We present evolutions of average luminance, overall uniformity and longitudinal uniformity along the tunnel. Average luminance measurement points are examined against normalized luminance evolution in tunnel entrance (pink bars in Figure 1 1).
6 Conclusions and future works
In this paper, we introduced an automatic system for measuring road and tunnel lighting performance. This system combines a photometric and colorimetric measurement device with algorithms of road markings detection and fitting. The normative measurement grid for performance calculation is thus directly projected onto the images.
CYCLOPE is presently the reference system of the French Department of Transportation for dynamic luminance measurement (CERTU, 2013). As CYCLOPE images are geo-referenced, the results can be directly integrated into a GIS, offering road operators the opportunity to evaluate globally the level of service of their infrastructure, and to optimize lighting costs and maintenance of its equipment.
In future works, the CYCLOPE camera will be replaced by an HDR (High Dynamic Range) camera developed by Cerema. This will make measurements on the road as well as directly in the lighting sources with the same level of precision. This will enable calculating new parameters, such as TI (Threshold Increment) for example, directly from dynam ic statement.
References
AUBERT, D., BOUCHER, V., BREMOND, R., CHARBONNIER, P., CORD, A., DUMONT, E., FOUCHER, P., FOURNELA, F., GREFFIER, F., GRUYER, D., HAUTIERE, N., MUZET, V., NICOLLE, P. and TAREL, J.-P. 2014. Digital imaging for assessing and improving highway visibility. In Proc. of Transport Research Arena (TRA' 14), Paris.
BOUCHER, V., GREFFIER, F. and FOURNELA F. 2008. High speed acquisition system of photo-colorimetric images to record and model the human visual signal. In Proc. SPIE 7073,
Applications of Digital Image Processing XXXI.
CEN 2003a. CEN CR 14380:2003. Lighting applications - Tunnel Lighting.
CEN 2003b. EN 13201-3:2003. Road lighting - Part 3: Calculation of performance.
CEN 2003c. EN 13201-4:2003. Road lighting - Part 4: Methods of measuring lighting
performance.
CEN 2004. CEN TR 13201-1:2004. Selection of lighting classes. CERTU 2013. Schémas directeurs d’éclairage d’un réseau routier. CETU 2000. Tunnel Pilot File - Equipments / section 4.2: Lighting.
CHARBONNIER, P., BLANC-FÉRAUD, L., AUBERT, G. and BARLAUD, M. 1987. Deterministic edge preserving regularization in computed imaging. In IEEE Transactions on
Image Processing, 6(2), p. 298-311.
CIE 1932. Commission Internationale de l'Eclairage Proceedings, 1931. Cambridge: Cambridge University Press.
CIE 2000. CIE 140-2000. Road Lighting Calculations. Vienna: CIE.
CIE 2002. CIE x023:2002. Proceedings of two CIE Workshops on Photometric Measurement
Systems for Road Lighting Installations (Liège/Belgium 1994; Poitiers/France, 1996).
CIE 2004. CIE 88:2004. Guide for the lighting of road tunnels and underpasses. Vienna: CIE. CIE 2010. CIE 115:2010. Lighting of roads for motor and pedestrian traffic. Vienna: CIE. CIE 2011. CIE 194:2011. On Site Measurement of the Photometric Properties of Road and
FIORENTIN, P., IACOMUSSI, P. and ROSSI G. 2005. Characterization and calibration of a CCD detector for light engineering. IEEE Transactions on Instrumentation and Measurement , 54(1), p. 171-177.
HUBER, P.J. 1981. Robust statistics. John Wiley and Sons, New York.
ISO/CEI 2005. ISO/CEI 17025:2005. General requirements for the competence of testing and
calibration laboratories.
ISO/CEI 2008. ISO/CEI 98-3:2008. Guide to the expression of uncertainly in measurement. ISO/CEI 2014. ISO/CEI 19476:2014. Characterization of the performance of illuminance
meters and luminance meters.
SEBSADJI, Y., TAREL, J.P., CHARBONNIER, P. and Foucher, P. 2010. Robust Road Marking Extraction in Urban Environments Using Stereo Images. In Proc. IEEE Intelligent Vehicles
Symposium (IV'10), p. 394-400.
TAREL, J.P., IENG, S.S. and CHARBONNIER, P. 2002. Using robust estimation algorithms for tracking explicit curves. Lecture Notes in Computer Science, 2350, p. 492-407.
TAREL, J.P., IENG, S.S. and CHARBONNIER, P. 2007. Robust Lane Marking Detection by the Half Quadratic Approach. In Collection Etudes et Recherches des Laboratoires des Ponts
et Chaussées, CR 49, LCPC.
VEIT, T., TAREL, J.P., NICOLLE, P. and CHARBONNIER, P. 2008. Evaluation of road marking feature extraction. In Proc. International IEEE Conference on Intelligent