arXiv:0909.3397v1 [astro-ph.EP] 18 Sep 2009
September 18, 2009
Transiting exoplanets from the CoRoT space mission
VII. The “hot-Jupiter”-type planet CoRoT-5b
Rauer, H.
1,2, Queloz, D.
3, Csizmadia, Sz.
1, Deleuil, M.
4, Alonso, R.
4, Aigrain, S.
5, Almenara, J.M.
6,
Auvergne, M.
7, Baglin, A.
7, Barge, P.
4, Bord´
e, P.
16, Bouchy, F.
8, Bruntt, H.
9, Cabrera, J.
1, Carone, L.
10,
Carpano, S.
11, De la Reza, R.
19, Deeg, H.J.
6, Dvorak, R.
12, Erikson, A.
1, Fridlund, M.
11, Gandolfi, D.
14,
Gillon, M.
3,18, Guillot, T.
13, Guenther, E.
14, Hatzes, A.
14, H´
ebrard, G.
8, Kabath, P.
1, Jorda, L.
4, Lammer,
H.
15, L´
eger, A.
16, Llebaria, A.
4, Magain, P.
18, Mazeh, T
20, Moutou, C.
4, Ollivier, M.
16, P¨
atzold, M.
10, Pont,
F
5, Rabus, M.
6, Renner, S.
1, Rouan, D.
7, Shporer, A.
20, Samuel, B.
16, Schneider, J.
17, Triaud, A.H.M.J.
3,
and Wuchterl, G.
14(Affiliations can be found after the references) 00 / 00
ABSTRACT
Aims. The CoRoT space mission continues to photometrically monitor about 12000 stars in its field-of-view for a series of target fields to search for transiting extrasolar planets ever since 2007. Deep transit signals can be detected quickly in the “alarm-mode” in parallel to the ongoing target field monitoring. CoRoT’s first planets have been detected in this mode.
Methods.The CoRoT raw lightcurves are filtered for orbital residuals, outliers, and low-frequency stellar signals. The phase folded lightcurve is used to fit the transit signal and derive the main planetary parameters. Radial velocity follow-up observations were initiated to secure the detection and to derive the planet mass.
Results.We report the detection of CoRoT-5b, detected during observations of the LRa01 field, the first long-duration field in the galactic anti-center direction. CoRoT-5b is a “hot Jupiter-type” planet with a radius of 1.388+0.046
−0.047 RJ up, a mass of 0.467+0.047−0.024
MJ up, and therefore, a mean density of 0.217+0.031−0.025 g cm−3. The planet orbits an F9V star of 14.0 mag in 4.0378962±0.0000019
days at an orbital distance of 0.04947+0.00026−0.00029 AU.
Key words.planetary systems - techniques: photometry - techniques: radial velocity
1
1. Introduction
CoRoT started to search for the photometric signal of tran-siting extrasolar planets in 2007, after its successful launch in December 2006, for details on the satellite see the pre-launch book (Baglin et al. 2007; Boisnard et al. 2006) and Auvergne et al. (2009). The satellite monitors about 12000 stars per exoplanet field-of-view in a series of short (∼30 days) and long (∼150 days) observing runs. Its magnitude range is 12 ≤ mv≤16 mag. The resulting stellar lightcurves
are searched for periodic signals of transiting extrasolar planets. Radial-velocity follow-up measurements secure the nature of the transiting body and allow us to derive its mass.
The nominal lightcurve analysis for small transiting signals has to await the completion of an observing run and detailed signal analysis. The mission “alarm-mode”
1 Observations made with SOPHIE spectrograph at the
Observatoire de Haute Provence (07B.PNP.MOUT), France, and HARPS spectrograph at ESO La Silla Observatory (072.C-0488(E), 082.C-0312(A)), and partly based on observations made at the Anglo-Australian Telescope. The CoRoT space mis-sion, launched on December 27, 2006, was developed and is op-erated by CNES, with the contribution of Austria, Belgium, Brasil, ESA, Germany, and Spain.
(Quentin et al. 2006; Surace et al. 2008), however, can be used to quickly trigger follow-up measurements during on-going observations of a target field. The “alarm-mode” is used to increase the transmitted time-sampling for individ-ual stellar lightcurves in the CoRoT exoplanet channel. The sampling is increased from 512 sec to 32 sec if a transit-like signal is detected during the observations. It therefore pro-vides planetary candidates early during an observing run, which are, however, biased towards relatively large plane-tary candidates because of the limited data set available at this point.
CoRoT-5b is the fifth secured transiting planet detected by CoRoT. As CoRoT-1b to CoRoT-4b (Alonso et al. 2008; Barge et al. 2008; Deleuil et al. 2008; Moutou et al. 2008; Aigrain et al. 2008), it was first detected by the alarm-mode. Here, we present the photometric detection of CoRoT-5b by the satellite based on pre-processed alarm-mode data, the accompanying radial-velocity observations confirming its planetary nature, and the resulting planet parameters.
2. Observations and data reduction
CoRoT-5b was detected in the LRa01-field, the second long-run field of CoRoT. The field is located near the anti-center direction of the galaxy at RA(2000): 06h46m53sand
observ-Fig. 1.Lightcurve of CoRoT-5 re-sampled to 512 sec time resolution. No corrections for data jumps due to “hot pix-els” have been applied in this figure to show the raw data quality.
ing sequence started on October 24, 2007 and finished after 112 days duration. CoRoT observations usually have a very high duty cycle since data gaps are mainly caused by the regular crossings of the South Atlantic Anomaly (SAA), which typically last for about 10 min. During the observa-tions of the LRa01 field, however, two longer interrupobserva-tions occurred. An intermediate interruption of about 12 hours occurred eight days after the beginning of the observing run, and a longer data gap of about 3.5 days started on January 18, 2008, after a DPU reset. Finally, a duty cycle of 93 % was achieved.
The alarm-mode was triggered after 29 days of obser-vations. When seven transit-like signals were detected, the time sampling was switched to 32 sec. The alarm-mode data for CoRoT-5 are based on the analysis of “white light” lightcurves, without using the color information of the CoRoT prism. In total 219,711 data points were obtained, 214,938 of it in oversampling mode. The data pipeline flags data points taken during the SAA crossing or affected by other events decreasing the data quality. When taking only unflagged data into account, the number of data points re-duced to 204,092 in total and 199,917 as highly sampled.
The alarm-mode data were processed with a first ver-sion of the data reduction pipeline (Auvergne et al. 2009). The pipeline corrects for the CCD zero offsets and gain, the sky background intensity and the telescope jitter. In addi-tion, “hot pixels” (Pinheiro da Silva et al. 2008) affect the lightcurves, causing sudden jumps in intensity of varying duration. The lightcurve of CoRoT-5 was, however, only moderately affected by such jumps, as can be seen in Fig. 1, which shows the full lightcurve. The oversampled part of the data set was re-binned to display the whole lightcurve with a 512 sec time sampling. The measured intensity de-creases during the observing run, as observed for all stars in the fields. Overall, CoRoT-5 only shows a minor level of variability, without clear periodicity.
CoRoT measures stellar intensities by aperture pho-tometry using optimized masks (Llebaria et al. 2003) that encompass the shape of the stellar point-spread-functions (PSFs). The bi-prism introduced in the light path of the exoplanet channel (Auvergne et al. 2009) causes relatively wide PSFs of unusual shapes that vary with e.g. stellar
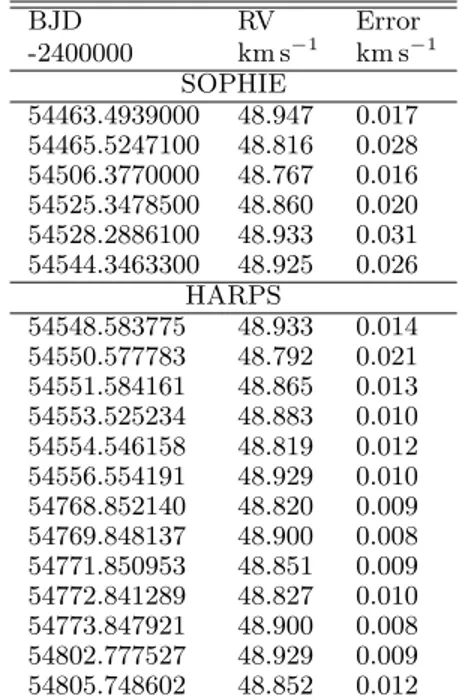
Table 1.Radial velocity measurements of the star CoRoT-5 obtained by SOPHIE and HARPS spectrographs from December 2007 to December 2008. BJD RV Error -2400000 km s−1 km s−1 SOPHIE 54463.4939000 48.947 0.017 54465.5247100 48.816 0.028 54506.3770000 48.767 0.016 54525.3478500 48.860 0.020 54528.2886100 48.933 0.031 54544.3463300 48.925 0.026 HARPS 54548.583775 48.933 0.014 54550.577783 48.792 0.021 54551.584161 48.865 0.013 54553.525234 48.883 0.010 54554.546158 48.819 0.012 54556.554191 48.929 0.010 54768.852140 48.820 0.009 54769.848137 48.900 0.008 54771.850953 48.851 0.009 54772.841289 48.827 0.010 54773.847921 48.900 0.008 54802.777527 48.929 0.009 54805.748602 48.852 0.012
magnitude. Contaminating eclipsing binary stars within the PSF could mimic a planetary transit-like signal. Based on the pre-launch observations of the target field included in the Exo-Dat data base (Deleuil et al. 2009), the contami-nation of the mask of CoRoT-Exo5 is estimated to 8.4 %. Refinement of this value will be performed in a more de-tailed future analysis using the dedicated windowing mask for this target star. We subtracted this flux level from the lightcurve before normalization to take low level contami-nation into account.
The overall intensity trend and smaller scale variability of the lightcurve were removed. To do this, we resampled the lightcurve to 512 seconds sampling rate first and con-volved this lightcurve with a fourth order Savitzky-Golay filter (similar to the treatment for CoRoT-2b (Alonso et al. 2008)). Then median averages were calculated for 24 hour segments of the lightcurve (excluding the transit points and the data jumps), which was fitted by a spline-curve. The original lightcurve was then divided by the spline fit. The filtered lightcurve was used for normalization and further analysis. The out-of-eclipse scatter of CoRoT-5 was deter-mined from the standard deviation of data points in the phase-folded lightcurve. It was found to be 0.0017 mag.
3. Photometric follow-up observation
Photometric follow-up observations with higher spatial res-olution than CoRoT’s (of ≈ 20′′x 6′′) are used to exclude
the presence of nearby contaminating eclipsing binaries (Deeg et al., this volume). Such observations of CoRoT-5 were performed at the 80cm telescope at IAC, Tenerife, on the January 12, and March 11, 2008 at a spatial resolu-tion of about 1.5′′. These data showed only one star bright
enough to cause a potential false alarm, about 8′′
south-west of the target. Observations obtained during and out of a transit (“on/off photometry”) showed, however, that
−100 −50 0 50 100 −0.4 −0.2 0.0 0.2 0.4 −40 −20 0 20 40 Phase Radial Velocities (m.s −1 ) Residuals (m.s −1 ) . . . .
Fig. 2. Radial velocity measurements and Keplerian fit to the data including the Rossiter effect. Red: SOPHIE, green: HARPS.
Fig. 3.Bisector analysis of CoRoT-5.
this contaminating star varies by less than 0.08 mag. This is far below the variation of about 0.55 mag that is required to explain the observed signal in the CoRoT data.
4. Radial velocity follow-up observations
In January 2008, after the identification of a transit sig-nal by the alarm-mode, CoRoT-5 was observed with the SOPHIE spectrograph installed on the 193 cm telescope at the Haute Provence Observatory. Two radial velocity measurements were taken at opposite quadrature phases of the radial velocity variation expected from the transit ephemerides assuming a circular orbit. At this time the data were found to be compatible with a radial velocity am-plitude suggesting a Jupiter mass planet. Additional mea-surements were obtained later in the season to confirm the reality of the signal but not enough to obtain a precise
mea-Fig. 4.Stellar abundances of CoRoT-5. Abundances found from neutral lines are marked by circles, for ionized lines box symbols are used.
surement of the orbit eccentricity. One year later, a new se-ries of measurements was obtained with the HARPS spec-trograph installed on the 3.6m ESO telescope at La Silla in Chile (Mayor et al. 2003). Both sets of data (SOPHIE and HARPS) have been processed as in Bouchy et al. (2008). Radial velocities (RV) were computed by weighted cross-correlation (Baranne et al. 1996; Pepe et al. 2005) with a numerical G2-spectral template excluding spectral orders below 4200 ˚A. Radial velocity values are listed in Table 1 and plotted in Fig. 2.
We analyzed the cross-correlation function computed from the HARPS spectra using the line-bisector technique according to the description in Queloz et al. (2001) to de-tect possible spectral distortions caused by a faint back-ground eclipsing binary mimicking a small RV amplitude signal. No correlation between the RV data and the bisec-tor span was found at the level of the uncertainty on the data (Fig. 3).
The stability of the bisector, combined both with the amplitude of the radial velocity and the accuracy of tran-sit lightcurve, is enough to discard an alternate back-ground eclipsing binary scenario. In the case of a hypothet-ical background eclipsing binary, obtaining a sine-shaped radial-velocity signal would require a superimposed spec-trum moving with the same systemic velocity as the bright-est component, and on an RV range corresponding to the sum of the width of both CCF line profiles. This prerequi-site constrains both on the mass of the potential eclipsing component and its companion. The example of HD41004 provides us with an interesting benchmark (Santos et al. 2002). This system was detected with a similar radial ve-locity amplitude but with a strong bisector correlation, and could be explained by a superimposed spectrum with 3% flux of the bright star. If one scales down this re-sult to CoRoT-5, which has no bisector correlation, one finds that the contrast ratio between the brightest star and the hypothetical eclipsing binary is such that the eclipse must be very deep and the radius of the eclipsing stars much smaller than CoRoT-5. Considering the quality of the CoRoT lightcurve such a binary scenario does not match the transit ingress and egress timing and the detailed shape of the curve.
5. Properties of the central star
We determined the fundamental parameters of the host star carrying out a spectral analysis of the set of HARPS spectra acquired for radial velocity measurements. The individual
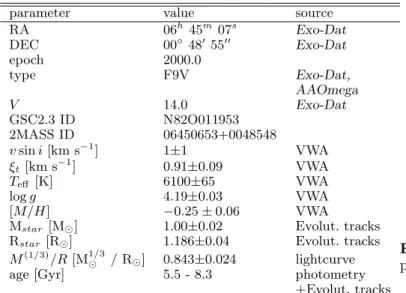
Table 2.Parameters of the parent star CoRoT-5.
parameter value source
RA 06h45m07s Exo-Dat DEC 00◦48′ 55′′ Exo-Dat epoch 2000.0 type F9V Exo-Dat, AAOmega V 14.0 Exo-Dat GSC2.3 ID N82O011953 2MASS ID 06450653+0048548 v sin i [km s−1] 1±1 VWA ξt [km s−1] 0.91±0.09 VWA Teff [K] 6100±65 VWA log g 4.19±0.03 VWA [M/H] −0.25 ± 0.06 VWA
Mstar[M⊙] 1.00±0.02 Evolut. tracks
Rstar [R⊙] 1.186±0.04 Evolut. tracks
M(1/3)/R [M1/3
⊙ / R⊙] 0.843±0.024 lightcurve
age [Gyr] 5.5 - 8.3 photometry
+Evolut. tracks
spectra were reduced with the HARPS standard pipeline. The extracted spectra were corrected for cosmics impacts, for the Earth and the stars velocity, and then corrected for the blaze function and normalized, order by order, to increase the signal-to-noise (S/N). The S/N level in the continuum is around 40 in the range 5 000-6 500 ˚A and it decreases to 15 towards the blue at 4 000 ˚A.
Spectroscopic observations of the central star have also been performed in January 2008 with the AAOmega multi-object facility at the Anglo-Australian Observatory. By comparing the low-resolution (R=1300) AAOmega spec-trum of the target with a grid of stellar templates, as de-scribed in Frasca et al. (2003) and Gandolfi et al. (2008), we derived the spectral type and luminosity class of the star (F9 V).
As for the previous planet host stars, we used differ-ent methods to derive Corot-5 atmospheric parameters: line profile fitting with the SME (Valenti & Piskunov 1996) and the VWA packages (Bruntt et al. 2002, 2008). We find general agreement and here we quote the results from VWA. The star has a very low projected rotational ve-locity, v sin i = 1 ± 1 km s−1. More than 600 mostly
non-blended lines were selected for analysis in the wavelength range 3 990–6 810 ˚A. VWA uses atmosphere models from the grid by Heiter et al. (2002) and atomic parameters from the VALD database (Kupka et al. 1999). The abundance determined for each line is computed relative to the result for the same line in the solar spectrum from Hinkle et al. (2000), following the approach of Bruntt et al. (2008). The results for CoRoT-5 are shown in Table 2. Using these pa-rameters for the atmospheric model, we determined the abundances of 21 individual elements. The uncertainty on the abundances includes a contribution of 0.04 dex due to the uncertainty on the fundamental parameters. The abun-dance pattern is shown in Fig. 4. The overall metallicity is found as the mean abundance of the elements with at least 20 lines (Si, Ca, Ti, Cr, Fe, Ni) giving [M/H] = −0.25±0.04. We did not include Mn, as this has a significantly lower abundance. The metallicity and the 1-σ error bar is
indi-Fig. 5.The O-C diagram of the CoRoT-5b system. No clear period variation can be seen.
cated by the horizontal bar in Fig. 4. There is no evidence of the host star being chemically peculiar, except Mn.
The fundamental parameters of the parent star, its mass and radius were subsequently derived using stellar evolu-tionary tracks as presented in Deleuil et al. (2008) plotted in a M(1/3)/R - T
eff HR diagram. The stellar density
pa-rameter was derived from the lightcurve fitting (see sect. 7). We determined the mass and radius of the star to: Mstar = 1.00±0.02 M⊙ and Rstar = 1.186±0.04 R⊙. As
a final check, we calculated the corresponding surface grav-ity log g = 4.311±0.033 while the spectroscopic value is 4.19 ± 0.03. These two values of log g are comparable with each other at the 3σ level. Based on our photometric anal-ysis, we estimate the age of the star to 5.5 - 8.3 Gyrs. The spectra show no sign of Ca II emission or of a strong Li I absorption line, which is consistent with a relatively evolved star.
6. Period determination and transit timing
variations
In total, 27 individual transit events are clearly seen, sep-arated by an orbital period of about 4.03 days. One event was lost in a data gap.
First, we estimated the mid-times of each transit by applying the so-called Kwee-van Woerden method (Kwee & van Woerden 1956). This method mirrors the lightcurve around a pre-selected time-point, T, computes the differences of original and mirrored lightcurves and then searches for an optimum T. The O − C diagram of the sys-tem was constructed, based on the resulting transit times and an initial guess of the period. A linear fit of this di-agram yielded an improved estimate of the period. This period value was then refined with the following procedure. The lightcurve was phase-folded using this previously de-termined period and then averaged. The size of the bin used was 0.001 in phase (or to 5.81 minutes, using the fi-nal period). Then, this lightcurve was fitted (see the next section) by a theoretical transit lightcurve. The transit mid-times were then determined again by cross-correlating the observed and the theoretical lightcurve. This resulted in more precise mid-times of the transit and a new O − C curve. Another linear fit to this O − C diagram yielded a
Table 3.Parameters of the CoRoT-5 system derived from the combined MCMC analysis.
Fitted Parameters Value Units (Rp/Rstar)2 0.01461+0.00030−0.00032 tT 0.0290+0.00038−0.00053 b 0.755+0.017 −0.022 K 59.1+6.2−3.1 m s−1 e cos ω −0.057+0.048 −0.020 e sin ω −0.071+0.147 −0.130
tT denotes the transit duration given in fraction of phase, b
the impact parameter and K the RV semi-amplitude.
better period value, and the whole procedure was repeated. The final O-C diagram can be seen in Fig. 5. The resulting ephemeris is given in Table 4.
There is no obvious period variation present in the O−C diagram. The first part of the lightcurve was obtained with the 512 sec sampling rate, so the first seven minima typi-cally consist of only 20 data points. Thus, they have larger scatter and uncertainties. The next twenty minima were obtained with the high sampling rate (32 sec) and typi-cally consist of a few hundred data points, leading to much higher accuracy. If one takes only these high-resolution min-ima into account, the constancy of the period is clearer. However, we cannot exclude that small period variations are present in the system. The upper limit of such a pe-riod variation was estimated by a quadratic fit to the data, which showed that it should be less than 0.42 seconds/cycle.
7. Analysis of parameters of CoRoT-5b
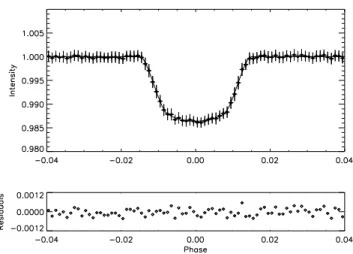
The final phase-folded lightcurve of the transit event is seen in Fig. 6. The transit signal shows a depth of about 1.4 % and lasts for about 2.7 hours. We derived the plane-tary parameters by fitting simultaneously the lightcurve of CoRoT-5 with the SOPHIE and HARPS radial velocities. A planetary model on a Keplerian orbit in the formalism of Gim´enez (2006a) and Gim´enez (2006b) was fitted to the data using a Markov Chain Monte-Carlo (MCMC) code described in Triaud et al. (in prep.) but using e. cos ω and e. sin ω instead of e and w as free parameters for better er-ror estimation. In the fit a quadratic limb-darkening law was assumed at u+ = 0.616 and u− = 0. In the initial
burn-inphase of the MCMC adjustment, 15,000 steps were chosen to allow the fit to converge. A further 50,000 steps were used to derive the best parameters and their errors. In the fit, there are eight fitted parameters plus two γ ve-locities and a normalization factor, totalling 11 free pa-rameters. In addition, the fit assumed the presence of a Rossiter-McLaughlin effect with the two fixed parameters vsin i = 1.0 km s−1 and λ = 0 (λ: angle between stellar
rotation axis and normal vector of the orbital plane). A Bayesian penalty is added to the χ2 creating a prior for
M⋆= 0.99 ± 0.02. The fit to the rv measurements is shown
in Fig. 2, and the derived fitting parameters are shown in Table 3.
In addition, a model transit curve (Mandel & Agol 2002) was fitted to the photometric phase folded transit curve separately. The parameters fitted are the center of
Fig. 6.Top: Phase-folded lightcurve of CoRoT-5b. Bottom: Residuals of fitted transit curve.
transit, the planet radius expressed in stellar radii, the semi-major axis in stellar radii and the orbital inclina-tion. In this fit the limb-darkening coefficients (u1 and u2)
were free parameters, assuming a quadratic limb-darkening law. The fitting method follows a Metropolis-Hastings algo-rithm, which is a kind of Markov Chain Monte-Carlo proce-dure. The fitting procedure was performed ten times with different starting values to find the global minimum in χ2.
The errors of the fit were estimated from the standard devi-ations of the points in the chain. In addition to the transit curve, a third light component is included as a free param-eter in the fit. In this way, we could check whether another contaminant is present, which remained unresolved in the photometric follow-up. However, no such additional source of light was found. The transformation between contami-nation factor c and the third light l3 is c = l3/(1 − l3). We
had c = 0.005 ± 0.024. Since we already removed the known contaminant factor from the lightcurve (see Section 2), we could therefore conclude that no further observable contam-inant is present in the lightcurve of CoRoT-5. The planet parameters derived from this fit agree with the simultane-ous fitting within the error bars, so we do not report them again here.
The resulting planetary parameters based on the MCMC approach with fixed limb-darkening coefficients and without any third light are summarized in Table 4. The major uncertainties on the planet are, as usual, introduced mainly from the uncertainty of the stellar parameters.
8. Summary
We report the discovery of a “hot-Jupiter-type” planet, CoRoT-5b, orbiting a type F9V star of 14.0 mag. The planet mass and radius were derived to 0.467+0.047−0.024 MJup
and 1.388+0.046−0.047RJup, respectively. It orbits its central star
at 0.04947+0.00026−0.00029AU orbital distance. The determined ec-centricity is low (see Table 4), but further radial velocity measurements would be needed for a more accurate deter-mination.
CoRoT-5b has a density of 0.217+0.031−0.025 g cm−3,
simi-lar to the planets WASP-12b and WASP-15b (Hebb et al. 2009; West et al. 2009), implying that it belongs to the planets with the lowest mean density found so far. As
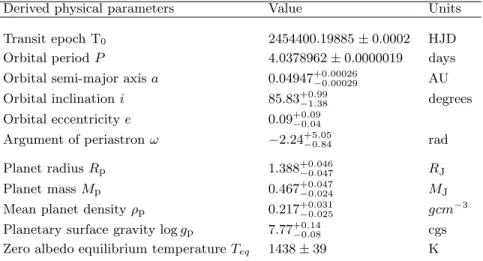
Table 4.The derived planet parameters.
Derived physical parameters Value Units
Transit epoch T0 2454400.19885 ± 0.0002 HJD
Orbital period P 4.0378962 ± 0.0000019 days
Orbital semi-major axis a 0.04947+0.00026
−0.00029 AU
Orbital inclination i 85.83+0.99−1.38 degrees
Orbital eccentricity e 0.09+0.09
−0.04
Argument of periastron ω −2.24+5.05−0.84 rad
Planet radius Rp 1.388+0.046−0.047 RJ
Planet mass Mp 0.467+0.047−0.024 MJ
Mean planet density ρp 0.217+0.031−0.025 gcm−3
Planetary surface gravity log gp 7.77+0.14−0.08 cgs Zero albedo equilibrium temperature Teq 1438 ± 39 K
such, it is found to be larger by 20% than standard evolu-tion models (Guillot et al. 2006) would predict. Standard recipes that account for missing physics (kinetic energy transport or increased opacities) can explain this large size, and predict that the planet is mostly made of hydrogen-helium, with at most 28 M⊕ of heavy elements (maximum
value obtained in the kinetic energy model, assuming 0.5% of the incoming energy is dissipated at the planet center). Thus, CoRoT-5b supports the proposed link between the metallicity of planets and of their host star.
Acknowledgements
HJD and JMA acknowledge support from grant ESP2007-65480-C02-02 of the Spanish Education and Science Ministry. Some of the data published in this article were acquired with the IAC80 telescope oper-ated by the Instituto de Astrof´ısica de Tenerife at the Observatorio del Teide. The German CoRoT Team (TLS and Univ. Cologne) acknowledges DLR grants 50OW0204, 50OW0603, 50QP07011. RA acknowledges support by grant CNES-COROT-070879. The building of the input CoRoT/Exoplanet catalog was made possible by observa-tions collected for years at the Isaac Newton Telescope (INT), operated on the island of La Palma by the Isaac Newton group in the Spanish Observatorio del Roque de Los Muchachos of the Instituto de Astrofisica de Canarias.
References
Aigrain, S., Collier Cameron, A., Ollivier, M., et al. 2008, A&A, 488, L43
Alonso, R., Auvergne, M., Baglin, A., et al. 2008, A&A, 482, L21 Auvergne, M., Bodin, P., Boisnard, L., et al. 2009, ArXiv e-prints Baglin, A., Auvergne, M., Barge, P., et al. 2007, in American Institute
of Physics Conference Series, Vol. 895, American Institute of Physics Conference Series, ed. C. Dumitrache, N. A. Popescu, M. D. Suran, & V. Mioc, 201–209
Baranne, A., Queloz, D., Mayor, M., et al. 1996, A&AS, 119, 373 Barge, P., Baglin, A., Auvergne, M., et al. 2008, A&A, 482, L17 Boisnard, L., Baglin, A., Auvergne, M., Deleuil, M., & Catala, C. 2006,
in ESA Special Publication, Vol. 1306, ESA Special Publication, 465–471
Bouchy, F., Queloz, D., Deleuil, M., et al. 2008, A&A, 482, L25 Bruntt, H., Catala, C., Garrido, R., et al. 2002, A&A, 389, 345 Bruntt, H., De Cat, P., & Aerts, C. 2008, A&A, 478, 487
Deleuil, M., Deeg, H. J., Alonso, R., et al. 2008, A&A, 491, 889 Deleuil, M., Meunier, J. C., Moutou, C., et al. 2009, AJ, 138, 649 Frasca, A., Alcal´a, J. M., Covino, E., et al. 2003, A&A, 405, 149 Gandolfi, D., Alcal´a, J. M., Leccia, S., et al. 2008, ApJ, 687, 1303 Gim´enez, A. 2006a, A&A, 450, 1231
Gim´enez, A. 2006b, ApJ, 650, 408
Guillot, T., Santos, N. C., Pont, F., et al. 2006, A&A, 453, L21 Hebb, L., Collier-Cameron, A., Loeillet, B., et al. 2009, ApJ, 693, 1920 Heiter, U., Kupka, F., van’t Veer-Menneret, C., et al. 2002, A&A, 392,
619
Hinkle, K., Wallace, L., Valenti, J., & Harmer, D. 2000, Visible and Near Infrared Atlas of the Arcturus Spectrum 3727-9300 A (Visible and Near Infrared Atlas of the Arcturus Spectrum 3727-9300 A ed. Kenneth Hinkle, Lloyd Wallace, Jeff Valenti, and Dianne Harmer. (San Francisco: ASP) ISBN: 1-58381-037-4, 2000.) Kupka, F., Piskunov, N., Ryabchikova, T. A., Stempels, H. C., &
Weiss, W. W. 1999, A&AS, 138, 119
Kwee, K. K. & van Woerden, H. 1956, Bull. Astron. Inst. Netherlands, 12, 327
Llebaria, A., Guterman, P., & Ollivier, M. 2003, in Techniques and Instrumentation for Detection of Exoplanets. Edited by Coulter, Daniel R. Proceedings of the SPIE, Volume 5170, pp. 155-166 (2003)., 155–166
Mandel, K. & Agol, E. 2002, ApJ, 580, L171
Mayor, M., Pepe, F., Queloz, D., et al. 2003, The Messenger, 114, 20 Michel, E., Deleuil, M., & Baglin, A. 2006, in ESA Special Publication, Vol. 1306, ESA Special Publication, ed. M. Fridlund, A. Baglin, J. Lochard, & L. Conroy, 473–+
Moutou, C., Bruntt, H., Guillot, T., et al. 2008, A&A, 488, L47 Pepe, F., Mayor, M., Queloz, D., et al. 2005, The Messenger, 120, 22 Pinheiro da Silva, L., Rolland, G., Lapeyrere, V., & Auvergne, M.
2008, MNRAS, 384, 1337
Queloz, D., Henry, G. W., Sivan, J. P., et al. 2001, A&A, 379, 279 Quentin, C., Barge, P., Cautain, R., et al. 2006, in ESA Special
Publication, Vol. 1306, ESA Special Publication, 409–+ Santos, N. C., Mayor, M., Naef, D., et al. 2002, A&A, 392, 215 Surace, C., Alonso, R., Barge, P., et al. 2008, in Society of
Photo-Optical Instrumentation Engineers (SPIE) Conference Series, Vol. 7019, Society of Photo-Optical Instrumentation Engineers (SPIE) Conference Series
Valenti, J. A. & Piskunov, N. 1996, A&AS, 118, 595
West, R. G., Anderson, D. R., Gillon, M., et al. 2009, AJ, 137, 4834
1 Institute of Planetary Research, DLR, Rutherfordstr. 2,
12489 Berlin, Germany
2 Center for Astronomy and Astrophysics, TU Berlin,
Hardenbergstr. 36, 10623 Berlin, Germany
3 Observatoire de Gen`eve, Universite de Gen`eve, 51 Ch. des
Maillettes, 1290 Sauverny, Switzerland
4 Laboratoire d’Astrophysique de Marseille, CNRS UMR
5 School of Physics, University of Exeter, Stocker Road,
Exeter EX4 4QL, United Kingdom
6 Instituto de Astrofsica de Canarias, E-38205 La Laguna,
Tenerife, Spain
7 LESIA, CNRS UMR 8109, Observatoire de Paris, 5 place
J. Janssen, 92195 Meudon, France
8 Institut d’Astrophysique de Paris, UMR7095 CNRS,
Universite Pierre & Marie Curie, 98bis Bd Arago, 75014 Paris, France
9 Sydney Institute for Astronomy, School of Physics,
University of Sydney, NSW 2006, Australia
10 Rheinisches Institut f¨ur Umweltforschung an der
Universit¨at zu K¨oln, Abt. Planetenforschung, Aachener Str. 209, 50931 K¨oln, Germany
11 Research and Scientific Support Department, European
Space Agency, ESTEC, 2200 Noordwijk, The Netherlands
12 Institute for Astronomy, University of Vienna,
T¨urkenschanzstrasse 17, 1180 Vienna, Austria
13 Observatoire de la Cˆote d’Azur, Laboratoire Cassiop´ee,
CNRS UMR 6202, BP 4229, 06304 Nice Cedex 4, France
14 Th¨uringer Landessternwarte Tautenburg, Sternwarte 5,
07778 Tautenburg, Germany
15 Space Research Institute, Austrian Academy of Sciences,
Schmiedlstrasse 6, 8042 Graz, Austria
16 Institut d’Astrophysique Spatiale, Universit´e Paris XI,
91405 Orsay, France
17 LUTH, Observatoire de Paris-Meudon, 5 place J. Janssen,
92195 Meudon, France
18 Institut dAstrophysique et de G´eophysique, Universit´e de
Li`ege, All´ee du 6 aout 17, Sart Tilman, Li`ege 1, Belgium
19 Observatorio Nacional, Rio de Janeiro, RJ, Brazil 20 School of Physics and Astronomy, Raymond and Beverly
Sackler Faculty of Exact Sciences, Tel Aviv University, Tel Aviv 69978, Israel