Accepted Manuscript
The time after feeding alters methane emission kinetics in Holstein dry cows fed with various restricted diets
Yannick Blaise ,
Andriamasinoro Lalaina Herinaina Andriamandroso , Yves Beckers , Bernard Heinesch , Eloy Castro Mu ˜noz , H ´el `ene Soyeurt , Eric Froidmont , Fr ´ed ´eric Lebeau , J ´er ˆome Bindelle
PII: S1871-1413(18)30202-6 DOI: 10.1016/j.livsci.2018.07.004
Reference: LIVSCI 3495
To appear in: Livestock Science
Received date: 20 September 2017 Revised date: 4 July 2018
Accepted date: 5 July 2018
Please cite this article as: Yannick Blaise , Andriamasinoro Lalaina Herinaina Andriamandroso , Yves Beckers , Bernard Heinesch , Eloy Castro Mu ˜noz , H ´el `ene Soyeurt , Eric Froidmont , Fr ´ed ´eric Lebeau , J ´er ˆome Bindelle , The time after feeding alters methane emission kinet-ics in Holstein dry cows fed with various restricted diets, Livestock Science (2018), doi:
10.1016/j.livsci.2018.07.004
This is a PDF file of an unedited manuscript that has been accepted for publication. As a service to our customers we are providing this early version of the manuscript. The manuscript will undergo copyediting, typesetting, and review of the resulting proof before it is published in its final form. Please note that during the production process errors may be discovered which could affect the content, and all legal disclaimers that apply to the journal pertain.
ACCEPTED MANUSCRIPT
1
Highlights
Cattle CH4 production dynamics are continuously characterized by the exhaled CO2 : CH4 ratio.
CH4:CO2 ratio in breath is used to investigate the kinetics of CH4 production.
Diets composition influences daily CH4 emission and eructation frequency.
Post-feeding time induces differences as high as 100% in the CH4 emission rates.
ACCEPTED MANUSCRIPT
2
The time after feeding alters methane emission kinetics in Holstein dry cows fed with various restricted diets
Yannick Blaise ab,*, Andriamasinoro Lalaina Herinaina Andriamandroso abc, Yves
Beckers ab, Bernard Heinesch d, Eloy Castro Muñoz af, Hélène Soyeurt e, Eric Froidmont
g
, Frédéric Lebeau ad, Jérôme Bindelle abc,*
a
TERRA Teaching and Research Center, Gembloux Agro-Bio Tech, University of Liege, Passage des Déportés 2, 5030 Gembloux, Belgium
b
Precision Livestock and Nutrition, Gembloux Agro-Bio Tech, University of Liege, Passage des Déportés 2, 5030 Gembloux, Belgium
c
AgricultureIsLife, Gembloux Agro-Bio Tech, University of Liege, Passage des Déportés 2, 5030 Gembloux, Belgium
d
Biosystems Dynamics and Exchanges Gembloux Agro-Bio Tech, University of Liege, Passage des Déportés 2, 5030 Gembloux, Belgium
e
Applied Modelling Unit, Gembloux Agro-Bio Tech, University of Liege, Passage des Déportés 2, 5030 Gembloux, Belgium
f
Facultad de Ciencias Agrícolas, Universidad Central del Ecuador, Av. Universitaria, Quito, 170129, Ecuador
g
Production and Sectors Department, Walloon Agricultural Research Centre, Rue de Liroux 8, 5030 Gembloux, Belgium
ACCEPTED MANUSCRIPT
3
ABSTRACT
This study aims to investigate shifts in methane (CH4) emission in cattle in relation to the time after feeding, diet composition, and feed allowance. Four non-cannulated dry Holstein cows were equipped with activity and infrared sensors to monitor feeding behavior and CH4 and carbon dioxide (CO2) levels in the breath, continuously and at a frequency of 4 Hz. The second goal pursued, was to assess the methane emission estimation (CH4,L/h) by the CO2 -method based on the ratio between CH4 and CO2 in the exhaled air, using metabolic CO2 as a marker. All cows were fed twice a day at 12 h intervals with contrasting isoenergy diets in a cross-over design: LIN100 diet (5562 VEM, i.e. Voedereenheid Melk, Dutch energy unit for milk production, 1 VEM = 6.9 kJ net energy for lactation) composed of haylage, linseed and wheat, and HAY100 (5367 VEM) diet containing only haylage. After a 2 week adaptation period to the diets, 3 days were required for the measurements and immediately after, two additional experimental treatments were applied by reducing the feed allowance to 70% with the same diets to evaluate the impact of the dry matter intake, yielding the two additional treatments HAY70 and LIN70. In addition, two other rumen-cannulated cows were used to monitor time after feeding short-chain fatty acid concentrations in the rumen. On a daily basis, all indicators (daily CH4:CO2 ratio, eructation frequency and CH4 emission) followed the same trend and showed that cows on a hay-based diet produced more CH4 and feed restriction induced different production levels for the same type of diet. The averageCH4 emission for the different diets were 6.86 L/h for HAY100 > 6.25 L/h for HAY70 > 4.26 L/h for LIN100 > 3.97 L/h LIN70 (P < 0.001). The LIN100 diet produced 38% lower daily CH4 emissions than HAY100 and reduced the eructation frequency by 44%. During feeding, the eructation frequency was higher (P<0.001) for HAY than LIN diets.
This work underlines the daily CH4 emission dynamics observed using the CH4:CO2 ratio in the cow’s exhaled air. Methane emissions (L/h) are strongly influenced by the time after
ACCEPTED MANUSCRIPT
4
feeding time (P < 0.001). They increased for up to 2 hours after the distribution of the meal, and then decreased until the next meal, with shifts between the maximum and the minimum emission of more than 100% for LIN100 and 22% for HAY100. Consistently, the acetate:proprionate ratio was smaller for the LIN100 diet between 2 to 5 hours after the meal (P < 0.001).
Keywords: methane, carbon dioxide method, time after feeding, long term measurement, methane kinetic
1. Introduction
In ruminants, CH4 is generated in the rumen and in the hindgut when microbes ferment feed components, mainly carbohydrates. Most of the CH4 is eructed, although 2% is eliminated via flatus and 11% is absorbed into the blood and exhaled via the lungs (Ricci et al., 2014). Besides dry matter intake (DMI) and diet composition, many factors are likely to influence CH4 emission, in particular the time after feeding and the behavioral phase such as eating, grazing, or ruminating (Hammond et al., 2016; Knapp et al., 2014). To achieve further reduction in CH4 production, it is important to capture the complexity and kinetics of feed fermentation and digestion and the related metabolism in ruminants. Few studies specifically investigate CH4 kinetics over the course of a day (Cottle et al., 2015; Lockyer and Champion, 2001; Velazco et al., 2015). The reference method to quantify CH4 emissions requires animals to be kept in respiration chambers. This technique offers a low variability between daily measurements conducted on the same animal but it is both time-consuming and expensive, and raises several welfare issues related to the housing conditions (Grainger et al., 2007; Hammond et al., 2016). To measure enteric CH4 emissions from ruminants in their production environment, a tracer gas (SF6) technique was designed (Johnson and Johnson, 1995). This is the predominant technique available to individually measure the daily CH4 emissions of
ACCEPTED MANUSCRIPT
5
grazing ruminants over a whole day or more (e.g. Savian et al., 2014). In stables, Lassey et al. (2011), adapted this method to study CH4 emission dynamics through a succession of 20 min sampled breath accumulations at the individual level. They showed for instance that feeding is immediately followed by a CH4 peak. The major disadvantages of the SF6 technique are its high cost, the long time required to analyze the collected gas, the complexity of the method to measure short term changes in CH4 emissions, the physical constraints due to the equipment carried by the animal that can reduce free movement in the yards or the stables and finally the fact that SF6 itself has a global warming potential of 23,900 CO2 equivalents (Machmüller and Hegarty, 2006). Recently sniffer-based CO2 methods tackled some of these issues by performing a few short measurements in the barn or on pasture of the exhaled air of the cows, usually when the animals are fed supplements or milked. The air exhaled by individual animals is analyzed by infra-red sensors dedicated to measuring CH4 and CO2 concentrations in order to estimate the CH4 production (Cottle et al., 2015; Madsen et al., 2010). This process ensures reasonable accuracy and precision in CH4 estimation, compared to the respiration chamber (Haque et al., 2017). On groups of animals, CH4 kinetics can be extrapolated from many short measurements but correlate poorly with post-feeding patterns (Cottle et al., 2015). Another drawback arises from the need for animals to come to the feeder to perform a measurement. Moreover, compared to respiration chamber measurements, emissions display some bias ascribed to animal behaviors and time after feeding CH4 emission kinetics that skew the CH4 estimation curves (Cottle et al., 2015; Garnsworthy et al., 2012; Velazco et al., 2015).
Therefore, the main objective of this study was to measure the within daily variation in CH4 production of individual cows according to the sampling time elapsed after feeding in order to assess the extent of possible biases related to few short time measurements and to show a potential link between CH4 and behavioral phases. For this purpose, a portable gas analyzer
ACCEPTED MANUSCRIPT
6
similar to those used in sniffer-based methods was developed in order to allow a continuous and high frequency analysis of the CH4 to CO2 ratios in breath to be made, and to investigate the kinetics of methane production at the individual level. Moreover, the link with the fermentation patterns in the rumen as measured through volatile fatty acid (VFA) profiles was investigated due to the relationship between VFA production and CH4 emissions (Sauvant et al., 2011).
2. Materials and methods
Two complementary experiments were conducted in the experimental center for animal production of Gembloux Agro-Bio Tech – University of Liège (Gembloux, Belgium) (50°33'54.6"N 4°42'04.6"E). Animal works were approved by the Animal Care Committee of the University of Liège [N° 12-1288 and 14-1627]. In the first experiment, the time after feeding CH4 and CO2 emission kinetics of dry cows fed two types of diet (haylage vs. linseed-supplemented haylage diet) and two forage allowance levels were compared: a forage allowance level providing 100% of the maintenance energy requirements and a forage allowance level providing only 70% of the maintenance energy requirements via a reduction in dry matter intake (DMI). Linseed was chosen because it decreases daily CH4 emissions in cows (Martin et al., 2016). In the second experiment, the impact of the diets on the production kinetics and molar ratios of VFA in the rumen were assessed in cannulated cows.
2.1. Experiment 1: gas emission kinetics
2.1.1. Animals and diets
Four dry red-pied Holstein cows of 736.2 ± 44.0 kg initial and 740 ± 40.7 kg final body weights (BW) were used and placed in a tie-stall barn. Two diets were formulated in order to supply similar levels of fermentable organic matter to rumen bacteria in order to stress differences in fermentation kinetics and pathways between diets. In addition, both diets supplied similar levels of net energy for lactation (VEM) within the Dutch feed evaluation
ACCEPTED MANUSCRIPT
7
system (Tamminga et al., 1994): Diet 1 was composed of haylage (HAY) and Diet 2 was composed of haylage supplemented with wheat and linseed (LIN) (Table 1). The net energy animal maintenance requirements per day were calculated as 42.4 VEM/kg BW0.75 (Van Es, 1975). Water was always freely available to the animals.
2.1.2. Experimental set up
Two sets of conditions were used to induce variation in rumen fermentation: the type of diet (haylage (HAY) vs. linseed (LIN) diet) and the daily feed allowance (DFA) levels (100% vs. 70%): HAY100, HAY70, LIN100 and LIN70 (Table 1). The 100% DFA was designed to cover all nutritional requirements of the animals while the 70% was designed to assess the link between fermentable DM intake and CH4 production levels.
At the beginning of the measurement period, two cows were ascribed to HAY100 and two others to LIN100. After 2 weeks of adaptation to the diets, a period of 3 days of measurements was carried out. Subsequently, the cows were rationed to 70% of DFA on the same diet. The periods during which the animal received a diet under the required maintenance level was limited to 4 days for animal welfare reasons. Hence, one day after the reduction in DFA, measurements were performed for 3 additional days. Cows, received a quantity of food which corresponded to 70% energy requirements but were only under a limited energy deficit considering the short period of restriction. Finally, diets were swapped between cows and the experimental scheme was repeated for a second period so that both diets were tested on all cows. DFA was split into two equal meals fed at 08:30 AM and PM. All the feed was eaten at once. The average the time spent eating a meal was 61.6 ± 16.9 min for HAY100, 41.0 ± 8.5 min for HAY70, 22.6 ± 4.7 min for LIN100 and 21.1 ± 3.5 min for LIN 70. No refusals were observed.
ACCEPTED MANUSCRIPT
8
2.1.3. Gas sensors
The developed gas measurement device uses two gas infra-red sensors, with the CH4 sensor placed upstream of the CO2 sensor (NG Gascard® 0-1 % CH4 and Gascard® NG 0-10% CO2, respectively; Edinburgh Sensors, Livingston, UK). Those sensors were calibrated by the Edinburgh Sensors each year. The exhaled gas is sucked (24V DC Pump Gascard NG Models) into the sensors directly from the nostrils via a 1.85 m polyethylene pipe (inner ø 4 mm) at a flow rate of 0.5 L/min. A 1 µm filter placed before the first sensor protects both sensors. All components were supplied by a 12V battery. In order to optimize continuous air sampling through the day, a nostril ring was specifically designed (Figure 1). It maintained the tube inlet at constant distance and orientation from the nostril. A microcontroller recorded data from both sensors at 4 Hz and continuously stored them on a SD-card over 24 hours.
2.1.4. Activity sensors
Simultaneous to gas production kinetic measurements, cows were equipped with an iPhone 4S (Apple Inc., Cupertino, CA, USA) attached to the neck (Figure 1), whose built-in inertial measurement unit (IMU) was used to record head and jaw movements. An open-source algorithm analyzed IMU signals to differentiate eating and ruminating behaviors and convert them into a behavior matrix (Andriamandroso et al., 2017).
2.2. Experiment 2: in vivo volatile fatty acid (VFA) kinetics
The objective of Experiment 2 was to acquire dynamics in rumen VFA production, to support observed differences in CH4 emissions between HAY100 and LIN100.
2.2.1. Animals and diet
In Experiment 2, two others cows were used. The two dry red-pied Holstein cannulated in the rumen were kept in pens (25 m²) and fed with HAY 100 and LIN100.
ACCEPTED MANUSCRIPT
9
2.2.2. Experimental set up
Cows were used in a 2 x 2 Latin square design. After a 2-week adaptation to the diets, they were fed at a 12-hour interval on HAY100 or LIN100 diets. Ruminal fluid was then collected for 3 consecutive days just before the meal (0 h) and 1, 2.5, 4.5, 7, 9.5 and 12 h after the morning feed. Diets were then swapped between cows and the procedure was repeated to yield a total of 6 samples per sampling time after feeding (N = 6; 2 cows × 3 days). A total of 100 mL of rumen fluid was collected using a pump with a probe covered by a fine metal mesh (Benchaar et al., 2015). The pH was immediately measured and an aliquot of 2 mL was centrifuged, diluted, acidified (pH < 3) using H2SO4, filtered (0.45 µm) and frozen at –20°C until further determination of VFA concentrations.
2.3. Measurements and chemical analyses
Every time a new haylage bale was opened, one sample was taken for analysis yielding a total of six samples (N = 6). For wheat and linseed three samples were taken, at the beginning, in the middle and at the end of the trial (N = 3). All feed samples were dried (60°C, 48 h) and ground in a Cyclotec mill (1 mm screen FOSS Electric, Hillerød, Denmark) before being analyzed for their chemical composition. Samples were analyzed for dry matter (DM) by drying at 105°C for 24 h (method 967.03; AOAC, 1995), organic matter (OM) by burning at 550 °C for 8 h (method 923.03; AOAC, 1995), crude protein (CP) using the Kjeldahl method (CP = N × 6.25; method 981.10; AOAC, 1995), ether-extract content (EE) with the Soxhlet method by using diethyl ether (method 920.29; AOAC, 1995), and gross energy using an adiabatic oxygen bomb 107 calorimeter (1241 Adiabatic Calorimeter, PARR Instrument Co., Illinois, USA). Neutral detergent fiber (NDF) and acid detergent fiber (ADF) were also measured according to Van Soest et al. (1991) and corrected for their ash content. In addition, diet samples were also analyzed for their nutritive values using a near infrared spectroscopy
ACCEPTED MANUSCRIPT
10
(NIRS) system 5000 monochromator spectrometer (XDS Rapid Content Analyzer XM-1100 Serie, FOSS Electric, Hillerød, Denmark) to predict fermentable (FOM) and digestible organic matter (DOM), the truly digested protein in the small intestine (DVE), degraded protein balance (OED), metabolic energy (ME) and net energy (VEM). The absorption spectrum of each sample was recorded as log 1/R for wavelengths ranging from 1100 to 2498 nm, every 2 nm (WINISI 1.5, FOSS Tecator Infrasoft International LCC, Hillerød, Denmark). Prediction equations used (Decruyenaere et al., 2009) to convert spectral data were provided by the Reference Laboratory Network REQUASUD (Gembloux, Belgium).
VFA concentrations were analyzed using a Waters 2690 high performance liquid chromatography (HPLC) system (Waters, Milford, MA, USA) fitted with an Aminex HPX-87H column (300 × 7.8 mm, Bio-Rad, Hercules, CA, USA) combined with a UV detector (210 nm; Waters, Milford, MA, USA) as described by Poelaert et al. (2017).
2.4. Data processing and analyses
Using the open-source algorithm developed by Andriamandroso et al. (2017), data from the IMU was used to classify the cows’ behavior by time windows of 300 seconds in MatLab R2014a (MathWorks, Natick, MA, USA). The algorithm detected eating and ruminating behaviors by steps of 1-second, and probability of appearance of each behavior was calculated over time windows of 300 seconds. MatLab R2014a was also used to visualize CO2 and CH4 concentrations and process the raw results. Eructations were detected visually on the CH4 signal. Carbon dioxide and CH4 concentrations were averaged over time windows of 300 seconds. Background concentrations were subtracted, calculated as the minimum observed values over the studied time windows. After subtraction of the background noise corresponding to the natural concentration of gases in the environment of the stables, all values below 400 ppm of CO2 were discarded to avoid samples with a very low concentration
ACCEPTED MANUSCRIPT
11
of breath (Haque et al., 2014). Such rejection of data was mainly ascribed to clogging of the pipe with food or water. Moreover, time windows for which no behavior data could be recorded because of a failure of the IMU were also discarded. Following this process, 74% of the whole observation data was kept.
Carbon dioxide was used as a natural marker and the ppm ratio (on a volume basis) between CH4 and CO2 was used to estimate CH4 emission (CH4 (L/h)) as detailed by Madsen and Bertelsen (2012) and Madsen et al. (2010). In this method, the CO2 production was calculated from the daily heat production by individual cows and assuming a value for the energy equivalent of CO2 (Equation 1) (Haque et al., 2014).
(1) where:
HP is the heat production, watt (W)
BW is the body weight of the animals, kilograms (kg) Y is the milk production of the cow, liter (L)
P is the number of days pregnant, day.
During both experiments, the cows were dry and not pregnant. Hence, Y and P were both equal to zero. The HP is then expressed in kJ per day; as one HP (1 watt) is equal to 1 J/sec or 86.4 kJ/day.
For a ruminant fed at the maintenance level heat production is equal to the ME intake, and for a dry feed-restricted animal, i.e. for a DFA of 70%, the heat production is equal to metabolizable energy (ME) intake + mobilized energy – energy in milk (Madsen et al., 2010). Firstly, ME intake was calculated using a CVB standard (Table 1). The proportion of CO2 produced by ME intake is then calculated. For animals at maintenance a value of 24 kJ/L CO2 is used, which corresponds to a respiratory quotient of 0.85 to 0.90. Table 2 displays the calculated daily CO2 production per diets.
ACCEPTED MANUSCRIPT
12
For animals fed below maintenance, the energy mobilized from body reserves was calculated as the difference between animal HP needed and ME intake (Table 1). The CO2 from mobilized energy was estimated according to Madsen et al. (2010) who quote 28 kJ of fat metabolized per 1 liter of CO2 produced. It was assumed that only the fat is mobilized because cows in negative energy balance mobilize body fat while the energy mobilized from muscle protein is limited (Komaragiri et al., 1998). Finally, the total CO2 emitted was the sum of CO2 due to ME intake and mobilized energy (Table 2).
The methane emission CH4 (L/h) was then calculated as:
⁄ ⁄ (2) where:
a is the [CH4] in air mix minus the minimum [CH4] in the time-windows studied, ppm b is the [CO2] in air mix minus the minimum [CO2] in the time-windows studied, ppm tot daily CO2 is the volume of CO2 emitted by the cow
24 is to express CH4 emission per hour
2.5. Statistical analyses
For Experiment 1, responses to diets or behaviors were compared using a PROC MIXED procedure in SAS (SAS Institute, Inc., Cary, NC, USA). The response variables were CH4 and CO2 concentrations in breath (ppm), CH4:CO2 ratio on a volume basis, CH4 (L/h), and eructation frequency. Diets combined with DFA (HAY100, HAY70, LIN100, LIN70) were used as fixed effects while cows (1, 2, 3, 4) and periods were used as random variables the model, as suggested for studies involving large variability between individuals (Festing and Altman, 2002). Measurements performed on each cow during one measurement period were used as the experimental unit.
The impact of time after feeding time (0 to 144 time windows of five minutes) for the four diets (HAY100, HAY70, LIN100, LIN70) on CH4 (L/h) was also studied. Cows (1, 2, 3, 4)
ACCEPTED MANUSCRIPT
13
and measurement periods were used as random variables. For this purpose, different models including time as continuous variable and diet, cow and period as class variables were tested as well as their first order interactions. Those models differed according to the power to which time was raised (1st, 2nd, 3rd, 4th and 5th power) and the model with the best fitting performances was selected. The resulting model that was used was as follows, with time to the 4th power: yijα = µ + m × timei + n × timei2 + o × timei3 + p × timei4 + dietj + q×timei × dietj + r × timei × cowα + s × timei × cowα × periodφ (3)
where:
yijα is the studied trait for time i, diet j and cow α;
timei is the covariate for the time after feeding time (i.e. 0 to 12 h); dietj is the diet fixed effect (4 levels);
cowα is the cow random effect (4 levels); periodφ is the period random effect (2 levels);
Methane kinetics for each cow and for each diet were modeled and parameters describing the kinetic response were calculated using the curvefit function in MatLab R2014a: the time when the maximum of CH4 (L/h) is reached (max time), the maximum emission obtained between two meals (maxCH4 (L/h)), the minimum emission obtained between two meals (minCH4 (L/h)) and the time needed between two meals to reach the half of the total emission (t1/2). The three kinetics response parameters were in turn compared for the diets and DFA levels using a PROC MIXED procedure in SAS where diets were fixed effects while cows and periods were used as random variables.
In experiment 2, the VFA concentrations and acetate:propionate molar ratios at the different sampling time-points after feeding were compared using the fixed linear models in the MIXED procedure in SAS with diets (HAY100, LIN100) as a fixed factor and cows as a random factor.
ACCEPTED MANUSCRIPT
14
3. Results
3.1. Gas emission kinetics
In Figure 2, distinctive CH4 and CO2 signals recorded using the developed instruments are displayed. Each maximum in the CO2 signal corresponds to exhalation and each minimum to inhalation. An eructation consists of a rapid rise in CH4 followed by an exponential decrease convoluted to the specific breathing pattern. In Figure 2, 3 eructation peaks are displayed. This pulse-release of CH4 by the cow during eructation is highly specific. In Figure 2, just before the first eructation, the cow holds her breath for a few seconds. This specific pattern often occurs during rumination.
3.2. Effect of diet and feed allowance on average daily methane emission
All CH4 production indicators (i.e. CH4 concentration, CH4:CO2 ratio, and eructation frequency) were consistently lower for both linseed-based diets (LIN100 and LIN70) than for haylage-based diets (HAY100 and HAY70) (Table 3) (P < 0.001). The average CO2 concentrations followed the same trend. CH4 (L/h) ranged from 6.86 L/h for HAY100 to 3.97 L/h for LIN70 and the intermediate values are 6.25 L/h for HAY70 and 4.26 L/h for LIN100 (P < 0.001). All these values ranked as follows: HAY100 > HAY70 > LIN100 > LIN70. Within a same diet, reducing DFA to 70% decreased CH4, CO2, CH4:CO2 ratio, and eructation frequency.
3.3. Daily patterns of gas emissions
Differences in the daily patterns were observed between treatments for eructation frequency, CH4 concentration, CH4:CO2 ratio and CH4 (L/h) (Figure 3). Just after the meal, a rapid rise in these values was observed, followed by a slow decrease until the next meal. CO2 concentrations for the different meals did not show such a distinctive and clear pattern.
ACCEPTED MANUSCRIPT
15
The modeling of the CH4 (L/h) curves by the polynomial Equation 3 (R2 = 0.39) showed that both time after feeding and diets (including forage allowance) as well as the respective interactions and the random factor “cow”, influenced the CH4 (L/h) (P < 0.001). The calculation of kinetics parameters from the modeled curves showed that the maximum production (max time) was reached approximately 2 hours after the distribution of the meal (Table 4). With lower t1/2 values, the concentrate-based treatments (LIN100) fermented earlier than the forage-based treatments (HAY100), respectively, 4.75 and 5.44 hours after the beginning of the meal. The CH4 emission peak (maxCH4) was at 5.77 L/h for LIN100 and the minimum baseline (minCH4) was at 2.61 L/h. Such values are less intense and lower compared to the HAY100 diet (maxCH4: 7.98 L/h and minCH4: 6.19 L/h). As expected, for a given diet, a reduction in feed allowance reduced maxCH4 (Table 4).
Specific unitary behaviors, especially rumination phases after a meal, were not distinctively associated with particular CH4 emission dynamics (Table 5). However, eructation frequency was higher during eating than during the other behaviors but this phenomenon was observed for the haylage-based diets only (P < 0.001).
3.4. In vivo volatile fatty acid (VFA) kinetics
For LIN100, VFA concentrations increased right after the meal then decreased after 4.5 h. VFA concentrations evolved differently (P < 0.001) for HAY100: one hour after the beginning of the meal, a decrease in VFA concentration was observed which was followed by an increase up to 4.5 h after feeding (Figure 4). Total VFA concentrations did not differ between treatments. Only acetate concentrations differed for some time-points, since HAY100 concentrations were consistently higher than LIN100. These differences induced significant changes (P < 0.001) in the acetate:propionate ratio which remained more constant and higher with HAY100 than with LIN100 at time 0, 2.5, 4.5, 7, and 9.5 hours.
ACCEPTED MANUSCRIPT
16
4. Discussion
The continuous monitoring of CH4 emission (L/h) provided information on CH4 production and kinetics for stable-fed cattle with a restricted feeding ration and according to a fixed timetable. It revealed a relationship between the different kinds of diets and forage allowances, on the one hand, and CH4 (L/h), eructation frequency, time after feeding and acetate:propionate ruminal ratio, on the other hand. It also showed that a within daily variation exists for the CH4:CO2 ratio, the eructation frequency and the CH4 emission (L/h).
The technique to evaluate CH4 was based on a method by Madsen et al. (2010) which uses metabolic CO2 as a natural marker, which raises some methodological issues since a good estimation of CH4 (L/h) depends on the accuracy of the daily metabolic CO2 production estimation and on the constant emission of this marker gas. The method is based on average CO2 emission per day and assumes constant efficiency of energy utilization, whereas studies in metabolic chambers show that these factors vary with the animal, level of feeding, and diet composition (Bell et al., 2014; Yan et al., 2010). So, the use of this marker possibly leads to biases which are unavoidable. Moreover, ruminal CO2 production is not taken into account. This source of CO2 emission is, on average, 11 times lower than the metabolic CO2 (Madsen et al., 2010; Martin et al., 2016). To limit changes in CO2 emissions, physical effort was limited with the cows housed in a stanchion-tied stable. On pasture, cows would be grazing and have more physical activity. Therefore, the application of this method on pasture should include better monitoring of the CO2-entry rate due to higher physical activity. The use of heart rate belts is one possible solution (Blaise et al., 2016) although dynamic body acceleration might be more appropriate to grasp short term variations in energy expenditure (Miwa et al., 2017). Finally, this study assumed that only fat is mobilized for cows in negative energy balance to estimate the CO2 produced, although a proper validation of this hypothesis would require the respiration quotient of the animals to be measured (Komaragiri et al., 1998).
ACCEPTED MANUSCRIPT
17
Concerning the sampling conditions, the average CO2 concentrations over time windows of 300 seconds were around 10,000 ppm, and peaks during exhalation reached 50,000 ppm. In breath, CO2 concentrations range between 30,000 and 50,000 ppm (Haque et al., 2014; Smith et al., 2009). This confirms that the majority of the air that was sampled comes from the breath and only slightly diluted by atmospheric air. Hence, variation due to the position of the nose in relation to the inlet of the sensor was strongly reduced as recommended by Haque et al. (2014). Moreover, according to Madsen et al. (2010) as long as 2 to 3% of breath is present in the air sample, it is sufficient to calculate relevant CH4 and CO2 concentration ratios.
The breathing frequency approximately reaches 0.5 Hz, so, the sensors have to record at least at 1 Hz according to the Shannon theorem (1949). Thanks to a high rate of sampling (4 Hz), the actual pattern of breathing and eructation could be properly captured (Figure 2).
Although the results obtained here must be taken with some caution because of the methodological issues detailed above, the daily continuous monitoring of CH4 and CO2 has shown an important within daily variation in the CH4:CO2 ratio and CH4 (L/h) (Figure 3). Even after the meal (approx. 60 min for HAY100, 40 min for HAY70, 23 min for LIN100 and 21 min for LIN70), CH4 (L/h) continued to increase. HAY diets reached their maximum after LIN diets (P < 0.001) (Table 4). This is probably explained by the longer intake time required for a more fibrous diet. For LIN100, the minimum and maximum of CH4 (L/h) recorded during the time after feeding phase were 2.61 and 5.77 L/day, respectively. This means that, depending on the measurement time, sniffer-based CH4 estimates could double for a same individual fed on the same diet. For HAY100 the difference between the maximum and the minimum value for CH4 reached 22.4%. Studies in chambers with the SF6 method and with infra-red short spot measurements have noted that daily patterns were influenced by feeding events but have never characterized the time after feeding pattern so accurately (Cottle et al., 2015; Grainger et al., 2007; Hegarty, 2013; Lassey et al., 2011; Nolan et al., 2010).
ACCEPTED MANUSCRIPT
18
Although CH4 kinetics were clearly linked to the time after feeding, they did not appear to be associated with the onset of rumination phases. During the meal, the eructation frequency was higher for the HAY100 and HAY70 diets, but this was not observed for LIN100 and LIN70. In the present work the time taken for the meal was very short due to the limited daily feed allowances. In the literature, there is no clear answer for the relationship between CH4 emissions and a specific behavior either. For Lockyer and Champion (2001), CH4 emissions for gazing ruminants followed a behavioral pattern with peak emissions corresponding to feeding activity whereas emission rates dropped during rumination. Yet, for Dorich et al. (2015) and Hegarty (2013) CH4 emissions were also higher during rumination. Whereas, for McCauley and Dziuk (1965) short sporadic variations in the CH4 released were observed, but this was not explained by animal behavior.
With diets providing similar levels of net energy, cows produced 20% more CH4 per kg DM consumed for HAY100 than for LIN100. Absolute values obtained here were consistent with data reported by Madsen et al. (2010) (1.342 L CH4×h-1×kg-1 DMI), or those presented by Martin et al. (2016) who quantified 1.363 L CH4×h-1×kg-1 DMI for a diet devoid of linseeds and 0.850 L CH4×h-1×kg-1 DMI for a diet with 15% linseed. In this study, incorporating 38% linseed and 19% wheat in the diet decreased the CH4 emission by 38% (6.86 L/h vs. 4.26 L/h) and eructation frequency by 44% (0.462 eructation/min vs. 0.260 eructation/min). It is well documented that incorporating increasing levels of extruded linseed into the diet of cows reduces enteric CH4 emissions linearly (Martin et al., 2016). When DFA was reduced by 30%, CH4 emission only decreased by 8.9% and 6.8% and eructation frequency by 15.3% and 12.3%, for HAY and LIN diets respectively. The lower magnitude in the reduction in CH4 emissions compared to the reduction in DFA is a consequence of the slower rumen passage rate, leaving a longer time for fermentation of the feed (Demeyer and Fievez, 2000).
ACCEPTED MANUSCRIPT
19
Compared to LIN, HAY produced more CH4 consistent with the VFA profile in the rumen with more acetate and a higher acetate:propionate ratio (Figure 4). The production of acetate and butyrate releases H2, whereas propionate requires H2, acting as a H2 sink. Hydrogen released in excess must be used by methanogenic archaea to reduce CO2 into CH4. So a high acetate:propionate ratio leads to more CH4 produced per mole of VFA (Benchaar et al., 2015; Sauvant et al., 2011). Lassen et al. (2012) explained that a high proportion of concentrates with limited physical structure in the diet decreases acetic acid. It was also reported that dietary polyunsaturated fatty acids, such as those prevalent in linseed, are extensively metabolized mainly through hydrogenation and this affects rumen methanogenic populations such as archaea (Doreau et al., 2012; Machmüller, 2006; Plascencia et al., 1999). Another feature is a reduction of the DFA by complementing the diet with lipids which leads to less fermentation material (Benchaar et al., 2015). Finally, the bypass effects of concentrate feeds in the rumen reduces CH4 production by reducing fermentation (Knapp et al., 2014).
5. Conclusion
CH4 emission dynamics was observed using the CH4:CO2 ratio in the cow’s exhaled air. Moreover, the continuous monitoring of CH4 and CO2 in breath allowed the magnitude of changes in daily calculated CH4 emission (CH4 (L/h)) to be estimated according to the diet composition, the daily forage allowance and, most importantly, the time after feeding. This approach showed that a concentrate-based diet with linseed considerably reduces the eructation frequency and CH4 (L/h) emissions. The same phenomenon was observed with a reduction of the DFA to 70%. Moreover, over the course of a day, the differences between the maximal and the minimal emissions varied by a factor of 2 according to the time after feeding, which was consistent with differences in acetate:propionate ratio dynamics. Hence, the variability of the CH4 (L/h) suggests that an extrapolation of short term measurements could lead to up to 100% error in the estimation of CH4 daily emissions. Finally, a better
ACCEPTED MANUSCRIPT
20
knowledge of CH4 emission patterns provided by a continuous high-rate measurement technique could lead to innovative management practices to limit CH4 emissions.
6. Acknowledgments
The authors gratefully acknowledge the personnel of Gembloux Agro-Bio Tech for their assistance, especially Rudy Schartz for his technical assistance in mounting the CH4 gas sensors. The research was financed by Gembloux Agro-Bio Tech - University of Liege (AgriGES project) and performed within the framework of CARE AgricultureIsLife.
Conflicts of interest: none
7. References
Andriamandroso, A.L.H., Lebeau, F., Beckers, Y., Froidmont, E., Dufrasne, I., Heinesch, B., Dumortier, P., Blanchy, G., Blaise, Y., Bindelle, J., 2017. Development of an open-source algorithm based on inertial measurement units (IMU) of a smartphone to detect cattle grass intake and ruminating behaviors. Comput. Electron. Agric. 139, 126–137. doi:10.1016/j.compag.2017.05.020.
AOAC, 1995. Official methods of analysis of AOAC International, Association of Official Analysis Chemists International. doi:10.3109/15563657608988149
Bell, M.J., Saunders, N., Wilcox, R.H., Homer, E.M., Goodman, J.R., Craigon, J., Garnsworthy, P.C., 2014. Methane emissions among individual dairy cows during milking quantified by eructation peaks or ratio with carbon dioxide. J. Dairy Sci. 97, 6536–6546. doi:10.3168/jds.2013-7889.
ACCEPTED MANUSCRIPT
21
Benchaar, C., Hassanat, F., Martineau, R., Gervais, R., 2015. Linseed oil supplementation to dairy cows fed diets based on red clover silage or corn silage: Effects on methane
production, rumen fermentation, nutrient digestibility, N balance, and milk production. J. Dairy Sci. 98, 7993–8008. doi:10.3168/jds.2015-9398.
Blaise, Y., Lebeau, F., Andriamandroso, A., Beckers, Y., Heinesch, B., Bindelle, J., 2016. Linking cattle grazing behavior to methane and carbon dioxide dynamics. Appl. Biol. Sci 81, 1–218.
Centraal Veevoeder Bureau (CVB), 2007. CVB table ruminants 2007. Chemical composition and nutritional values of feedstuffs and feeding standards. Den Haag, Netherlands, CVB series no, 32.
Cottle, D.J., Velazco, J., Hegarty, R.S., Mayer, D.G., 2015. Estimating daily methane production in individual cattle with irregular feed intake patterns from short-term methane emission measurements. Animal 1–9. doi:10.1017/S1751731115001676.
Decruyenaere, V., Lecomte, P., Demarquilly, C., Aufrere, J., Dardenne, P., Stilmant, D., Buldgen, A., 2009. Evaluation of green forage intake and digestibility in ruminants using near infrared reflectance spectroscopy (NIRS): Developing a global calibration. Anim. Feed Sci. Technol. 148, 138–156. doi:10.1016/j.anifeedsci.2008.03.007.
Demeyer, D., Fievez, V., 2000. Ruminants et environnement : la méthanogenèse. Ann Zootech 49, 95–112. doi:10.1051/animres:2000110.
Doreau, M., Fievez, V., Troegeler-Meynadier, A., Glasser, F., 2012. Métabolisme ruminal et digestion des acides gras longs chez le ruminant: Le point des connaissances récentes. Prod. Anim. 25, 361–374.
ACCEPTED MANUSCRIPT
22
Dorich, C.D., Varner, R.K., Pereira, A.B.D., Martineau, R., Soder, K.J., Brito, A.F., 2015. Short communication: Use of a portable, automated, open-circuit gas quantification system and the sulfur hexafluoride tracer technique for measuring enteric methane emissions in Holstein cows fed ad libitum or restricted. J. Dairy Sci. 98, 2676–2681. doi:10.3168/jds.2014-8348.
Festing, M.F.W., Altman, D.G., 2002. Guidelines for the design and statistical analysis of experiments using laboratory animals. ILAR J. 43, 244–258. doi:10.1093/ilar.43.4.244
Garnsworthy, P.C., Craigon, J., Hernandez-Medrano, J.H., Saunders, N., 2012. Variation among individual dairy cows in methane measurements made on farm during milking. J. Dairy Sci. 95, 3181–3189. doi:10.3168/jds.2011-4606.
Grainger, C., Clarke, T., McGinn, S.M., Auldist, M.J., Beauchemin, K.A., Hannah, M.C., Waghorn, G.C., Clark, H., Eckard, R.J., 2007. Methane emissions from dairy cows measured using the sulfur hexafluoride (SF6) tracer and chamber techniques. J. Dairy Sci. 90, 2755–2766. doi:10.3168/jds.2006-697
Hammond, K.J., Jones, A.K., Humphries, D.J., Crompton, L.A., Reynolds, C.K., 2016. Effects of diet forage source and neutral detergent fiber content on milk production of dairy cattle and methane emissions determined using GreenFeed and respiration chamber techniques. J. Dairy Sci. 99, 7904–7917. doi:10.3168/jds.2015-10759.
Haque, M.N., Cornou, C., Madsen, J., 2014. Estimation of methane emission using the CO2 method from dairy cows fed concentrate with different carbohydrate compositions in automatic milking system. Livest. Sci. 164, 57–66. doi:10.1016/j.livsci.2014.03.004.
ACCEPTED MANUSCRIPT
23
Haque, M.N., Hansen, H.H., Storm, I.M.L.D., Madsen, J., 2017. Comparative methane estimation from cattle based on total CO 2 production using different techniques. Anim. Nutr. 3, 175–179. doi:10.1016/j.aninu.2017.04.004.
Hegarty, R.S., 2013. Applicability of short-term emission measurements for on-farm quantification of enteric methane. Animal 7 Suppl 2, 401–8.
doi:10.1017/S1751731113000839.
Johnson, K.A., Johnson, D.E., 1995. Methane emissions from cattle. J. Anim. Sci. 73, 2483– 2492. doi:/1995.7382483x
Knapp, J.R., Laur, G.L., Vadas, P. a, Weiss, W.P., Tricarico, J.M., 2014. Invited review: Enteric methane in dairy cattle production: quantifying the opportunities and impact of reducing emissions. J. Dairy Sci. 97, 3231–61. doi:10.3168/jds.2013-7234.
Komaragiri, M. V, Casper, D.P., Erdman, R.A., 1998. Factors affecting body tissue mobilization in early lactation dairy cows. 2. Effect of dietary fat on mobilization of body fat and protein. J. Dairy Sci. 81, 169–175. doi:10.3168/jds.S0022-0302(98)75564-X.
Lassen, J., Løvendahl, P., Madsen, J., 2012. Accuracy of noninvasive breath methane measurements using Fourier transform infrared methods on individual cows. J. Dairy Sci. 95, 890–898. doi:10.3168/jds.2011-4544.
Lassey, K.R., Pinares-Patiño, C.S., Martin, R.J., Molano, G., McMillan, A.M.S., 2011. Enteric methane emission rates determined by the SF6 tracer technique: Temporal patterns and averaging periods. Anim. Feed Sci. Technol. 166–167, 183–191. doi:10.1016/j.anifeedsci.2011.04.066.
ACCEPTED MANUSCRIPT
24
Lockyer, D.., Champion, R.., 2001. Methane production by sheep in relation to temporal changes in grazing behaviour. Agric. Ecosyst. Environ. 86, 237–246.
doi:10.1016/S0167-8809(00)00289-9.
Machmüller, A., Hegarty, R.S., 2006. Alternative tracer gases for the ERUCT technique to estimate methane emission from grazing animals. Int. Congr. Ser. 1293, 50–53. doi:10.1016/j.ics.2006.01.029.
Machmüller, A., 2006. Medium-chain fatty acids and their potential to reduce methanogenesis in domestic ruminants, in: Agriculture, Ecosystems and Environment. pp. 107–114. doi:10.1016/j.agee.2005.08.010.
Madsen, J., Bertelsen, M.F., 2012. Methane production by red-necked wallabies (Macropus rufogriseus). J. Anim. Sci. 90, 1364–1370. doi:10.2527/jas.2011-4011
Madsen, J., Bjerg, B.S., Hvelplund, T., Weisbjerg, M.R., Lund, P., 2010. Methane and carbon dioxide ratio in excreted air for quantification of the methane production from ruminants. Livest. Sci. 129, 223–227. doi:10.1016/j.livsci.2010.01.001.
Martin, C., Ferlay, A., Mosoni, P., Rochette, Y., Chilliard, Y., Doreau, M., 2016. Increasing linseed supply in dairy cow diets based on hay or corn silage: Effect on enteric methane emission, rumen microbial fermentation, and digestion. J. Dairy Sci. 99, 3445–3456. doi:10.3168/jds.2015-10110.
McCauley, E.H., Dziuk, H.E., 1965. Correlation of motility and gas collection from goat rumen. Am. J. Physiol. 209, 1152–1154.
Miwa, M., Oishi, K., Anzai, H., Kumagai, H., Ieiri, S., Hirooka, H., 2017. Estimation of the energy expenditure of grazing ruminants by incorporating dynamic body acceleration
ACCEPTED MANUSCRIPT
25
into a conventional energy requirement system. J. Anim. Sci. 95, 901–909. doi: 10.2527/jas.2016.0749
Nolan, J. V., Hegarty, R.S., Hegarty, J., Godwin, I.R., Woodgate, R., 2010. Effects of dietary nitrate on fermentation, methane production and digesta kinetics in sheep. Anim. Prod. Sci. 50, 801–806. doi:10.1071/AN09211.
Plascencia, A., Estrada, M., Zinn, R.A., 1999. Influence of free fatty acid content on the feeding value of yellow grease in finishing diets for feedlot cattle. J. Anim. Sci. 77, 2603–2609. doi:10.2527/1999.77102603x.
Poelaert, C., Despret, X., Sindic, M., Beckers, Y., Francis, F., Portetelle, D., Soyeurt, H., Théwis, A., Bindelle, J., 2017. Cooking Has Variable Effects on the Fermentability in the Large Intestine of the Fraction of Meats, Grain Legumes, and Insects That Is Resistant to Digestion in the Small Intestine in an in Vitro Model of the Pig’s
Gastrointestinal Tract. J. Agric. Food Chem. 65, 435–444. doi:10.1021/acs.jafc.6b04599.
Ricci, P., Chagunda, M.G.G., Rooke, J., Houdijk, J.G.M., Duthie, C.A., Hyslop, J., Roehe, R., Waterhouse, A., 2014. Evaluation of the laser methane detector to estimate methane emissions from ewes and steers. J. Anim. Sci. 92, 5239–5250. doi:10.2527/jas2014-7676.
Sauvant, D., Giger-Reverdin, S., Serment, A., Broudiscou, L., 2011. Influences des régimes et de leur fermentation dans le rumen sur la production de méthane par les ruminants. Prod. Anim. 24, 433–446.
Savian, J.V., Neto, A.B., de David, D.B., Bremm, C., Schons, R.M.T., Genro, T.C.M., do Amaral, G.A., Gere, J., McManus, C.M., Bayer, C. de Faccio Carvalho, P.C., 2014.
ACCEPTED MANUSCRIPT
26
Grazing intensity and stocking methods on animal production and methane emission by grazing sheep: Implications for integrated crop–livestock system. Agric. Ecosyst. Environ. 190, 112–119. doi: 10.1016/j.agee.2014.02.008
Shannon, C.E., 1949. Communication in the Presence of Noise. Proc. IRE 37, 10–21. doi:10.1109/JRPROC.1949.232969.
Smith, D., Pysanenko, A., Spanel, P., 2009. The quantification of carbon dioxide in humid air and exhaled breath by selected ion flow tube mass spectrometry David. Rapid Commun. Mass Spectrom. 23, 1419–1425. doi:10.1002/rcm.4016.
Tamminga, S., Van Straalen, W.M., Subnel, A.P.J., Meijer, R.G.M., Steg, A., Wever, C.J.G., Blok, M.C., 1994. The Dutch protein evaluation system: the DVE/OEB-system. Livest. Prod. Sci. 40, 139–155. doi:10.1016/0301-6226(94)90043-4.
Van Es, A.J.H., 1975. Feed evaluation for dairy cows. Livest. Prod. Sci. 2, 95–107. doi:10.1016/0301-6226(75)90029-9.
Van Soest, P.J., Robertson, J.B., Lewis, B.A., 1991. Methods for dietary fiber, neutral detergent fiber, and nonstarch polysaccharides in relation to animal nutrition. J. Dairy Sci. 74, 3583–3597. doi:10.3168/jds.S0022-0302(91)78551-2.
Velazco, J.I., Mayer, D.G., Zimmerman, S., Hegarty, R.S., 2015. Use of short-term breath measures to estimate daily methane production by cattle. Animal 1–9.
ACCEPTED MANUSCRIPT
27
Yan, T., Mayne, C.S., Gordon, F.G., Porter, M.G., Agnew, R.E., Patterson, D.C., Ferris, C.P., Kilpatrick, D.J., 2010. Mitigation of enteric methane emissions through improving efficiency of energy utilization and productivity in lactating dairy cows. J. Dairy Sci. 93, 2630–2638. doi:10.3168/jds.2009-2929.
ACCEPTED MANUSCRIPT
28
TABLES
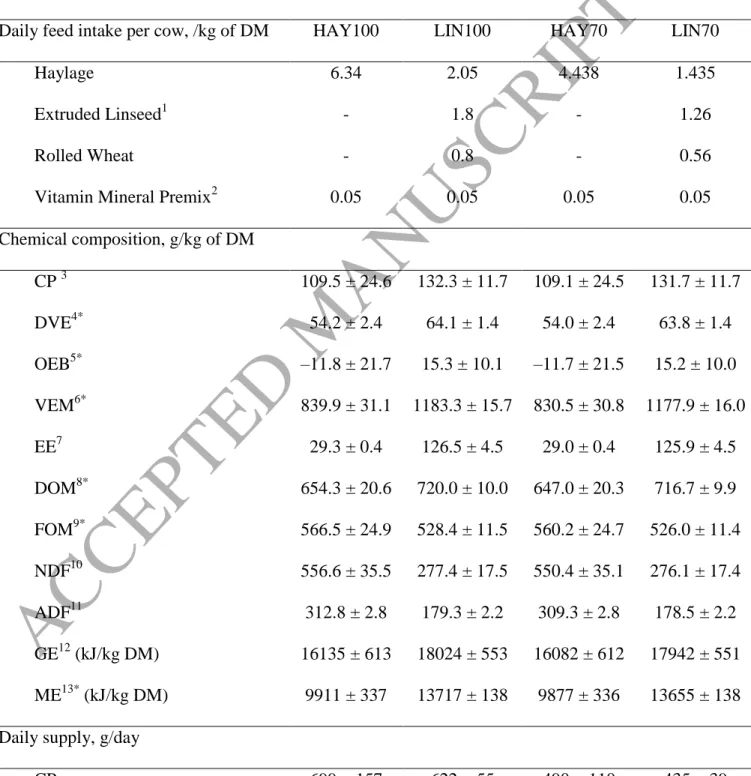
Table 1. Composition and analysis of the tested diets, haylage diet (HAY100), the haylage diet reduced to 70% (HAY70), concentrate diet with wheat and linseed (LIN100), and the LIN diet reduced to 70% (LIN70) (N = 6, samples of 6 bales of haylage and 6 samples of LIN and wheat)
Daily feed intake per cow, /kg of DM HAY100 LIN100 HAY70 LIN70
Haylage 6.34 2.05 4.438 1.435
Extruded Linseed1 - 1.8 - 1.26
Rolled Wheat - 0.8 - 0.56
Vitamin Mineral Premix2 0.05 0.05 0.05 0.05
Chemical composition, g/kg of DM CP 3 109.5 ± 24.6 132.3 ± 11.7 109.1 ± 24.5 131.7 ± 11.7 DVE4* 54.2 ± 2.4 64.1 ± 1.4 54.0 ± 2.4 63.8 ± 1.4 OEB5* –11.8 ± 21.7 15.3 ± 10.1 –11.7 ± 21.5 15.2 ± 10.0 VEM6* 839.9 ± 31.1 1183.3 ± 15.7 830.5 ± 30.8 1177.9 ± 16.0 EE7 29.3 ± 0.4 126.5 ± 4.5 29.0 ± 0.4 125.9 ± 4.5 DOM8* 654.3 ± 20.6 720.0 ± 10.0 647.0 ± 20.3 716.7 ± 9.9 FOM9* 566.5 ± 24.9 528.4 ± 11.5 560.2 ± 24.7 526.0 ± 11.4 NDF10 556.6 ± 35.5 277.4 ± 17.5 550.4 ± 35.1 276.1 ± 17.4 ADF11 312.8 ± 2.8 179.3 ± 2.2 309.3 ± 2.8 178.5 ± 2.2 GE12 (kJ/kg DM) 16135 ± 613 18024 ± 553 16082 ± 612 17942 ± 551 ME13* (kJ/kg DM) 9911 ± 337 13717 ± 138 9877 ± 336 13655 ± 138 Daily supply, g/day
ACCEPTED MANUSCRIPT
29 GE (kJ/day) 102297 ± 3886 84713 ±2600 71607.7 ± 2720 59299 ± 1792 ME (kJ/day) 63330 ± 1410 64471 ± 649 44330 ± 1406 45130 ± 452 DVE 346 ± 15 301 ± 6 242 ± 11 211 ± 5 OEB –75 ± 139 72 ± 47 –52 ± 96 50 ± 33 VEM 5367 ± 199 5562 ± 74 3727 ± 138 3893 ± 53 EE 187 ± 3 595 ± 21 130 ± 2 416 ± 15 DOM 4181 ± 131 3384 ± 47 2904 ± 91 2369 ± 33 FOM 3620 ± 159 2483 ± 54 2514 ± 111 1738 ± 38 NDF 3557 ± 227 1304 ± 82 2470 ± 158 913 ± 58 ADF 1999 ± 18 843 ± 11 1388 ± 12 590± 7 1Extruded commercial concentrate (Nutex 68; Dumoulin, Seilles, Belgium) made of linseed, wheat, sunflower cake, field beans, peas, and salt.
2
Declared contents 12% Ca, 4% Mg, 4% P, 38% Na, 6,000 mg of Zn/kg, 4,000 mg of Mn/kg, 1,750 mg of Cu/kg, 150 mg of I/kg, 100 mg of Co/kg, 40 mg of Se/kg, 750,000 IU of vitamin A/kg, 75,000 IU of vitamin D3/kg, 1,000 mg of vitamin E/kg, 30 mg of vitamin B1/kg, 80 mg of vitamin B2/kg, 20 mg of vitamin B6/kg, 0.3 mg of vitamin B12/kg, 4 mg/kg of vitamin K3, Biotine 0.1 mg/kg , Niacinamide 160 mg/kg (MATH’S PRESTA P, Bauwen Benoit SPRL, Sombreffe, Belgium).
3
CP = crude protein.
According to the Dutch Feed Evaluation Scheme (Van Es, 1975; Tamminga et al., 1994): 4
DVE = truly digested protein in the small intestine; 5
OEB = degraded protein balance; 6
VEM = Dutch standard for NEL (1 VEM = 6.9 kJ of NEL). 7
ACCEPTED MANUSCRIPT
30
8
DOM = digested organic matter. 9
FOM = fermented organic matter in the rumen. 10
ADF = acid detergent fiber. 11
NDF = Neutral detergent fiber. 12
GE = gross energy.
According to the “centraal Veevoeder bureau” evaluation (CVB, 2007) 13
ME = metabolizale energy * predicted values from NIRS analyzes
ACCEPTED MANUSCRIPT
31
Table 2. For each cow and each diet, a description of the daily metabolic energy intake and mobilized energy (kJ/d) in order to calculate the daily CO2 production.
BW1 (kg) HP needed (kJ/day) 2 diet ME intake (kJ/day) 3 CO2 due to ME intake (L)4 Energy mobilized (kJ/day) 5 CO2 due to energy mobilized (L) 6 Daily volume of CO27 740.5 ± 40.7 68667 ± 2843 HAY100 63330 2639 5337 ± 2843 191 ± 102 2829 ± 102 LIN100 64471 2686 4196 ± 2843 150 ± 102 2836 ± 102 HAY70 44330 1847 24337 ± 2843 869 ± 102 2716 ± 102 LIN70 45130 1880 23537 ±2843 841 ± 102 2721 ± 102 1
Average body weight of the animal measured at the beginning and at the end of the trial 2
Heat production as calculated by Haque et al., 2014 (Equation 1). 3
Metabolic energy measured in the diet.
4
Volume of metabolic CO2 produced with a coefficient of 24 kJ/L of CO2 for a normal diet . 5
Difference between net energy intake and energy required. 6
Co-efficient of 28 kJ/L of CO2 for fat mobilization. 7
ACCEPTED MANUSCRIPT
32
Table 3. Average and Standard Deviation of CH4, CO2 concentrations, CH4:CO2 ratio, CH4 eructation frequency, and CH4 emission (L/h) of cows fed with the 4 different diets (HAY100, HAY70, LIN100, LIN70).
Measurement Diet1 P-value SEM
HAY100 HAY70 LIN100 LIN70
Number of time windows (N) 2822 2997 3006 2826 CH4 (ppm) 607 ± 36a 540 ± 33b 298 ± 212c 297 ± 220c <.0001 2.96 CO2 (ppm) 10414 ± 4702 a 9710 ± 4465b 8713 ± 4860c 8620 ± 4597c <.0001 43.7 Ratio 0.058 ± 0.019a 0.056 ± 0.020b 0.037 ± 0.019c 0.035 ± 0.018d <.0001 2.14e-4 Eructation/min 0.462 ± 0.220a 0.391 ± 0.191b 0.260 ± 0.187c 0.228 ± 0.170d <.0001 0.002 CH4 (L/h) 2 6.86 ± 2.25a 6.25± 2.22b 4.26 ± 2.18c 3.97 ± 1.94d <.0001 0.023 a-d
Means within a line with superscript letters differ significantly (P < 0.001) 1
diets: HAY100 = diet exclusively composed of haylage; LIN100 = diet composed of haylage, wheat, and linseed; HAY70 = HAY100 reduced to 70% of the DMI; LIN70 = LIN100 reduced to 70% of the DMI.
2
CH4 (L/h) is calculated from CH4:CO2 ratio and the daily CO2 production displayed in Table 2.
ACCEPTED MANUSCRIPT
33
Table 4. Kinetic parameters of the CH4 emission (L/h), the time when the maximum values are reached (max time), the value of this maximum ratio (maxCH4), the value of the minimum ratio (minCH4) over 12 hours and the time needed between two meals to reach the half of the total emission (t1/2).
Diet1
Item HAY100 HAY70 LIN100 LIN70 P-value
max time (h) 2.03 ± 0.05a 2.02 ± 0.05a 1.86 ± 0.04c 1.95 ± 0.05b <.0001
maxCH4 (L/h) 7.98± 0.58a 7.37 ± 0.58b 5.77 ± 0.58c 5.17 ± 0.58d <.0001
minCH4 (L/h) 6.19± 0.50a 5.58 ± 0.50a 2.61± 0.63b 3.14 ± 0.50b <.0001
t1/2 (h) 5.44 ± 0.06a 5.39 ± 0.07a 4.75 ± 0.14b 4.83 ± 0.14b <.0001
a - d
Means within a line with superscript letters differ significantly (P < 0.001). 1
diets: HAY100 = diet exclusively composed of haylage; LIN100 = diet composed of haylage, wheat, and linseed; HAY70 = HAY100 reduced to 70% of the DMI; LIN70 = LIN100 reduced to 70% of the DMI.
ACCEPTED MANUSCRIPT
34
Table 5. Average eructation frequency and CH4 emission (L/h) for the 4 different diets focusing on behaviors calculated for the four different diet × daily forage allowance combinations using 300-s time windows.
Diet1 Measure N eating N ruminating N Other P-value
HAY100 Eructation/min 227 0.616 ± 0.243a 366 0.428 ± 0.200b 2090 0.452 ± 0.218b <.001 CH4 (L/h) 7.05 ± 2.10 6.89 ± 2.13 6.84 ± 2.31 0.775 HAY70 Eructation/min 119 0.540 ± 0.257a 238 0.392 ± 0.195b 2091 0.352 ± 0.182b <.001 CH4 (L/h) 6.39 ± 1.89 6.41 ± 2.25 6.40 ± 2.27 0.636 LIN100 Eructation/min 67 0.246 ± 0.184 89 0.261 ± 0.216 2299 0.258 ± 0.190 0.913 CH4 (L/h) 4.06 ± 1.88 4.03 ± 1.67 4.49 ± 2.25 0.636 LIN70 Eructation/min 64 0.166 ± 0.177a 95 0.223 ± 0.180ab 2589 0.232 ± 0.169b 0.001 CH4 (L/h) 3.67 ± 1.74 3.80 ± 2.03 4.00± 1.94 0.811 a b
Means within a line with superscript letters differ significantly (P < 0.001).
1
diets: HAY100 = diet exclusively composed of haylage; LIN100 = diet composed of haylage, wheat and linseed; HAY70 = HAY100 reduced to 70% of the DMI; LIN70 = LIN100 reduced to 70% of the DMI.
ACCEPTED MANUSCRIPT
35
FIGURES
Figure 1. Equipment installed on a cow housed in stanchion-tied stable. Left: the nostril ring (A) and the fixed pipe (B) in front the nostril. Right: The box with the iPhone (C) attached to the halter (D) on the top of the neck.
ACCEPTED MANUSCRIPT
36
Figure 2. Example of the recorded signals for the concentration of CO2 (solid line) and CH4 (dashed line) in the air sampled from the cow’s nostril. The signal for 350 seconds is derived from cow one eating HAY100, 3 hours after a meal.
ACCEPTED MANUSCRIPT
37
Figure 3. Time after feeding dynamics of CH4, CO2, CH4:CO2 ratio and eructation frequency, CH4 (L/h) according to the diet treatment: haylage diet with 100% daily feed allowance (HAY100); haylage diet with 70% daily feed allowance (HAY70); linseed-based diet with 100% daily feed allowance (LIN100); linseed-based diet with 70% daily feed allowance (LIN70). Each point is a 5-min mean of the 4 cows.
ACCEPTED MANUSCRIPT
38
Figure 4. Average VFA concentrations (mmol/L) in the rumen of cows eating the two diets (LIN100 and HAY100) and evolution of the acetate:propionate ratio in the rumen for both diets.