DOI: 10.1126/science.1084993
, 1926 (2003);
300
Science
et al.
C. Aerts,
and Nonrigid Rotation
Asteroseismology of HD 129929: Core Overshooting
www.sciencemag.org (this information is current as of May 16, 2008 ):
The following resources related to this article are available online at
http://www.sciencemag.org/cgi/content/full/300/5627/1926
version of this article at:
including high-resolution figures, can be found in the online
Updated information and services,
http://www.sciencemag.org/cgi/content/full/1084993/DC1
can be found at:
Supporting Online Material
found at:
can be
related to this article
A list of selected additional articles on the Science Web sites
http://www.sciencemag.org/cgi/content/full/300/5627/1926#related-content
40 article(s) on the ISI Web of Science.
cited by
This article has been
http://www.sciencemag.org/cgi/collection/astronomy
Astronomy
:
subject collections
This article appears in the following
http://www.sciencemag.org/about/permissions.dtl
in whole or in part can be found at:
this article
permission to reproduce
of this article or about obtaining
reprints
Information about obtaining
registered trademark of AAAS.
is a
Science
2003 by the American Association for the Advancement of Science; all rights reserved. The title
Copyright
American Association for the Advancement of Science, 1200 New York Avenue NW, Washington, DC 20005.
(print ISSN 0036-8075; online ISSN 1095-9203) is published weekly, except the last week in December, by the
Science
on May 16, 2008
www.sciencemag.org
number of potential positions along the inner helix allow bending.
It is possible that the channel makes use of
both Gly134
and Gly143
sites during gating,
but we believe that Gly134plays a minor role
in gating and a more important role in protein packing in Kir channels. Hence, as the chan-nel begins to open, the slide helix moves laterally. Strain is exerted on the bottom of the inner helix, resulting in distortion of the
helix at the nearest weak point, Gly143. The
blocking residue side chain of Phe146
beneath
Gly143then moves away from the center of
the ion-conduction pathway.
Coupling of gating domain to the block-ing residue. All ion channels have an ion-conduction pathway and a gate. Features of the ion-conduction pathway determine the specificity and rate of ion conduction, where-as the gate functions where-as a switch, opening and closing the pore at the desired time. The section of the protein that detects a signal such as a change in voltage across the mem-brane or binding of a ligand must transmit the signal to the gate to produce a gating action. With KirBac1.1 there has to be a coupling mechanism between the blocking residues of the inner helices and the intracellular domains. The amphipathic slide helix is well placed to play a central role in this coupling mechanism. When the C-terminal assembly receives a signal, it is likely to undergo a conformational change. Again the precise change is unknown, but a rotation centered within the C-terminal domain would be consistent with the KirBac1.1 model and the proposed MthK domain motion. Be-cause the outer helix is directly connected to the slide helix, it must move in the same
direction, thereby creating room for the inner helix to bend.
Summary. KirBac1.1 was crystallized in a
closed state, whereas all other K⫹ channel
structures to date have been open. KirBac1.1 prevents ion conduction by (i) occluding the ion-conduction pathway with the use of hydro-phobic phenylalanine side chains, (ii) misalign-ing pore helices, (iii) decreasmisalign-ing the volume of the central cavity, and (iv) altering the confor-mation of the selectivity filter. The structure provides a hypothesis for gating, involving in-tracellular domain movement, slide helix move-ment, and bending of the inner helix just above
the blocking residue. In our view, many K⫹
channels are likely to share a fundamentally similar mechanism of gating and coupling in which properties of the gating domains deter-mine how and when the channel opens.
References and Notes
1. F. M. Ashcroft, Ion Channels and Diseases (Academic Press, New York, 2000).
2. B. Hille, Ionic Channels of Excitable Membranes (Sinauer, Sunderland, MA, 2001).
3. S. R. Durell, H. R. Guy, BMC Evol. Biol. 1, 14 (2001). 4. Materials and Methods are available as supporting
material on Science Online.
5. M. Nishida, R. MacKinnon, Cell 111, 957 (2002). 6. D. A. Doyle et al., Science 280, 69 (1998). 7. D. M. Cortes, L. G. Cuello, E. Perozo, J. Gen. Physiol.
117, 165 (2001).
8. D. L. Minor Jr., S. J. Masseling, Y. N. Jan, L. Y. Jan, Cell 96, 879 (1999).
9. G. Loussouarn, E. N. Makhina, T. Rose, C. G. Nichols,
J. Biol. Chem. 275, 1137 (2000).
10. Z. Lu, R. MacKinnon, Nature 371, 243 (1994). 11. B. A. Wible, M. Taglialatela, E. Ficker, A. M. Brown,
Nature 371, 246 (1994).
12. Y. Kubo, Y. Murata, J. Physiol. 531 (no. 3), 645 (2001). 13. J. Yang, Y. N. Jan, L. Y. Jan, Neuron 14, 1047 (1995). 14. M. Taglialatela, E. Ficker, B. A. Wible, A. M. Brown,
EMBOJ. 14, 5532 (1995).
15. K. Imoto et al., Nature 335, 645 (1988).
16. A. N. Lopatin, E. N. Makhina, C. G. Nichols, Nature 372, 366 (1994).
17. B. Fakler et al., FEBS Lett. 356, 199 (1994). 18. E. Ficker, M. Taglialatela, B. A. Wible, C. M. Henley,
A. M. Brown, Science 266, 1068 (1994).
19. S.-C. Tam, R. J. P. Williams, J. Chem. Soc., Faraday
Trans. 1 80, 2255 (1983).
20. N. Unwin, J. Mol. Biol. 229, 1101 (1993). 21. N. Unwin, Nature 373, 37 (1995).
22. G. Chang, R. H. Spencer, A. T. Lee, M. T. Barclay, D. C. Rees, Science 282, 2220 (1998).
23. O. Beckstein, P. C. Biggins, M. S. P. Sansom, J. Phys.
Chem. B 105, 12902 (2001).
24. B. Roux, R. MacKinnon, Science 285, 100 (1999). 25. Y. Zhou, J. Morais-Cabral, A. Kaufman, R. MacKinnon,
Nature 414, 43 (2001).
26. J. N. Bright, I. H. Shrivastava, F. S. Cordes, M. S. P. Sansom, Biopolymers 64, 303 (2002).
27. Y. Jiang et al., Nature 417, 523 (2002).
28. D. del Camino, M. Holmgren, Y. Liu, G. Yellen, Nature 403, 321 (2000).
29. Aesop; M. E. M. Noble, University of Oxford. 30. We thank the staff of the European Synchrotron
Radiation Facility for help with data collection, in-cluding E. Gordon, J. McCarthy, S. Monaco, and S. Kozieiski. D.A.D. is grateful for support and helpful discussions from L. Johnson, M. Sansom, B. Guy, B. Wallace, L. Hong, S. Iwata, and M. Noble. J.M.G. thanks P. Colman and B. Smith. F.M.A. is funded by the Wellcome Trust and Medical Research Council. J.M.G. was funded by an International Senior Fellow-ship of the Wellcome Trust and by Australian Na-tional Health and Medical Research Council grant 257528. This work was funded by a Wellcome Trust Research Career Development Fellowship awarded to D.A.D. Coordinates for the KirBac1.1 structure have beendeposited with the ProteinData Bank (accession code 1P7B; ID no. RCSB019097).
Supporting Online Material
www.sciencemag.org/cgi/content/full/1085028/DC1 Materials and Methods
Figs. S1 and S2 References
27 March 2003; accepted 29 April 2003 Published online 8 May 2003; 10.1126/science.1085028
Include this information when citing this paper.
R
EPORTS
Asteroseismology of HD 129929:
Core Overshooting and
Nonrigid Rotation
C. Aerts,
1* A. Thoul,
2J. Daszyn´ska,
1,3R. Scuflaire,
2C.
Waelkens,
1M. A. Dupret,
2E. Niemczura,
3A. Noels
2We have gathered and analyzed 1493 high-quality multicolor Geneva photometric data taken over 21 years of the B3Vstar HD 129929. We detect six frequencies,
among which appear the effects of rotational splitting with a spacing of⬃0.0121
cycles per day, which implies that the star rotates very slowly. A nonadiabatic analysis of the oscillations allows us to constrain the metallicity of the star to
Z僆 [0.017,0.022], which agrees with a similar range derived from spectroscopic
data. We provide evidence for the occurrence of core convective overshooting
in the star, with␣ov⫽ 0.10 ⫾ 0.05, and we rule out rigid rotation.
Stars are composed of multiple gas layers with different temperatures, pressures, and chemical compositions. During their
main-sequence phase, that is, while they transform hydrogen into helium in their core, a number
of massive stars undergo oscillations.
Through the study of these oscillations, sci-entists have a unique opportunity to probe the structure of specific layers of those stars. This type of investigation is termed asteroseismol-ogy. Here, we used asteroseismology to study
the interior structure of a 10 –solar mass (MJ)
star of spectral type B, HD 129929. Such a massive B star has a well-developed convec-tive core, the extension of which is uncertain because it depends on a poorly known phe-nomenon called core overshooting (inertial mixing of material from the convective core to the convectively stable upper layer). More-over, the rotation of the star may be a source of mixing between the core and the outer layers. Both effects, which are in general difficult to disentangle from each other (1), affect the evolutionary path of the star; that is, they determine the way in which the star evolves to its supernova stage. In the case of HD 129929, we sought to determine the
ef-R
E S E A R C HA
R T I C L E20 JUNE 2003 VOL 300 SCIENCE www.sciencemag.org
1926
on May 16, 2008
www.sciencemag.org
fectiveness of the overshooting phenomenon, technically measured by the overshooting
pa-rameter (␣ov).
Oscillating main-sequence B stars more massive than 8 solar masses are called -Cephei variables. Their individual oscilla-tion modes, which are driven by an opacity mechanism acting in the metal opacity bump at a temperature of some 200,000°C (2), have multiple periods between 2 and 8 hours. This condition leads to beat periods on the order of several months, which is much longer than the beat periods of main-sequence stars that exhibit solarlike oscillations or of the oscil-lations in compact stars such as white dwarfs. Moreover, the oscillation frequencies in so-larlike stars and in white dwarfs are more numerous and obey certain regular patterns (3, 4 ), which makes their modes much easier to identify than opacity-driven modes in mas-sive stars. This is one of the reasons that
seismic studies of solarlike stars and of white dwarfs are much further advanced than are those of opacity-driven oscillators.
HD 129929 (visual magnitude 8.1, spec-tral type B3V) was discovered to be a micro-variable (5). Three close frequencies were established (6, 7 ) in multicolor photometry of the star, which led (6 ) to classification of the
object as a new -Cephei star. We have
continued the photometric monitoring of the star and have assembled 1493 high-quality
(error⬍ 5 millimagnitudes) multicolor data
points during several 3-week runs throughout 21.2 years. All data were gathered with the seven-passband Geneva photometer P 7 at-tached to the 0.7-m Swiss telescope at La Silla Observatory in Chile. The effective tem-perature and the gravity of HD 129929 are available from calibrations of photometric systems (8, 9). These parameters and the metallicity of the star were also derived from low-resolution spectra taken with the Interna-tional Ultraviolet Explorer (10). The overall range in quoted values of the temperature and
gravity is, respectively, log Teff 僆 [4.35,
4.38] and log g僆 [3.87, 3.94], and the
me-tallicity is Z⫽ 0.018 ⫾ 0.004 (10). We have
used these estimates as the starting point of our model grid calculations, but we stress that
our modeling results are independent of this particular result. In fact, we considerably im-prove the estimates of the temperature and the gravity with our seismic analysis.
We have performed both phase dispersion minimization (11) and Fourier analysis (12) on the time series of 1493 data points in each of the seven Geneva filters (Fig. 1). The six frequen-cies that result were found by both of these independent techniques, and all six frequencies are found independently of the order of pre-whitening (i.e., subsequent sine curve subtrac-tion). The periodograms (Fig. 1 and Table 1)
show that f1⫺ f3⬵ f2⫺ f6⬵ f4⫺ f2⬵ 0.0121
cycles per day (c d⫺1); i.e., two frequency
multiplets due to rotational splitting appear in the data. We note that the highest peaks in the
periodograms do not occur for f5and f6but for
their 1-day alias (Fig. 1). We can be sure of this both for physical reasons and for reasons
relat-ed to our models. All models that obey f1,. . ., f4
do not lead to a low-degree mode at f5⫺ 1 or
any other alias of f5, whereas they result in the
radial fundamental mode at f5. Similarly, there
is no low-degree mode available near f6 ⫹ 1,
whereas f6corresponds to the l⫽ 1, p1mode
shifted by the rotation. The frequencies that
show up after prewhitening with f1,. . ., f6 no
longer coincide for the different Geneva filters and/or for the different analysis methods. We hence regard them as ambiguous, and we only make use of the six established frequencies (Fig. 2), which consist of one isolated frequen-cy and ( parts of ) two multiplets.
We modeled the interior structure of HD 129929 with two independent evolutionary
codes, namely the Code Lie´geois d’E´ volution
Stellaire (13) and the Warsaw–New Jersey Evolutionary Code (14). We have considered a
large range in log Teffand in log g and allowed
X 僆 [0.68, 0.74], Y 僆 [0.24, 0.3], and Z 僆
[0.015, 0.03]. We used the opacities derived from the OPAL code (15), completed with the Alexander and Ferguson opacities (16 ) below
log T ⫽ 3.95 and the standard
heavy-ele-ment mixture (17 ). For all these models, we have calculated the oscillation modes with two independent codes for linear nonadia-batic oscillations (18, 19). All the results obtained from these independent codes
1Instituut voor Sterrenkunde, Katholieke Universiteit
Leuven, Celestijnenlaan 200 B, B-3001 Leuven, Bel-gium.2Institut d’Astrophysique et Ge´ophysique,
Uni-versite´ de Lie`ge, alle´e du Six Aouˆt 17, B-4000 Lie`ge, Belgium.3Astronomical Institute of the Wrocław
Uni-versity, ul. Kopernika 11, 51-622 Wrocław, Poland. *To whom correspondence should be addressed. E-mail: conny@ster.kuleuven.ac.be
Fig. 1. Periodograms for the Geneva U data for subsequent stages of prewhitening. The amplitude is expressed in magnitudes. For the values of the frequencies, refer to Table 1. The dotted lines indicate the selected frequencies.
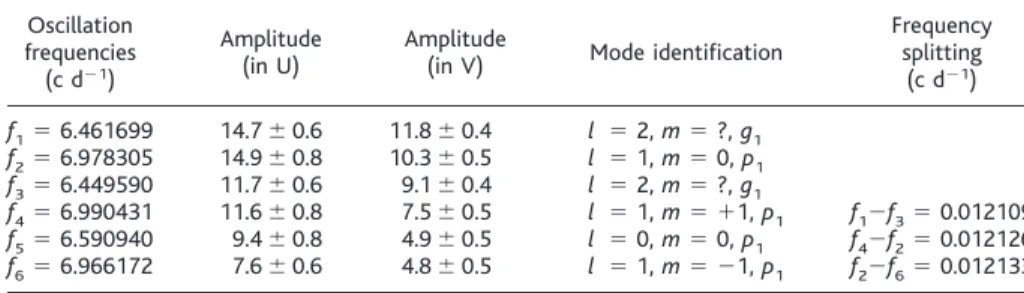
Fig. 2. Final amplitude spectrum of HD 129929. Table 1. Accepted frequencies fi, i⫽ 1,. . .,6 for HD 129929. The standard error is less than 10⫺6c d⫺1
(cycles per day) for all listed frequencies. l and m denote the degree and the azimuthal number of the oscillationmodes. The amplitudes are expressed inmillimagnitudes.
Oscillation frequencies (c d⫺1)
Amplitude
(inU) Amplitude(inV) Mode identification
Frequency splitting (c d⫺1) f1⫽ 6.461699 14.7⫾ 0.6 11.8⫾ 0.4 l ⫽ 2, m ⫽ ?, g1 f2⫽ 6.978305 14.9⫾ 0.8 10.3⫾ 0.5 l ⫽ 1, m ⫽ 0, p1 f3⫽ 6.449590 11.7⫾ 0.6 9.1⫾ 0.4 l ⫽ 2, m ⫽ ?, g1 f4⫽ 6.990431 11.6⫾ 0.8 7.5⫾ 0.5 l ⫽ 1, m ⫽ ⫹1, p1 f1⫺f3⫽ 0.012109 f5⫽ 6.590940 9.4⫾ 0.8 4.9⫾ 0.5 l ⫽ 0, m ⫽ 0, p1 f4⫺f2⫽ 0.012126 f6⫽ 6.966172 7.6⫾ 0.6 4.8⫾ 0.5 l ⫽ 1, m ⫽ ⫺1, p1 f2⫺f6⫽ 0.012133
R
E P O R T Swww.sciencemag.org SCIENCE VOL 300 20 JUNE 2003
1927
on May 16, 2008
www.sciencemag.org
are the same to a high degree of accuracy. The second step in a seismic analysis consists of mode identification of the detect-ed frequencies, that is, to derive the wave numbers (n, l, m) of the modes. The degree l of the modes can be derived from the ampli-tude ratios and phase differences of multi-color photometry. We have used the two nonadiabatic oscillation codes (18, 19) to do so and found agreement for the identifica-tions (Table 1). These identificaidentifica-tions are un-ambiguous because of the sparse frequency distribution due to the slow rotation of HD 129929. Following (20, 21), who provided a method to derive constraints on the metal-licity of the star from the observed amplitude
ratios in B stars, we find that Z⬍ 0.022 is
needed to meet the observed amplitudes and
their errors. Moreover, for Z ⬍ 0.017, the
modes corresponding to the observed fre-quencies are not excited by the opacity mech-anism. This seismically determined interval
Z僆 [0.017, 0.022] is consistent with the one
derived from the independent spectroscopic observations. The physical behavior of the modes of HD 129929 (fig. S2) is representa-tive of the nature of the propagation zone in which they are trapped.
We have computed numerous stellar mod-els, and only a few of them lead to the
observed frequencies f5and f2, which
corre-spond to the radial and axisymmetric dipole modes—modes that are unaffected by the rotation of the star (fig. S3). For all the
models that explain f5and f2well, we have
also calculated the frequency of the l⫽ 2, g1
axisymmetric mode and compared its value with the possible values for that mode for the
case X⫽ 0.7 (Fig. 3, left). We conclude that
the overshooting parameter ␣ov cannot be
equal to 0.2, because this results in a value for
the frequency of the l ⫽ 2 axisymmetric
mode that is too small. Similarly, it cannot be
0, because this value gives results that are inconsistent with the photometric amplitude
ratios. The value␣ov⫽ 0.1 is, on the other
hand, totally acceptable, and for this value we
derive M僆 [9, 9.5] MJ (Fig. 3, right). The
same results are obtained for models with
other values of the parameter X 僆 [0.68,
0.74]. The corresponding ages of the allowed
models are between 1.6⫻ 107and 1.8⫻ 107
years. These models are situated between those indicated by arrows in fig. S3.
The observation of the triplet of
frequen-cies (f6, f2, f4) of the l⫽ 1, p1mode and of
the two components (f3, f1) of the quintuplet
of the l⫽ 2, g1mode (Fig. 2) also allows us
to determine the rotation frequency of the
star. The rotational splitting⌬f is linked to the
internal rate of rotation of the starrotthrough
the linear relation ⌬f ⫽ 兰Knl(r)rot(r)dr,
where the kernel Knl(r) is completely defined
by the mode identification and by the stellar
model. The observed splittings ⌬f ⫽
0.0121295 c d⫺1for the l⫽ 1, p1mode and
⌬f ⫽ 0.012109 c d⫺1for the l⫽ 2, g
1mode
are incompatible with a rigid rotation of the star for the accepted stellar models. Indeed,
the first one would implyrot⫽ 0.012653c
d⫺1, whereas the second one would imply
rot⫽ 0.014730 c d⫺1. On the other hand,
both modes have amplitudes that are too low in the inner regions of the star to give any information on the rotation inside the core. To estimate the rotational behavior in the outer layers, we have assumed the behavior
of rot to follow a linear law of the form
rot(r)⫽ rot,0⫹ (r/R ⫺ 1)rot,1. We then get
rot,0⫽ 0.00713 c d⫺1androt,1⫽ ⫺0.01856
c d⫺1. These values imply a low equatorial
rotation velocity of 2.04 km s⫺1.
We note that no model calculation from the Opacity Project (OP) tables (22) leads to the observed frequencies for appropriate ranges in the stellar parameters of HD
129929. It is at present unclear whether this is due to the 2.5% higher iron fraction or to the different physics used to calculate the OP tables in comparison with the OPAL tables.
Convective core overshooting is not con-sidered in some evolutionary model calcula-tions of massive main-sequence stars (23). The reason is that it does not seem to be a necessary ingredient to explain the observed properties of such stars. However, we have found evidence for the presence of
overshoot-ing with ␣ov僆 [0.05, 0.15] in HD 129929,
because the star has an extremely low rota-tional velocity, so rotarota-tional effects can be neglected. We have adopted the standard so-lar mixture in our model calculations; an important open question, for any asteroseis-mic analysis, is how much the results may change if a different mixture is considered.
References and Notes
1. J.-C. Mermilliod, A. Maeder, Astron. Astrophys. 158, 45 (1986).
2. W. A. Dziembowski, A. A. Pamyatnykh, Astron.
Astro-phys. 248, L11 (1993).
3. F. Bouchy, F. Carrier, Astron. Astrophys. 374, L5 (2001). 4. D. E. Winget et al., Astrophys. J. 378, 326 (1991). 5. F. Rufener, Astron. Astrophys. Suppl. Ser. 45, 207
(1981).
6. C. Waelkens, F. Rufener, Astron. Astrophys. 119, 279 (1983).
7. D. Heynderickx, Astron. Astrophys. Suppl. Ser. 96, 207 (1992).
8. R. R. Shobbrook, Mon. Not. R. Astron. Soc. 214, 33 (1985). 9. D. Heynderickx, C. Waelkens, P. Smeyers, Astron.
Astrophys. 105, 447 (1994).
10. J. Daszyn´ska, E. Niemczura, inpreparation. 11. R. F. Stellingwerf, Astrophys. J. 224, 953 (1978). 12. J. D. Scargle, Astrophys. J. 263, 835 (1982). 13. R. Scuflaire, inpreparation.
14. B. Paczyn´ski, Acta Astron. 20, 47 (1970).
15. F. J. Rogers, C. A. Iglesias, Astrophys. J. 401, 361 (1992).
16. D. R. Alexander, J. W. Ferguson, Astrophys. J. 437, 879 (1994).
17. N. Grevesse, A. Noels, in Origin and Evolution of the
Elements, N. Pratzo, E. Vangioni, M. Casse, Eds.
(Cam-bridge Univ. Press, Cam(Cam-bridge, 1993), pp. 15–25. 18. W. A. Dziembowski, Acta Astron. 27, 95 (1977). 19. M-A. Dupret, Astron. Astrophys. 366, 166 (2001). 20. M-A. Dupret et al., Astron. Astrophys. 398, 677 (2003). 21. M-A. Dupret et al., Astron. Astrophys. 385, 563 (2002). 22. M. J. Seaton, Mon. Not. R. Astron. Soc. 279, 95 (1996). 23. A. Pamyatnykh, Acta Astron. 49, 119 (1999). 24. We are indebted to all the researchers from Leuven
and Geneva who contributed to the gathering of the data over the course of 21 years. C.A. and C.W. acknowledge financial support from the Fund for Scientific Research of Flanders (FWO). A.T., R.S., M.A.D., and A.N. acknowledge financial support from the Interuniversity Attraction Pole (IAP, Belgium), from Programme de De´veloppement d’Experiences Scientifiques (PRODEX) of the European Space Agen-cy, and from the Fonds pour la Formation a` la Re-cherche dans l’Industrie et dans l’Agriculture (FRIA, Belgium). A.T. acknowledges financial support from the Fonds National de la Recherche Scientifique (FNRS, Belgium). J.D. acknowledges financial support from the BelgianFederal Office for Scientific, Tech-nical, and Cultural Affairs (OSTC, Belgium). Supporting Online Material
www.sciencemag.org/cgi/content/full/1084993/DC1 Figs. S1 to S3
27 March 2003; accepted 14 May 2003 Published online 29 May 2003; 10.1126/science.1084993
Include this information when citing this paper.
Fig. 3. Frequency of the l ⫽ 2 axisymmetric mode for the models with X ⫽ 0.7 that fit the frequencies f5 and f2. The squares, dots, and triangles are obtained for ␣ov⫽ 0, 0.1, and 0.2, respectively. The four horizontal lines are the possible values derived from the observations for this axisymmetric mode. (Left) Frequency as a function of metallicity Z. The seismic constraints on Z are represented as vertical lines. (Right) Frequency as a function of mass M for models with␣ov⫽ 0.1. The constraints on the mass obtained by imposing 0.017⬍ Z ⬍ 0.022 and by requiring that the l ⫽ 2 frequency be consistent with the observations are represented as dashed vertical lines.
R
E P O R T S20 JUNE 2003 VOL 300 SCIENCE www.sciencemag.org