HAL Id: hal-00331145
https://hal.archives-ouvertes.fr/hal-00331145
Submitted on 8 Aug 2007
HAL is a multi-disciplinary open access
archive for the deposit and dissemination of
sci-entific research documents, whether they are
pub-lished or not. The documents may come from
teaching and research institutions in France or
abroad, or from public or private research centers.
L’archive ouverte pluridisciplinaire HAL, est
destinée au dépôt et à la diffusion de documents
scientifiques de niveau recherche, publiés ou non,
émanant des établissements d’enseignement et de
recherche français ou étrangers, des laboratoires
publics ou privés.
Mediterranean Sea
P.-M. Poulain, R. Barbanti, J. Font, A. Cruzado, C. Millot, I. Gertman, A.
Griffa, Anne Molcard, V. Rupolo, S. Le Bras, et al.
To cite this version:
P.-M. Poulain, R. Barbanti, J. Font, A. Cruzado, C. Millot, et al.. MedArgo: a drifting profiler
program in the Mediterranean Sea. Ocean Science, European Geosciences Union, 2007, 3 (3),
pp.379-395. �hal-00331145�
www.ocean-sci.net/3/379/2007/
© Author(s) 2007. This work is licensed under a Creative Commons License.
Ocean Science
MedArgo: a drifting profiler program in the Mediterranean Sea
P.-M. Poulain1, R. Barbanti1, J. Font2, A. Cruzado3, C. Millot4, I. Gertman5, A. Griffa6, A. Molcard7, V. Rupolo8, S. Le Bras9, and L. Petit de la Villeon9
1Istituto Nazionale di Oceanografia e di Geofisica Sperimentale (OGS), Trieste, Italy 2Institut de Ci`encies del Mar (ICM-CSIC), Barcelona, Spain
3Centre d’Estudis Avanc¸ats de Blanes (CEAB-CSIC), Blanes, Spain
4Laboratoire d’Oc´eanographie et de Biog´eochimie (LOB-CNRS), La Seyne, France 5Israel Oceanographic and Limnological Research (IOLR), Haifa, Israel
6Consiglio Nazionale delle Ricerche (CNR), La Spezia, Italy 7Universit´e de Toulon et du Var, La Garde, France
8Ente per le Nuove Tecnologie, l’Energia e l’Ambiente (ENEA), Roma, Italy
9Institut Franc¸ais de Recherche pour l’Exploitation de la Mer (IFREMER), Brest, France
Received: 2 August 2006 – Published in Ocean Sci. Discuss.: 3 November 2006 Revised: 31 July 2007 – Accepted: 1 August 2007 – Published: 8 August 2007
Abstract. In the framework of the EU-funded MF-STEP project, autonomous drifting profilers were deployed throughout the Mediterranean Sea to collect temperature and salinity profile data and to measure subsurface currents. The realization of this profiler program in the Mediterranean, re-ferred to as MedArgo, is described and assessed using data collected between June 2004 and December 2006 (including more than 2000 profiles). Recommendations are provided for the permanent future implementation of MedArgo in support of operational oceanography in the Mediterranean Sea.
More than twenty drifting profilers were deployed from re-search vessels and ships-of-opportunity in most areas of the Mediterranean. They were all programmed to execute 5-day cycles with a drift at a parking depth of 350 m and CTD pro-files from either 700 or 2000 m up to the surface. They stayed at the sea surface for about 6 h to be localised by, and trans-mit the data to, the Argos satellite system. The temperature and salinity data obtained with pumped Sea-Bird CTD in-struments were processed and made available to the scientific community and to operational users in near-real time using standard Argo protocols, and were assimilated into Mediter-ranean numerical forecasting models.
In general, the cycling and sampling characteristics chosen for the MedArgo profilers were found to be adequate for the Mediterranean. However, it is strongly advised to use GPS and global cellular phone telemetry or the future Argos bi-directional satellite system in order to avoid data compres-sion and losses, for the continuation of the Mediterranean drifting profiler program.
Correspondence to: P.-M. Poulain
1 Introduction
Freely drifting autonomous oceanographic instruments re-porting data through satellite links have become increasingly used since the 1980’s to monitor the world oceans and seas. Nowadays, numerous surface drifters and subsurface floats or profilers are being used to collect physical, biogeochem-ical and optbiogeochem-ical data. Autonomous drifting instruments are generally cost-effective and allow monitoring over extended geographical areas (e.g., whole oceans or seas) for long time periods (months to years). They also provide data in areas where harsh weather conditions and political reasons pre-clude ship-based measurements. Since they follow the cur-rents, the freely-drifting instruments are often referred to as Lagrangian systems. To be more accurate, they are con-sidered as quasi-Lagrangian when their drift is affected by winds and waves at the surface (e.g., for surface drifters and profilers during their surfacing periods). This Lagrangian na-ture can also be exploited to estimate dispersion statistical properties.
Data provided by drifters, floats and profilers have become abundant over the last couple of years in all oceans and most marginal seas, mostly through international efforts to organ-ise their operation at international level as part of the Global Drifter Program (GDP, see Lumpkin and Pazos, 2007) and the Array for Realtime Geostrophic Oceanography (Argo, see Gould et al., 2004) program. GDP consists of a global array of satellite-tracked drifters to measure surface currents and other parameters such as surface temperature (T ), salin-ity (S), optical properties and winds. Argo is an international effort initiated in 1999 to collect T and S profiles at typically 10-day intervals from the upper 2000 m of the ice-free world
oceans and currents from intermediate depths. The data are provided by drifting profilers equipped with Conductivity-Temperature-Depth (CTD) sensors. At each surfacing, data are telemetered via satellites to data centres where they are processed and made available in near-real-time (NRT) to the community. In mid-2007, the number of Argo profilers worldwide was approaching its target of 3000 operating in-struments.
In the Mediterranean, drifters, floats and drifting profilers have been operated in specific areas mainly as part of na-tional projects since the mid-1980’s. The surface circulation in the Algerian and Adriatic subbasins (Salas et al., 2001; Poulain, 2001; respectively) and the Sicily Channel (Poulain and Zambianchi, 2007) have been studied with drifters, to mention a few examples. Acoustically tracked floats (Testor and Gascard, 2003, 2005), neutrally buoyant at depths be-tween 250 and 1450 m, have been used to study intermediate circulation in the northwestern Mediterranean (1994–1995) and in the Algerian subbasin (1997–1998). The latter study focused on the large scale flow separation and the mesoscale eddy formation contributing to the spreading of the Levan-tine Intermediate Water (LIW) in the Western Mediterranean basin. Pioneering use of drifting profilers in the Mediter-ranean started in 1995–1996 when ALACE (Davis et al., 1992) and MARVOR (Ollitrault et al., 1994) profilers were deployed at the entrance of the Adriatic (Eastern Otranto Channel) and were configured to measure the intermediate circulation near the LIW core (300–400 m) and to profile with a 3-day interval (Poulain and Zanasca, 1998). The pro-filers provided subsurface current and T profile data in both the Adriatic and the northern Ionian (Poulain et al., 2003). Starting in 2000, the United States Naval Oceanographic Of-fice (NAVO) deployed profilers in the Eastern Mediterranean basin in support of military operations. The first units were programmed to drift near 650 m and to measure T and S pro-files every 5 days.
As part of the Mediterranean Forecasting System Toward Environmental Predictions (MFSTEP) project funded by the European Union (EU), international collaboration was or-ganised to collect T , S, and subsurface current data with drifting profilers throughout the Mediterranean Sea, and to make these data available in NRT to the scientific commu-nity and to operational users, and in particular, for assimila-tion into MFSTEP numerical predicassimila-tion models (see Pinardi et al., 2003; Dobricic et al, 2007). This effort, referred to as MedArgo and corresponding to workpackage 4 of the MF-STEP project (Poulain et al., 2004a; Poulain, 2005), is thor-oughly described in this paper. The focus is more on the design and implementation of the profiler program to the Mediterranean Sea than on the analysis of the data collected. A detailed analysis of the CTD profiles and subsurface veloc-ities provided by the MedArgo profilers will be presented in separate papers. The manuscript is organised as follows. De-tails about the profilers are first given (Sect. 2), followed by a discussion on the sampling strategy adopted for the
Mediter-ranean (Sect. 3). Preparatory tests and operational deploy-ments are explained in Sect. 4 while T and S data are pre-sented and briefly discussed in Sect. 5. The effectiveness of the MedArgo profiler array is assessed in Sect. 6 and recom-mendations are offered for its future permanent implementa-tion.
2 Argo profilers
Two types of battery-powered profilers are operated in Argo, one called APEX (manufactured by Webb Research Corpora-tion, USA) and the other one PROVOR (produced by Martec, France). The APEX is the successor of the ALACE (Davis et al., 1992) whereas the PROVOR is based on the MAR-VOR technology (Ollitrault et al., 1994; Loaec et al., 1998, 1999). They were developed in the 1990’s as part of the World Ocean Circulation Experiment (WOCE). Most pro-filers are equipped with Sea-Bird CTD sensors (model 41 pumped MicroCAT with accuracies of 0.002◦C, 0.005 and 2.4 dbars for T , S and pressure, respectively). In the world oceans, they are programmed in the “Park and Profile” con-figuration with a parking depth near 1000 m and a maxi-mum profiling depth of 2000 m. At typically 10-day inter-vals, fluid is pumped into an external bladder to increase the profiler volume and make it ascend while measuring T , con-ductivity (C) and pressure (P ), from which S is calculated. When at surface (typically during 6 h), the profilers are lo-cated by, and transmit data to, the Argos system onboard polar-orbiting satellites (mostly from the National Oceanic and Atmospheric Agency, NOAA), before they deflate their bladder and descend to their parking depth and repeat the cy-cle. Profilers are generally designed to perform ∼150 cycles. The Argo data are transferred to one of the Argo Data As-sembly Centres (DAC) where they are processed and made available in NRT. The data are then sent to one of the Global Data Assembly Centre (GDAC; in Monterey, California or in Brest, France) where they are centralised for easy ac-cess by the scientific community and by operational centres. The two GDAC synchronise their data contents on a daily basis and disseminate them on the Global Telecommunica-tion System (GTS). The Argo data are finally archived at the United States National Ocean Data Centre (US-NODC). All Argo profilers have two identification numbers: the Argos Platform Terminal Transmitter (PTT) identification number and the World Meteorological Organization (WMO) number used for GTS dissemination. In this paper, profilers are iden-tified with their WMO number.
3 MedArgo cycling characteristics and sampling strategy
Given the reduced size of the Mediterranean Sea relative to the world oceans, and of its specific morphology, bathymetry and circulation structures, profilers programmed with the
Argo standard characteristics (i.e., cycles of 10 days with parking and maximum depths of 1000 and 2000 m, respec-tively) are not adequate for the MedArgo program. The spe-cific characteristics chosen for the MedArgo profilers are ex-plained and motivated below.
We have chosen 350 m as the parking depth because it is near the depth of the LIW core in most of the Mediterranean Sea. Drifts at that depth could allow to study the LIW path-ways from its origin in the northern Levantine subbasin to its outflow through the Strait of Gibraltar. It is important to note that the LIW, clearly identified by its S maximum, is an important Mediterranean water mass and a crucial com-ponent of the Mediterranean thermohaline “conveyor belt” circulation. Concerning the maximum profiling depth, alter-nate values of 700 and 2000 m were selected. The first value (700 m) is near the maximum depth of the T-7 XBT probes and 65% of the Mediterranean bathymetry is deeper than this value. The second, 2000 m, below which there is only 40% of the Mediterranean area, is the standard Argo profiling depth. In order to limit the occurrence of grounding on the sea bed, this deeper profiling depth was only programmed every ten cycles.
The second problem is the determination of the cycle length to obtain robust and useful estimates of currents at the parking depth. Indeed, the profiler’s horizontal displace-ments during descent and ascent, and its surface drift after (before) the last (first) satellite fix, introduce errors on the current estimate. The choice of the cycle length was made following the indications from two preliminary studies based on statistical results obtained from historical currentmeter data and based on numerical results derived from an Ocean General Circulation Model (OGCM).
Historical data on current profiles in selected areas of the Mediterranean, including the major current systems such as in the Algerian subbasin, were used to estimate relative error on the currents near 350 m as observed by the MedArgo pro-filers (Griffa and Molcard, 2003). Typical velocity profiles deduced from the data in the selected areas were used, along with their variance, in a simple statistical model to calculate the profiler mean displacements, and their standard errors, in the water column above 700 m during cycles of 3.5 and 7 days. In addition to the drift time at the parking depth, these time intervals include the periods during which the profiler is ascending, descending and drifting at the surface after (be-fore) the last (first) satellite fix (about 7.5 h) and the surface time while it is transmitting data to, and tracked by, the satel-lites (4.5–6.5 h). The errors appeared to be highly dependent on the current regimes. In strong currents with fluctuations highly correlated in the vertical (e.g., in the Liguro-Provenc¸al and Catalan subbasins) the relative errors on the subsurface mean currents are rather low (<20% and <40% for cycles of 7 and 3.5 days, respectively). For currents more confined to the surface and less correlated in the vertical (e.g., the cur-rent system in the Algerian subbasin), the expected error can reach 100% (60%) for a cycle length of 3.5 (7) days,
dur-ing specific events. As expected, the longer the interval, the smaller is the error, but long cycles have two disadvantages: (1) the corresponding mean currents between two points sep-arated by a long distance are not adequate to represent the circulation in the vicinity of the intricate coastlines and the numerous Mediterranean islands, and (2) the assimilation of profiler displacements (currents) becomes inefficient to cor-rect modelled velocities if the cycle length is longer than the typical Lagrangian integral time scale characteristic of the circulation at 350 m (Molcard et al., 2003).
Numerical simulations of the motions of the MedArgo profilers were done by Rupolo (2003a) and Pizzigalli and Rupolo (2007) using off-line velocity fields provided by the OGCM developed for the Mediterranean as part of the Mediterranean Forecasting System Pilot Project (MFSPP; Pinardi et al., 2003). The Lagrangian integration is based on the method developed by Blanke and Raynaud (1997). A total of seven numerical experiments were conducted with times for the drift at the parking depth (350 m) ranging be-tween 3 and 30 days. As many as 40 000 numerical particles uniformly deployed in most Mediterranean areas deeper than 700 m were integrated for about a year (52 weeks) using the MFSPP model 3-day mean hindcast velocity fields for year 2000. For cycles of 3 and 6 days, the probability density functions of the relative mean error on the sub-surface veloc-ity have a peak around 20–30% and are characterised by long tails due to the presence of cycles (about 10%) in which the subsurface displacement of the profiler is very small (a few km). Consequently, in several areas the mean relative error is high (greater than 100%), and the variance is larger than the mean. In contrast, when considering only cycles char-acterised by subsurface displacements larger than 10–20 km (which are more realistic with respect to real in-situ data), the mean relative error on the inferred subsurface speed can be reduced to 10–30%. Finally, the numerical simulations do not suggest any geographic criterion to exclude observations characterised by small subsurface displacements, even if a relative minor concentration of such cycles is observable in the northern part of the western basin. The numerical simu-lations (Pizzigalli and Rupolo, 2007), however, indicate that the Liguro-Provenc¸al, the Ionian and the Levantine subbasins are favourite sites for profiler deployments in order to obtain small errors on the velocity estimates at 350 m.
In brief, the statistical and numerical approaches described above indicate that short cycles (e.g., 3 days) yield reliable estimates of the subsurface currents only in areas with fast currents and limited vertical shear. Choosing 5 or 6 days helps to decrease the relative error but erroneous results can be obtained in regions with slow currents and/or strong shear. Numerical simulations suggest that with a cycling period of 5–6 days, and considering only cycles characterised by a dis-placement larger than 10 km, the probability of having a rel-ative accuracy on the inferred subsurface speed smaller than 50% is about 80%.
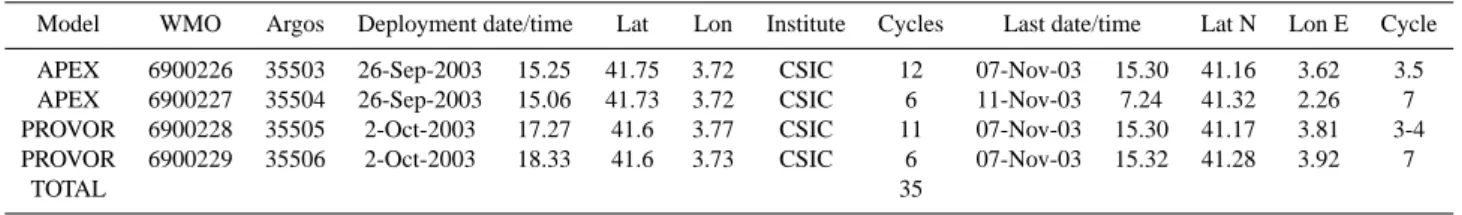
Table 1. Basic statistics for the four pre-TOP MedArgo profilers. The last column shows the cycle length in days. These profilers were
deployed by the Consejo Superior de Investigaciones Cientificas (CSIC) in the Catalan Sea. All times are GMT.
Model WMO Argos Deployment date/time Lat Lon Institute Cycles Last date/time Lat N Lon E Cycle APEX 6900226 35503 26-Sep-2003 15.25 41.75 3.72 CSIC 12 07-Nov-03 15.30 41.16 3.62 3.5 APEX 6900227 35504 26-Sep-2003 15.06 41.73 3.72 CSIC 6 11-Nov-03 7.24 41.32 2.26 7 PROVOR 6900228 35505 2-Oct-2003 17.27 41.6 3.77 CSIC 11 07-Nov-03 15.30 41.17 3.81 3-4 PROVOR 6900229 35506 2-Oct-2003 18.33 41.6 3.73 CSIC 6 07-Nov-03 15.32 41.28 3.92 7
TOTAL 35
Table 2. Specifications of the MedArgo profilers. For the APEX, the up, down and ascent times correspond to the time interval during
descent and at parking depth, the time spent during ascent and while at the surface, and the time spent during ascent, respectively.
Profiler Type APEX PROVOR CTS2 Cycle length (days) 5 5
Parking depth (m) 350 350
Sensors Sea-Bird 41 pumped MicroCAT Sea-Bird 41 pumped MicroCAT Maximum profiling depth (m) 700 and 2000* 700 and 2000*
Number of sampling depths 106 (2000 m) and 80 (700 m) 97 (2000 m) and 71 (700 m) Sampling depths (m) 4,10,15,. . . ,100,110,. . . ,700,750,2000 5,15,. . . ,695,705,725,775,. . . ,1975 Surfacing time (h) – 6
Up times (h) 14 (2000 m) and 8 (700 m) – Down times (h) 106 (2000 m) and 112 (for 700 m) – Ascent times 9 (2000 m) and 6 (700 m) – Argos repetition rate (s) 30 40
* every ten cyles
The above-described Lagrangian numerical simulations using the MFSPP OGCM were also used to study the geo-graphical coverage of the MedArgo data following various deployment strategies. Experiments using several different cycle lengths and two deployment scenarios, one with 40 000 profilers deployed uniformly throughout the deep (>700 m) Mediterranean and the other using 20 units deployed along planned lines of the MFSTEP Volunteer Observing Ship (VOS) program (Manzella et al., 2007), were carried out (Rupolo, 2003b). The motions of the profilers were inte-grated for about a year using the MFSPP mean hindcast ve-locity fields (year 2000) mentioned above. The main con-clusions that emerged from this work are: (1) after a drift of a year, most of the profilers stay confined in the subbasins where they were deployed. Using four tracks of commercial ships in the western basin enables a relatively good sampling of the basin, while deploying profilers along a single zonal commercial track in the eastern basin leads to a poor sam-pling of the Ionian and of the southern Levantine subbasins. So if data are highly required in such regions, plans have to be made to deploy the profilers there; (2) deploying profil-ers, with cycle length of 6 days, in strong (>10 cm/s) current systems results in larger geographical coverage and higher number of independent T and S profile data.
4 MedArgo profiler deployments and tracks
4.1 Pre-TOP deployments
Four profilers were operated in fall 2003 to test their cycling and sampling characteristics before the Targeted Operational Period (TOP) of MFSTEP (Table 1). Two APEX profil-ers were deployed in the Catalan subbasin on 26 September 2003. A week later, on 2–3 October 2003, two PROVORs were deployed with the R/V Garc`ıa del Cid in the vicinity of the APEX profilers. All units were equipped with Sea-Bird MicroCAT CTD sensors (model 41) and were configured to drift at a parking depth of 350 m and to profile between 700 m and the surface. They were operated until 7 November 2003, providing a total of 35 ascending T and S profiles. There-after, the profilers remained at surface until they were recov-ered. Note that the PROVOR also record T and S during the first descent. Since during descent these measurements might be affected by the profiler itself (the sensors being near the top, i.e., downstream, of the tubular body), they are not con-sidered in this paper. Ship-based CTD measurements were made in the vicinity of the profilers upon deployment and recovery. Cycle lengths varied between 3 and 7 days, surfac-ing times were chosen between 6 and 10 h, and the number of sampling depths was set between 60 and 80 to span the water
Table 3. Basic information on the operation of the Medargo profilers in the Mediterranean Sea. Status in the last column is dead (D) or alive
(A) as of 31 December 2006. The institutes responsible for the deployments are: Consejo Superior de Investigaciones Cientificas (CSIC), Centre National de la Recherche Scientifique (CNRS), Istituto Nazionale di Oceanografia e di Geofisica Sperimentale (OGS), Consiglio Nazionale delle Ricerche (CNR) and Israel Oceanographic and Limnological Research (IOLR). All times are GMT.
Model WMO Argos Deployment date/time Lat Lon Institute Cycles Last date/time Lat N Lon E Status APEX 6900278 35503 30-Jun-2004 13.43 41.61 3.94 CSIC 77 30-Jul-2005 14.01 37.4 −1.4 D APEX 6900279 35504 30-Jun-2004 12.18 41.75 3.82 CSIC 93 8-Oct-2005 11.11 39.47 3.29 D APEX 6900280 50762 16-Aug-2004 10.00 38.85 12.97 OGS/CNR 166 29-Dec-2006 10:59 41.41 10.20 A APEX 6900281 50763 15-Aug-2004 20.08 39.61 12.42 OGS/CNR 171 23-Dec-2006 22:03 40.19 13.13 A APEX 6900282 50764 15-Aug-2004 10.46 40.17 11.98 OGS/CNR 171 23-Dec-2006 22:03 40.19 13.13 A PROVOR 6900291 35505 7-Sep-2004 2.14 41.68 6.1 CNRS 82 19-Oct-2005 6.41 42.1 8.12 D PROVOR 6900292 35506 7-Sep-2004 8.32 40.67 6.1 CNRS 169 29-Dec-2006 07:14 42.86 6.45 A PROVOR 6900293 50770 7-Sep-2004 15.23 39.65 7.12 CNRS 169 28-Dec-2006 07:39 40.53 1.93 A PROVOR 6900294 50771 8-Sep-2004 4.27 38.63 7.12 CNRS 72 05-Sep-2005 7.24 38.42 13.36 D PROVOR 6900295 50769 26-Oct-2004 9.15 37.86 0.68 CSIC 30 22-Mar-05 8.22 37.58 5.3 D APEX 6900283 50756 1-Nov-2004 6.00 36.24 21.66 IOLR 0 1-Nov-2004 6.00 36.24 21.66 D PROVOR 6900299 50768 12-Nov-2004 13.15 33.1 16.42 CSIC 96 04-Mar-06 3.05 36.39 22.37 D APEX 6900287 50760 6-Dec-2004 8.23 34.64 26.66 IOLR 53 02-Sep-2005 7.54 30.99 28.74 D APEX 6900286 50759 7-Dec-2004 0.15 36.02 21.18 IOLR 112 27-Dec-2006 03:30 35.19 18.73 A APEX 6900285 50758 7-Dec-2004 6.05 36.7 19.19 IOLR 107 31-May-2006 09:50 38.49 16.58 D APEX 6900284 50757 7-Dec-2004 11.00 37.28 17.49 IOLR 150 27-Dec-2006 16:01 33.95 18.69 A PROVOR 6900296 50765 08-Jan-2004 5.21 33.58 31.3 IOLR 0 08-Jan-2004 5.21 33.58 31.3 D PROVOR 6900297 50766 08-Jan-2005 12.24 34.13 28.58 IOLR 2 02-Feb-05 8.02 35.05 30.64 D PROVOR 6900298 50767 08-Jan-2005 14.15 33.14 16.95 CSIC 15 21-Mar-05 8.01 32.16 17.35 D APEX 6900301 50754 20-May-2005 18.55 34.71 31.35 IOLR 117 31-Dec-2006 22:31 32.62 30.73 A APEX 6900302 50755 21-May-2005 3.47 35.09 28.4 IOLR 115 27-Dec-2006 09:11 34.55 20.90 A APEX 6900300 35503 27-Sep-2005 10.45 41.17 2.61 CSIC 29 19-Feb-06 06.21 38.42 0.37 D APEX 1900630 50761 16-Nov-2005 21.21 32.82 28.79 OGS 82 31-Dec-2006 22:30 33.39 29.77 A PROVOR 1900629 50772 14-Nov-2005 9.06 35.02 21.22 OGS 83 31-Dec-2006 07:13 31.81 17.10 A APEX 6900453 35504 05-Jul-2006 10:20 38.98 3.08 CSIC 35 27-Dec-2006 12:29 39.77 1.41 A
TOTAL 2196
column above 700 m. The periodicity of the Argos transmis-sions was 45 s. Details about these deployments can be found in Font et al. (2003), Le Bras and Poulain (2004) and Poulain et al. (2004b).
The comparison between profiler and ship CTD data con-firmed that the profilers were well calibrated during their en-tire period of operation. In particular, deep values of S agreed within 0.01. The calibration issue triggered the idea to profile once in a while to deep depths (e.g., 2000 m) to intercalibrate the profiler instruments drifting in the same area, and to com-pare the deep T and S measurements to climatological val-ues. It was recommended to program a deep profile down to 2000 m every ten cycles. Cycles of 5 days appeared as a good compromise to obtain useful velocity estimates at the parking depth. A detailed examination of the frequency of transmis-sions (Poulain et al., 2004b) revealed that, out of 5 days, 10 h at the surface are enough to transmit successfully 100 T -S pairs. If the Argos transmission period can be reduced from 45 to 30 s, the surfacing time can be reduced from 10 to 6– 8 h. Based on the above tests, it was decided to program the MedArgo instruments with the parameters listed in Table 2. For the APEX profilers, shallow and deep profiles include 80 and 106 sampling depths, respectively, spanning the
wa-ter column with inwa-tervals of 5 m above 100 m, 10 m between 100 and 700 m, and 50 m below 700 m. For the PROVOR, 71 sampling depths were programmed between 5 and 705 m, with 10 m intervals, and 26 depths between 725 and 1975 m (50 m interval).
4.2 TOP deployments
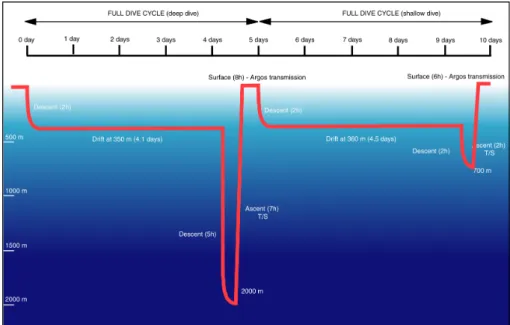
In total, 23 profilers (10 PROVOR and 13 APEX) were ac-quired and were programmed with the above-described pa-rameters (see Table 2 and schematic diagram of the MedArgo cycling characteristics in Fig. 1). The chronology of the deployments is listed in Table 3, along with other details on the profiler operations. The deployment locations of all MedArgo profilers are depicted in Fig. 2. All releases were carried out in sea areas deeper than 2000 m. The operational phase of MedArgo started in summer 2004 with the deploy-ments of two APEXs in the Catalan subbasin on 30 June 2004. By the start of the MFSTEP TOP period (1 Septem-ber 2004), five APEXs were operational in the Catalan and Tyrrhenian subbasins. Five PROVORs were subsequently released in the Liguro-Provenc¸al and Algerian subbasins. All of these deployments were carried out onboard research
Fig. 1. Cycling characteristics of the MedArgo profilers with “Park and Profile” configuration.
Fig. 2. Histogram of the MedArgo profilers released between July
2004 and December 2006 throughout the Mediterranean Sea. The 1000 and 2000-m isobaths are shown with grey curves.
vessels (R/V Garc`ıa del Cid, R/V Urania and R/V Tethys
II). Deployments from ships-of-opportunity were organised
starting in November 2004 in collaboration with the MF-STEP VOS program (Manzella et al., 2007). Profilers were deployed while the ships were steaming at speeds of up to 20 knots using specifically designed deployment cardboard boxes so as to protect the instrument and soften the impact with the sea surface. Profilers were deployed in the Levan-tine and northern Ionian from the Britain Star container ship along the VOS line connecting Haifa, Israel to Salerno, Italy, whereas two PROVORs were released from the Annabella Liquefied Petroleum Gas (LPG) ship along the route between Barcelona, Spain and Benghazi, Libya. Eleven profilers out of 23 were deployed from ships-of-opportunity with mini-mal logistical problems and reduced costs between Novem-ber 2004 and May 2005. The first APEX deployed in June
2004 was recovered in summer 2005 near the Spanish coast. After inspection, this profiler was redeployed in the Catalan subbasin in September 2005. The last two MedArgo profilers were released in the southeastern Ionian and southern Lev-antine subbasins from the R/V OGS-Explora in November 2005 (Poulain et al., 2006). The recovery of APEX 6900279 on Majorca Island in October 2005 gave us the opportunity to have the instrument refurbished and the CTD sensors ibrated by the manufacturer. A comparison between the cal-ibrations before the deployment and after 93 cycles (about one year and three months in the water) indicates that there is no significant drift of the P , T and C sensors. This unit was redeployed south of Majorca Island in July 2006. 4.3 TOP basic statistics
Discarding two units (6900283 and 6900296) that failed right after deployment and never provided any data, and taking into account the profilers that were deployed twice, the west-ern and eastwest-ern basins were seeded with 12 and 11 profil-ers, respectively (Fig. 2). Between 30 June 2004 and 31 De-cember 2006, at least 2245 cycles were executed with good satellite transmission, out of which 2196 (i.e. 98%) had po-sitions. Only eight cycles did not yield any data and, hence, there is no proof that the profiler actually surfaced or stayed at depth for more than five days. Presumably due to the low power of the signal transmitted to the satellite, the profil-ers were sometimes not localised successfully by Argos al-though they transmitted the data while drifting at the surface. A total of 49 cases of this kind occurred, especially for pro-filer 6900286 that was not located for a maximum of 45 days (9 cycles) in April—May 2006.
In the rest of the paper, all results correspond to the MedArgo profilers operated between 30 June 2004 and 31 December 2006 and exclude the two profilers that provided no data. Out of 23 profilers (14 APEXs and 9 PROVORs), 12 units (9 APEXs and 3 PROVORs) were still operating on 31 December 2006, including 5 instruments that have performed more than 160 cycles during 842–865 days. The histogram in Fig. 3a indicates that 12 profilers carried out 50–120 cycles and that 5 instruments performed less than 40 cycles. Note that the short-lived profilers include PROVOR 6900297 that performed only two cycles before drifting continuously at the sea surface and ultimately stranding on the northern coast of Cyprus. If we restrict the histogram to the profilers that have stopped working before 31 December 2006, it can be seen that 4 units stopped after less than 30 cycles, one after 53 cy-cles and 6 after 72–107 cycy-cles (Fig. 3b and Table 3). Seven of these eleven profilers were picked up by seafarers in coastal waters or ended up ashore, whereas the other four (1 APEX and 3 PROVOR) stopped transmitting for unknown reasons. Given the 350-m parking depth and the intermittency of 700-m and 2000-m profiles, it is interesting to examine the incidence of grounding on the sea bed. Considering all the 2245 cycles performed between 30 June 2004 and 31 Decem-ber 2006, about 13% are associated with grounding. If shal-low (2013) and deep (232) cycles are separated, about 11% and 37% of the cycles touch the sea bottom, respectively. These numbers were estimated by interpolating the Smith and Sandwell (1997)’s 2-min Mediterranean bathymetry to the first Argos position after the ascent of each cycle, and comparing then to the programmed profiling depths. This means that about 13% of the T and S profiles are truncated, that is, shorter than expected, due to grounding. The water depth can also be less than 350 m, in this case (occurring for 108 cycles, ∼5%), the profiler sits or is dragged on the sea floor and its displacements cannot be used to estimate cur-rents at the parking depth.
Statistical information on the profiler cycling character-istics are presented in Table 4, for both the APEXs and PROVORs. The surfacing time was estimated approximately from the time difference between the first and last Argos transmissionss while the profiler is drifting at the surface. This is an underestimate (by 1–2 h) of the real surfacing time due to the temporal distribution of the satellite passes. The time span between the first and last Argos positions during each cycle was calculated in the same way. The positions and times before and after each dive are used to estimate the duration, displacement and mean speed while the profiler is submerged. During the surfacing periods of typically 5–6 h (with a maximum of 12 h), we obtain a mean number of satel-lite passes of 8–9, with a maximum of 20. These are the typical values expected using the Argos system onboard six polar-orbiting satellites (NOAA 12, 14, 15, 16, 17 and 18). The mean number of Argos positions per cycle is 5–6, with a maximum of 17 good positions, whereas the mean time dif-ference between the first and last Argos positions is about
Fig. 3. Histogram of the number of cycles carried out by all the
MedArgo profilers between July 2004 and December 2006 (a). Same histogram for the profilers that stopped transmitting before 31 December 2006 (b).
5–6 h. Excluding the cycles longer than ∼5 days, the mean submergence period is 4.8 days, corresponding to a mean dis-placement of 15–17 km and to a mean speed of about 4 cm/s (with maxima of 125 km and ∼30 cm/s for APEX 6900279). 4.4 TOP profiler trajectories
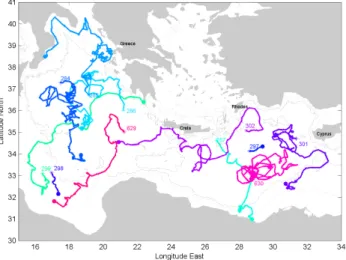
In terms of geographical coverage, several long-lived MedArgo profilers sampled almost entire subbasins of the Mediterranean. For instance, profiler 6900292 covered a large northwestern portion of the western basin including the Liguro-Provenc¸al and the Catalan subbasins (Fig. 4a), profiler 6900299 drifted over most of the Ionian in about 500 days (Fig. 4b) and profiler 6900302 circled cyclonically southeast of Rhodes, headed to the south and got trapped for some time in an anticyclonic eddy southeast of Crete before proceeding westward into the Ionian (see Fig. 4b). Some units were caught by the currents on the continental slope along the periphery of the Mediterranean (part of the basin-scale gyres): APEX 6900285 in the northern Ionian (Fig. 4b), profilers 6900278, 6900279 and 6900300 off Spain
Table 4. Cycling statistics for the two types of MedArgo profilers. The mean (± the standard deviation) and the maximum value are listed
for the number of satellite passes, the number of Argos positions, and the time spans of these values when the profiler is at the surface. Likewise, the statistics are listed for the time period, displacement and speed for the profilers at the parking depth. See text for more details.
Model Number of cycles Number of satellite passes Number of positions Data surfacing time (hours) Position surfacing time (hours) Submergence time (days)* Submergence distance (km)* Submergence mean speed (cm/s)* APEX 1526 8.0±2.5, 20 5.4±2.3, 17 5.8±1.4, 15.7 4.9±1.7, 11.5 4.8±0.1, 5.2 15±13, 125 3.6±3.1, 30.4 PROVOR 719 9.2±1.6, 15 6.2±1.7, 13 5.6±0.8, 10.2 4.8±1.1, 9.6 4.8±0.3, 5.8 17±13, 82 4.0±3.2, 19.4
* excluding 17 cycles longer than ∼5 days
Fig. 4a. Trajectories of the MedArgo profilers between July 2004
and December 2006 throughout the Western Mediterranean basin. The 1000 and 2000-m isobaths are shown with grey curves. The last three digits of the WMO numbers are posted near the deployment locations (shown with star symbols). Solid circles denote the last positions.
Fig. 4b. Same as in Fig. 4a but for the Eastern Mediterranean basin.
and profiler 6900292 off Italy and France (see Fig. 4a). Like-wise, profiler 6900282 followed the continental slope around southern Sardinia and the later part of 6900301 drifted an-ticyclonically around the Eratosthenes seamount (south of Cyprus) and then westward along the African continental slope. Some profilers spent a long time period on the con-tinental shelf or in shallow waters, including APEX 6900287 off Egypt (Fig. 4b) and the three profilers deployed in the Tyrrhenian (Fig. 4a). Another noteworthy track is that of profiler 1900630 that was deployed in a strong anticyclonic eddy in the southern Levantine subbasin and that stayed and circled around such a feature for about 20 cycles (100 days) before proceeding its course towards the northeast (Fig. 4b, see also Poulain et al., 2006). Other interesting trajecto-ries are those of four profilers (6900278, 6900282, 6900294 and 6900295) that operated in the southern part of the west-ern basin, describing looping and eastward drift between the Alboran subbasin and the Sicily Channel (Fig. 4a).
5 CTD profiles
5.1 Data processing
The MedArgo data transmitted through the Argos satellite system were received simultaneously at both the MedArgo Thematic Expert Data Centre (TEDC) at OGS in Trieste, Italy and at the MFSTEP centralised Archiving and Dis-semination Data Centre (ADDC) at IFREMER in Brest, France. At the TEDC, profiler statistics and graphical sum-maries were produced in NRT and were posted on the World Wide Web in a dedicated MedArgo site (http://poseidon. ogs.trieste.it/sire/medargo). At the ADDC, which is also an Argo GDAC and also known as CORIOLIS Operational Oceanography Data Centre, the Argos messages were de-coded, the data were quality controlled and were archived in a user-friendly web-based database (http://www.coriolis.eu. org/cdc/projects/mfstep.htm). The MedArgo data were dis-seminated on the GTS using the profiler’s WMO numbers. In general, processed and quality-controlled data were avail-able within 4 h of the actual measurements. MedArgo and
Fig. 5. Locations of the MedArgo CTD casts downloaded from
the ADCC for the period between July 2004 and December 2006: shallow (700 m; top panel) and deep (2000 m; bottom panel). These depths are the maximum programmed values, some casts are shorter due to shallow bathymetry. The 1000 and 2000-m isobaths are shown with grey curves.
other Mediterranean profiler data were downloaded from the ADDC on a weekly basis to be assimilated into the MF-STEP numerical forecasting models (Dobricic et al., 2007). MedArgo data were also distributed to non-MFSTEP mod-elers such as the French MERCATOR group and to the European-funded Marine Environment and Security for the European Area (MERSEA) project. The final (delayed-mode) quality control and processing of the MedArgo data is still in progress at both the ADDC and TEDC.
The MedArgo profiler data extracted from the ADDC be-tween 30 June 2004 and 31 December 2006 (1922 profiles) represents about 70% of the expected data amount estimated taking into account the drifts of some profilers into shallow areas corresponding to truncation of the CTD profiles. The main causes for the missing data are transmission problems and/or insufficient transmitting times at the surface. It is hoped to decrease somehow the number of missing data via delayed time decoding and manual editing so as to provide a more complete final dataset for scientific applications. The MedArgo data as extracted from the ADDC in early January 2007 are briefly described in the rest of the paper.
Fig. 6. Number of MedArgo CTD casts per month for the Western
and Eastern Mediterranean basins between July 2004 and December 2006 (data downloaded from the ADCC).
5.2 Data distribution
The spatial coverage of the MedArgo T and S profiles is illustrated in Fig. 5. Most of the Mediterranean areas are covered, except the Adriatic and Aegean subbasins, and the Sicily Channel and shallow sea area south of it. Note the availability of T and S profile data in the southern Ionian and southern Levantine where historical data are rather scarce due mainly to political reasons. A total of 1713 (209) profiles correspond to cycles programmed to depths of 700 (2000) m. Temporarily, the distribution of the number of CTD profiles per month (Fig. 6) reaches a plateau near 60 after a few months following the first deployments (from October 2005 to December 2006). July 2005 corresponds to the maximum concentration of observations with 94 profiles. Since profil-ers were first released in the western basin, the majority of the data are localised in this basin in summer and fall 2005. From December 2004 to December 2006, the number of pro-files per month in the western basin decreases from 53 to 24, while the eastern basin concentration varies between 22 and 44 profiles per month.
5.3 Global data description
The CTD data collected by the MedArgo profilers between June 2004 and December 2006, downloaded from the ADDC in early January 2007, are plotted separately for the western and eastern basins in Figs. 7a–c. The potential temperature (θ ) profiles (Fig. 7a) show substantial variability (mostly sea-sonal) in the upper layer with near surface values ranging in 12.7–27.4◦C and 13.4–28.3◦C for the western and east-ern basins, respectively. Near 2000 m, θ values converge to 12.8–13.4◦C (west) and 13.4–13.7◦C (east). Hence, the east-ern basin is generally slightly warmer than the westeast-ern basin.
Fig. 7a. Potential temperature profiles obtained from the MedArgo
profilers between July 2004 and December 2006 for the Western and Eastern Mediterranean basins.
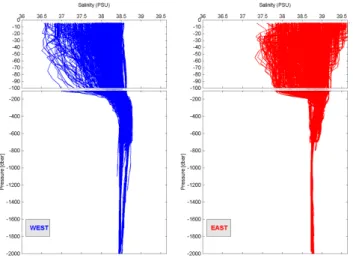
Fig. 7b. Same as Fig. 7a but for salinity.
This is expected since most of the observations in the eastern basin are at lower latitudes with respect to the points in the western one. Note that below 100–200 m, θ profiles in the western basin are separated in two groups, the cooler corre-sponding to the Liguro-Provenc¸al, Catalan, Alboran, Alge-rian subbasins, and the warmer to the Tyrrhenian.
Salinities are also highly variable in the upper 100 m of water mostly due to the advection of low-salinity Atlantic Water (AW; Fig. 7b). Near-surface S values range in 36.5– 38.5 in the west, and in 37.4–39.6 in the east. The subsur-face salinity maximum corresponding to LIW is seen in both basins, although it is more evident in the west due to the re-duced S related to the AW lying above it. Again, the S data below 100–200 m are divided into two groups in the western basin, with higher values corresponding to the Tyrrhenian subbasin. At 2000 m, the range of S reduces to 38.4–38.6 in the western basin, whereas it is 38.7–38.8 in the eastern basin.
Fig. 7c. θ /S diagram obtained from the MedArgo data between
July 2004 and December 2006 for the western and eastern basins (excluding near-surface values which vary seasonally). Isopycnals (sigma-θ ) are overlaid.
Potential temperature and salinity (θ /S) diagrams (Fig. 7c) excluding the seasonally varying near-surface values show clearly the subsurface salinity maximum associated with the LIW (especially in the western basin, ∼38.78). Maximum density at 2000 m depth, reaches 29.11 and 29.20 (in sigma-θunits), in the western and eastern basins, respectively. 5.4 Potential temperature and salinity contour diagrams The CTD data provided by the MedArgo profilers can also be illustrated in the form of contour diagrams following the profilers along their trajectories. Examples of such contour diagrams, in which θ and S are shown as coloured tiles in the time-depth plane, are depicted in Figs. 8 to 12, for 5 profilers in selected Mediterranean areas. Due to the intermittency of the deep profiles, values are only represented between 0 and 700 m. The data were not interpolated to create the contour plots in order to: 1) identify the missing data points (shown as white tiles) and 2) to avoid the creation of artificial struc-tures in data gaps.
In the Catalan and Alboran subbasins (Fig. 8), APEX 6900278 reveals the maintenance, deepening and erosion (or decay) of the seasonal mixed layer in summer and fall 2004. The seasonal thermocline is centred near 40 m, deepening to ∼80 m in October 2004. Thereafter, the thermal struc-ture remains quasi-homogenous through winter 2005, before the new formation of the mixed-layer starting in April–May 2005. In early summer 2005, the thermocline is centred near 20 m when the profiler is looping cyclonically in the eastern Alboran subbasin. In summer 2004, there is a weak signa-ture of a halocline near 40 m in correspondence to the ther-mocline. The following spring and summer, in the Alboran, the profiler encountered near-surface AW with S as low as 36.51 while drifting in a cyclonic eddy. This low-salinity fea-ture extends as deep as ∼100 m. At depth, between 300 and 700 m, there is a weak and broad salinity maximum all along the profiler trajectory, which is related to modified LIW.
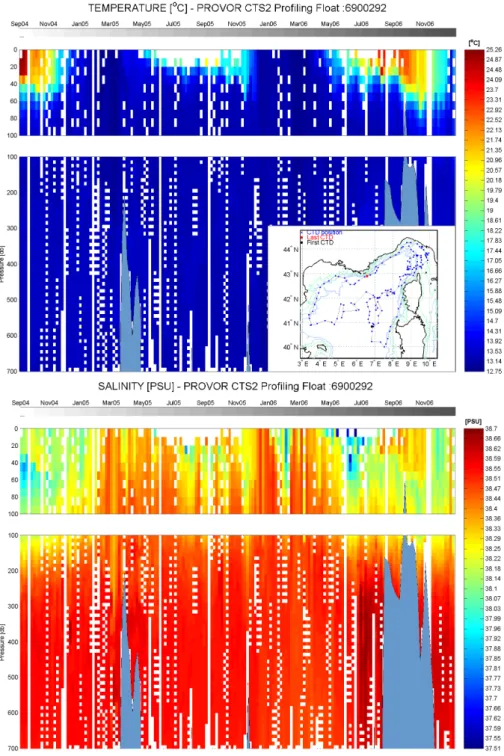
PROVOR 6900292 released west of Sardinia, generally drifted cyclonically in the northern portion of the western
Fig. 8. Contour plot of the potential temperature (top panel) and salinity (bottom panel) following profiler 6900278 between 30 June 2004
and 30 July 2005 in the Western Mediterranean basin. The positions and track of the instrument are overlaid in the temperature panel. White areas correspond to missing data. The insert shows the profiler’s trajectory with the CTD locations (blue dots), the deployment location (black dot) and the last position (red dot).
basin, passing through the Liguro-Provenc¸al and Catalan subbasins (Fig. 9). After about one year and a half, the profiler ended up in the vicinity of its deployment location and repeated a second cyclonic loop in the Liguro-Provenc¸al basin. Near the end of 2006, after 2 years and 4 months of
drift, the instruments was for the second time in front of the French Riviera. The thermal structure sampled by this pro-filer shows the seasonal variations of the mixed layer and thermocline. In particular, the warm surface layer is seen to extend as deep as 50 m depth in late summer and early fall of
Fig. 9. Same as Fig. 8 but for profiler 6900292 between 7 September 2004 and 29 December 2006 in the northern part of the western
Mediterranean basin.
2004 and 2006. There are several signatures of near-surface low salinity (S<38.1) AW extending as deep as 100 m occur-ring northwest of Sardinia in fall 2004, north of Majorca in winter 2006 and north and west of Corsica in summers 2005 and 2006, respectively. The LIW subsurface salinity maxi-mum prevails throughout the entire operating life of the pro-filer, especially in July 2006 when the profiler was drifting west of Corsica (maximum reaching 38.7 near 400 m),
al-most contemporaneous to the near-surface salinity minimum (S<38.1).
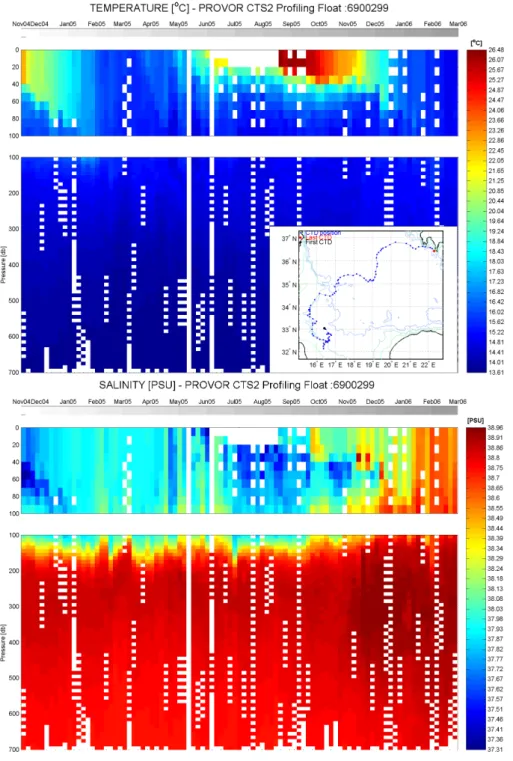
PROVOR 6900299 was deployed on 12 November 2004 in the southern Ionian (Fig. 10). After some southward drift, it generally moved to the north and northeast, crossing the central Ionian subbasin, and eventually reaching the Greek coastal waters in March 2006. Again, the seasonal variabil-ity is seen in the upper-sea thermal structure. In the first 100
Fig. 10. Same as Fig. 8 but for profiler 6900299 between 12 November 2004 and 4 March 2006 in the Ionian.
m of water, the low-salinity AW persists until January 2006 when the profiler reached the northeastern Ionian more saline near-surface waters. The LIW salinity maximum is striking near 300 m. As the profiler moved northeastward and ap-proached the Levantine subbasin, the salinity in the LIW core increases and reaches ∼39.
We finish our qualitative description of the T and S data collected by selected MedArgo profilers, with two APEX units operated in the Levantine subbasin. The first (6900302, Fig. 11) spin cyclonically southeast of the Island of Rhodes before progressing to the southwest and being caught by an anticyclonic eddy (often referred to as Ierapetra) southeast of Crete. Maximal θ and S values (reaching 28.3◦C and 39.5,
Fig. 11. Same as Fig. 8 but for profiler 6900302 between 21 May 2005 and 27 December 2006 in the Levantine subbasin.
respectively) occur at the surface southeast of Rhodes where the warm and salty mixed layer remains shallow (the thermo-cline and halothermo-cline are centred near 20 m). The eddy south-east of Crete is a relatively warm (∼21◦C) and salty (∼39.2) homogeneous structure extending as deep as ∼150 m. Un-derneath this feature (near 200 m), there is a remarkable sig-nature of low-salinity water (∼38.7), presumably related to
the trapping of AW. Following the profiler after it left the area southeast of Rhodes, we can see that the subsurface high salinity (∼39) waters are deepening and stabilizing at a depth near 300 m, hence forming the LIW subsurface salinity max-imum. In summer 2006, high near-surface salinities were sampled south of Crete, before the profiler drifted into the Ionian where lower S values were observed between the
sur-Fig. 12. Same as sur-Fig. 8 but for profiler 1900630 between 16 November 2005 and 31 December 2006 in the Levantine subbasin.
face and 200 m in fall 2006, presumably corresponding to modified AW.
APEX 1900630 was deployed in an anticyclonic eddy (of-ten referred to as Mersa Matruh) of the southern Levan-tine subbasin in November 2005 and swirled around it sev-eral times before escaping to the northeast in March 2006 (Fig. 12). In late fall 2005, there is a strong warm and salty
mixed layer persisting above ∼50 m. In winter, this layer is deepening down to 300 m, with corresponding decrease in T and S. In March 2006, as the profiler exits the eddy, the near-surface temperature decreases. There is a striking signature of low-salinity AW lying between 70 and 300 m, prevailing in the eddy in late fall 2005 and slowly fading away through the subsequent winter. Below this feature, we have the LIW
salinity maximum centred at ∼400 m and enduring as long as the profiler is trapped in the eddy. From late February to April 2006, as the profiler moved northeastward in the Lev-antine subbasin, the salinity maximum extends over the en-tire water column above ∼400 m. From May to December 2006, while the profiler remained in the southern Levantine, there is a strong signature of the creation, deepening (down to ∼100 m) and decay of a relatively warm and salty (S ap-proaches 39.5) surface mixed layer. From July to October 2006, again some AW appears to be trapped under the surface mixed layer and the LIW, at depths ranging in 40–140 m.
6 Conclusions and recommendations
More than twenty MedArgo drifting profilers were operated throughout the Mediterranean Sea starting in June 2004 to provide T and S profile data in near-real time to MFSTEP operational forecasting models and to measure subsurface currents. They were programmed to execute cycles of 5 days with a parking depth near 350 m and maximum profil-ing depths of 700 m (or 2000 m every ten cycles). CTD data were obtained at ∼100 sampling depths separated by 5–10 m above 700 m, and 50 m between 700 and 2000 m. Between June 2004 and December 2006, more than 2000 profiles were obtained, and some profilers had performed as many as 171 cycles.
The cycling and sampling characteristics chosen for the MedArgo profilers turned out to be satisfactorily adequate for the Mediterranean Sea. Five-day cycles correspond to sub-merged displacements of less than ∼100 km, only one (four) out of ten shallow (deep) profiles are truncated because the profilers touched the sea bottom, and only 5% of the cycles occur in water depths less than 350 m and are useless to esti-mate parking depth mean currents. There is some NRT data loss (about 30%) mainly due to transmission problems and to the insufficient surfacing period for satellite data teleme-try. Manual delayed mode processing is expected to reduce this data shortage.
It was estimated that, excluding manpower, the mean cost of a MedArgo CTD profile is about 150 C, which is signifi-cantly less costly than ship-based CTD data. The shortcom-ing of MedArgo profiles is the reduction of data in the verti-cal and the lack of control on their positions. But this draw-back is compensated by the fact that drifting profilers can operate autonomously for years and cover wide geographic areas, including zones where oceanographic measurements from ships are difficult to obtain. In fact, ship-based and pro-filer CTD data are complementary and should be used jointly to study the water mass properties of a sea area. Thanks to the relatively easy deployments from research vessels and ships of opportunity, the MedArgo profilers sampled most areas of the Mediterranean.
The MedArgo T and S data will be used in an upcoming paper to characterise the thermohaline properties throughout
the Mediterranean, and to compare them to climatological values. In the meantime, the MedArgo data in the western basin, including the pre-TOP (September–November 2003) and the TOP (June 2004–February 2006) profiles, were al-ready used by Emelianov et al. (2006) to investigate the ther-mohaline structure of the LIW with a clustering method. The trajectories of the MedArgo profilers, and in particular their subsurface displacements, were assimilated in a numerical circulation model in the northwestern Mediterranean by Tail-landier et al. (2006) to test the importance of these data for operational forecasting systems. Significant impact of the assimilation was found on the large scale circulation of the basin.
It is recommended to use the MedArgo cycling charac-teristics, i.e., 5-day cycle length, 350-m parking depth, and 700 m (2000 m every ten cycles) maximum profiling depth, for the permanent implementation of a Mediterranean Argo program as part of the operational Mediterranean Opera-tional Oceanography Network (MOON) program. In order to avoid data loss and decrease the surfacing time to a few hours (and eventually transmit full CTD profiles sampled with 1-m vertical resolution) it is crucial to use the MedArgo cycling bi-directional telemetry or satellite-based cellular phone net-works (such as Iridium, Orbcomm or Globalstar). It is hoped that future funding will be secured at national and EU lev-els so as to maintain a permanent array of 20–30 profilers by releasing 10–20 units per year. A total of 20–30 profilers in the Mediterranean corresponds approximately to the Argo targeted density of one profiler in each 3◦×3◦bin.
Acknowledgements. MedArgo was supported by the European
Commission (V Framework Program – Energy, Environment and Sustainable Development) as part of the MFSTEP project (contract number EVK3-CT-2002-00075). We wish to thank all the scientists, captains and crew members for their skilled and enthusiastic assistance with the profiler deployments. In particular, we are grateful to F. Bignami and L. Santoleri for the releases from R/V Urania, and to M. Emelianov and A. Juli`a for the deployments off Spain. Thanks to G. Constantini, R. Gerin, G. Notarstefano and L. Ursella for their help with the deployment logistics and with the data processing, and to the two anonymous reviewers for their constructive comments.
Edited by: N. Pinardi
References
Blanke, B. and Raynaud, S.: Kinematics of the Pacific Equatorial Undercurrent: an Eulerian and Lagrangian approach from GCM resuts, J. Phys. Oceanogr., 27, 1038–1053, 1997.
Davis, R. E., Webb, D. C., Regier, L. A., and Dufour J.: The Au-tonomous Lagrangian Circulation Explorer (ALACE), J. Atmos. Ocean. Tech., 9, 264–285, 1992.
Dobricic, S., Pinardi, N., Adani, M., Tonani, M., Fratianni, C., Bonazzi, A., and Fernandez, V.: Daily oceanographic analy-ses by the Mediterranean basin scale assimilation system, Ocean
Sci., 3, 149–157, 2007,
http://www.ocean-sci.net/3/149/2007/.
Emelianov, M., Font, J., Turiel, A., Millot, C., Sol´e., J., Poulain, P.-M., Juli`a, A., and Vitri`a, M. R.: Transformation of Levantine Intermediate Water tracked by MEDARGO floats in the Western Mediterranean, Ocean Sci., 2, 281–290, 2006,
http://www.ocean-sci.net/2/281/2006/.
Font, J., Emelianov, M., Juli`a, A., Puertas, J., and Lloret, M.: Subtask 4230 final report, MFSTEP deliverable WP4D7 (http: //poseidon.ogs.trieste.it/WP4/task4230/), 2003.
Gould, J. and the Argo Science Team: Argo profiling floats bring new era of in situ ocean observations, EOS Transactions, 85(19), 185–190, 2004.
Griffa, A. and Molcard, A.: Recommendations for the profiler cy-cle characteristics: Part A: Estimates of displacement and inter-mediate current errors for ARGO floats, using historical current measurements, MFSTEP deliverable WP4D2 (http://poseidon. ogs.trieste.it/WP4/pdf/WP4D2.pdf), 2003.
Loaec, G., Cortes, N., Menzel, M., and Moliera, J.: PROVOR: a hydrographic profiler based on MARVOR technology, IEEE-Oceans’98, September 1998, 1998.
Loaec, G, Carval, T., Le Reste, S., and Maudire, G.: Provor and Coriolis Data Center: a step towards operational oceanography, Data Buoy Conference Panel Workshop, 1999.
Le Bras, S. and Poulain, P.-M.: Subtask 4240 final report, MF-STEP deliverable WP4D8 (http://poseidon.ogs.trieste.it/WP4/ pdf/WP4D8.pdf), 2004.
Lumpkin, R. and Pazos, M.: Measuring surface currents with SVP drifters: the instrument, its data and some results., in: Lagrangian Analysis and Prediction of Coastal and Ocean Dynamics, edited by: Griffa, A. et al., Cambridge Univ. Press, 39–67, 2007. Manzella, G., Reseghetti, F., Coppini, G., Borghini, M., Cruzado,
A., Galli, C., Gertman, I., Gervais, T., Hayes, D., Millot, C., Murashkovsky, A., ¨Ozsoy, E., Tziavos, C., Vel´asquez, Z., and Zodiatis, G.: The improvements of the ships of opportunity pro-gram in MFSTEP, Ocean Sci., 3, 245–258, 2007,
http://www.ocean-sci.net/3/245/2007/.
Molcard A., Piterbarg, L. I., Griffa, A., Ozgokmen, T. M., and Mari-ano, A. J.: Assimilation of drifter observations for the reconstruc-tion of the Eulerian circulareconstruc-tion field, J. Geophys. Res., 108(C3), 3056, doi:10.1029/2001JC001240, 2003.
Ollitrault, M. G., Loaec, G., and Dumortier, C.: MARVOR: A multi-cycle RAFOS float. Sea-Technology, 35(2), 39–40, 43–44, 1994.
Pinardi, N., Allen, I., Demirov, E., De Mey, P., Korres, G., Las-caratos, A., Le Traon, P.-Y., Maillard, C., Manzella, G., and Tziavos, C.: The Mediterranean ocean forecasting system: first phase of implementation (1998–2001), Ann. Geophys., 21, 3–20, 2003,
http://www.ann-geophys.net/21/3/2003/.
Pizzigalli, C. and Ruolo, V. : Simulations of ARGO profilers and of surface floating objects: applications in MFSTEP, Ocean Sci., 3, 205–222, 2007,
http://www.ocean-sci.net/3/205/2007/.
Poulain, P.-M.: Adriatic Sea surface circulation as derived from drifter data between 1990 and 1999, J. Mar. Syst., 29, 3–32, 2001.
Poulain, P.-M.: MEDARGO: A profiling Float program in the Mediterranean, Argonautics, 6, p. 2, 2005.
Poulain, P.-M. and Zanasca, P.: Drifter and float observations in the Adriatic Sea (1994–1996) – Data report, SACLANTCEN Mem-orandum, SM-340, SACLANT Undersea Research Centre, La Spezia, Italy, 46 pp., 1998.
Poulain, P.-M., Mauri, E., and Zanasca, P.: Upper thermal structure and intermediate currents in the Adriatic and Northern Ionian as measured by a Lagrangian profiler in 1995 and 1996, Bollettino di Geofisica Teorica ed Applicata, 44(2), 139–154, 2003. Poulain, P.-M., Font, J., and Le Bras, S.: Preliminary results of
MEDARGO: A European profiling float program in the Mediter-ranean, Rapp. Comm. Int. Mer M´edit., 37, 135, 2004a.
Poulain, P.-M., Ursella, L., and Barbanti, R.: Assessment of APEX float tests in the Catalan Sea, OGS Technical Report, 23-2004-OGA-5, OGS, Trieste, Italy, 27 pp., 2004b.
Poulain, P.-M., Taupier-Letage, I., Gerin, R., Barbanti, R., Deponte, D., and Notarstefano, G.: Oceanographic Cruise EGITTO-1 R/V OGS – EXPLORA, 11–18 November 2005 Trieste, Italy to Port Said, Egypt, Cruise Report, OGS Technical Report 29-2006-OGA-14, OGS, Trieste, Italy, 2006.
Poulain, P.-M. and Zambianchi, E.: Near-surface circulation in the central Mediterranean Sea as deduced from Lagrangian drifters in the 1990’s, Cont. Shelf Res., 27(7), 981–1001, 2007. Rupolo, W.: Task 4120: Intermediate currents. MFSTEP
deliver-able WP4D2 (http://poseidon.ogs.trieste.it/WP4/pdf/TASK4120. pdf), 2003a.
Rupolo, W.: Task 4130: Temperature and salinity. MFSTEP deliver-able WP4D6 (http://poseidon.ogs.trieste.it/WP4/pdf/TASK4130. pdf), 2003b.
Salas, J., Garcia-Ladona, E., and Font, J.: Statistical analysis of the surface circulation in the Algerian Current using Lagrangian buoys, J. Mar. Syst., 29, 69–85, 2001.
Smith, W. H. F. and Sandwell, D. T.: Global sea floor topogra-phy from satellite altimetry and ship depth soundings, Science, 277(5334), 1956–1962, 1997.
Taillandier, V., Griffa, A., Poulain, P.-M., and B´eranger, K.: Assim-ilation of Argo float positions in the north western Mediterranean Sea and impact on ocean circulation simulations, Geophys. Res. Lett., 33, L11604, doi:10.1029/2005GL025552, 2006.
Testor, P. and Gascard., J.-C.: Large-scale spreading of deep wa-ters in the Western Mediterranean Sea by submesoscale coherent eddies, J. Phys. Oceanogr., 33, 75–87, 2003.
Testor, P. and Gascard, J.-C.: Large scale flow separation and mesoscale eddy formation in the Algerian Basin, Prog. Oceanogr., 66, 211–230, 2005.