En vue de l'obtention du
DOCTORAT DE L'UNIVERSITÉ DE TOULOUSE
Délivré par :Institut National Polytechnique de Toulouse (INP Toulouse) Discipline ou spécialité :
Génie des Procédés et de l'Environnement
Présentée et soutenue par :
M. NGOC TUAN LE le lundi 9 décembre 2013
Titre :
Unité de recherche : Ecole doctorale :
OPTIMISATION DE PRETRAITEMENT DES BOUES PAR ULTRASONS
DE FAIBLE PUISSANCE A HAUTE FREQUENCE SOUS PRESSION.
Mécanique, Energétique, Génie civil, Procédés (MEGeP)
Laboratoire de Génie Chimique (L.G.C.) Directeur(s) de Thèse :
M. HENRI DELMAS
MME CARINE JULCOUR-LEBIGUE Rapporteurs :
M. JEAN-YVES HIHN, UNIVERSITE DE BESANCON Mme EVELYNE GONZE, INRA UNIVERSITE DE SAVOIE
Membre(s) du jury :
1 M. IORDAN NIKOV, POLYTECH LILLE, Président
2 M. HENRI DELMAS, INP TOULOUSE, Membre
2 Mme CARINE JULCOUR-LEBIGUE, INP TOULOUSE, Membre
2 Mme HÉLÈNE CARRERE, INRA NARBONNE, Membre
2 M. PASCAL TIERCE, SINAPTEC, Membre
ACKNOWLEDGEMENTS
Apart from my efforts, the success of this work depends largely on the encouragement and guidelines of many others.
Foremost, I would like to express my sincere gratitude to my supervisors Prof. Henri DELMAS and Dr. Carine JULCOUR for the continuous support of my post-graduate work, for their patience, motivation, enthusiasm, and immense knowledge. Their guidance helped me in all the time of conducting the research and writing this thesis.
In addition, I would like to say a big thank you to the jury – Prof. Evelyne GONZE, Prof. Jean Yves HIHN, Prof. Helène Carrère, Prof. Iordan NIKOV, Mr. Pascal TIERCE, Dr. Xavier LEFEBVRE - for the precious time reading my thesis and valuable constructive comments. I would like to acknowledge the financial support from the Ministry of Education and Training of Vietnam and Institut National Polytechnique of Toulouse (France).
Besides, my sincere thanks also goes to Alexandrine BARTHE (Ginestous), Berthe RATSIMBA, Laurie BARTHE, Ignace COGHE, Jean-Louis LABAT, Jean-Louis NADALIN,
Lahcen FARHI (LGC), Bernard GALY, Christine REY-ROUCH, Marie-line PERN, Sylvie
SCHETRITE (SAP, LGC), Xavier LEFEBVRE, Anil SHEWANI, Beatriz MORENTE, Delphine DELAGNES (INSA), and SinapTec Company for their technical and analytical support.
I appreciate my friends: Ngoc Chau PHAM, Alain PHILIP, Fillipa VELICHKOVA, Imane, BENHAMED, Benjamin BOISSIERE, Supaporn KHANGKHAM, Nicholas BRODU, Benjamin BONFILS, and others for their help, encouragement, and insightful comments for the whole time we were working together, and for all the fun we have had in the last three years.
Last but not the least, I would like to thank my parents LE Ut and NGUYEN Thi Chit for giving birth to me and supporting me spiritually throughout my life, my brothers and sisters for encouraging me, and my sweet love for everything.
LIST OF NOMENCLATURES AND ABBREVIATIONS
Label Unit Definition
A m2 Surface area of the probe
AD Anaerobic Digestion
BMP Biochemical Methane Potential
BP 35 mm diameter probe (big probe)
c m/s Velocity of sound
CCOD g/L Colloidal Chemical Oxygen Demand
(concentration of supernatant liquid filtered between 0.2 μm and 1 μm pore size membrane)
COD Chemical oxygen demand
CST s Capillary Suction Time
D[4,3] µm Volume moment mean particle diameter
DDCOD % Disintegration degree of sludge based on COD if not mentioned
otherwise
DDCOD = (SCOD – SCOD0) / (SCODNaOH – SCOD0) * 100 (%)
DNA DeoxyriboNucleic Acid
DUS (k)W/L Ultrasonic density
DUS = PUS / V
EPS Extracellular Polymeric Substances
ES (k)J/kgTS Specific energy input / Energy per total solid weight
ES = (PUS * t) / (V * TS)
FS kHz Sound frequency
s-1 Shear rate
IUS (k)W/Im2 Ultrasonic intensity
K Pa.sn Consistency coefficient (Herschel–Bulkley model)
pp Pa.s Apparent viscosity (τ / γ)
n Flow behavior index (Herschel–Bulkley model)
OUR Oxygen Utilization/Uptake Rate
P bar (Pa) Pressure in the bubble at its maximum size
Pa bar (Pa) Acoustic pressure
Pa = PA sin 2 π FS t
PA bar (Pa) Maximum amplitude of acoustic pressure
PA = (2 * IUS* c * ρ)1/2
Ph bar (Pa) Hydrostatic pressure
Pm bar (Pa) Total solution pressure at the moment of transient collapse
PSD Particle Size Distribution
PUS (k)W Ultrasonic power input
PV bar (Pa) Vapour pressure of the liquid
ρ kg/m3 Density of the medium
RNA RiboNucleic Acid
SCOD g/L Soluble chemical oxygen demand in the supernatant after
treatment
(concentration of supernatant liquid filtered through 0.2 μm pore size membrane)
SCOD0 g/L Soluble chemical oxygen demand in the supernatant before
treatment
SCODNaOH g/L Soluble chemical oxygen demand after strong alkaline
disintegration of sludge
SP 13 mm diameter probe (small probe)
SRF m/kg Specific Resistance to Filtration
SS g/L Suspended Solids
SVS % Solubilisation yield of Volatile Solids
t min Sonication duration
Pa Shear stress
T °C Temperature
Pa Yield stress
TCOD g/L Total Chemical Oxygen Demand TDS g/L Total Dissolved Solids
TOC g/L Total organic carbon
TS g/L Total solids
US UltraSonication / UltraSound irradiation
V L Volume of sludge
VS g/L Volatile solids
WAS Waste Activated Sludge
TABLE OF CONTENTS
INTRODUCTION ... 1
CHAPTER 1 ... 3
LITERATURE REVIEW ... 3
1.1. SLUDGE TYPES AND PROPERTIES ... 4
1.2. BRIEF BACKGROUND OF SONICATION ... 5
1.3. EVALUATION APPROACHES OF SLUDGE ULTRASONIC PRETREATMENT EFFICIENCY ... ... 9
1.3.1. Physical change-based evaluation of sludge US pretreatment efficiency ... 12
1.3.1.1. Particle size reduction... 12
1.3.1.2. Sludge mass reduction or solubilisation ... 13
1.3.1.3. Dewaterability of sludge ... 14
1.3.1.4. Settleability and Turbidity of sludge ... 15
1.3.1.5. Microscopic examination of sludge ... 16
1.3.2. Chemical change-based evaluation of sludge US pretreatment efficiency ... 16
1.3.2.1. Degree of disintegration (DDCOD) ... 17
1.3.2.2. Nucleic acid assessment ... 17
1.3.2.3. Protein assessment ... 18
1.3.2.4. The release of ammonia and soluble organic nitrogen assessment ... 18
1.3.2.5. TOC assessment ... 19
1.3.3. Biological change-based evaluation of sludge ultrasonic pretreatment efficiency ... 19
1.4. OPTIMIZATION OF ULTRASONIC PRETREATMENT OF SLUDGE ... 22
1.4.1. Ultrasonic frequency ... 22 1.4.2. Temperature ... 23 1.4.3. Hydrostatic Pressure ... 24 1.4.4. Energy aspects ... 26 1.4.4.1. Ultrasonic power ... 26 1.4.4.2. Ultrasonic intensity ... 27
1.4.4.3. Ultrasonic duration and specific energy input ... 28
1.4.5. Sludge type, and total solid concentration of sludge ... 28
1.5. CONCLUSIONS ... 30 CHAPTER 2 ... 31 RESEARCH METHODOLOGY... 31 2.1. INTRODUCTION ... 31 2.2. SLUDGE SAMPLES ... 33 2.3. SONICATION APPARATUS ... 37 2.4. ANALYTICAL METHODS ... 41
2.4.1 Total solids (TS) and Volatile solids (VS) ... 41
2.4.2 Chemical oxygen demand (COD) and the degree of sludge disintegration (DDCOD) ... 42
2.4.3. Laser diffraction sizing analysis ... 44
2.4.4. Microscope examination ... 45
2.4.5. Biochemical methane potential (BMP) ... 46
2.4.6. Rheology ... 47
CHAPTER 3 ... 51
PRELIMINARY STUDY OF OPERATION PARAMETERS ... 51
3.1. MATERIALS AND EXPERIMENTAL PROCEDURES ... 51
3.1.1. Sludge samples ... 51
3.1.2. Experimental procedures ... 54
3.2. RESULTS AND DISCUSSION ... 54
3.2.1. DDCOD evolution ... 54
3.2.1.1. Effect of TS concentration ... 55
3.2.1.2. Effect of stirrer speed ... 56
3.2.1.3. Effect of temperature rise under “adiabatic” conditions (without cooling) ... 57
3.2.1.4. Effect of sludge type ... 59
3.2.1.5. Effect of alkaline addition prior to sonication ... 61
3.2.2. Particle size reduction and evolution of sludge structures ... 64
3.2.2.1 Analysis of laser diffraction measurements ... 64
3.2.2.2 Analysis of sludge particle images ... 71
3.2.3. Apparent viscosity and rheological behavior ... 74
3.2.4 Solubilisation of organic fractions ... 76
3.3. CONCLUSIONS ... 78
EFFECT OF ULTRASOUND PARAMETERS ON SLUDGE PRETREATMENT BY
ISOTHERMAL SONICATION... 79
(POWER, INTENSITY, FREQUENCY) ... 79
4.1. MATERIALS AND EXPERIMENTAL PROCEDURES ... 80
4.1.1. Sludge samples ... 80
4.1.2. Experimental procedures ... 81
4.2. RESULTS AND DISCUSSION ... 82
4.2.1. Effect of PUS on sludge disintegration ... 82
4.2.2 Effect of IUS on sludge disintegration ... 85
4.2.3. Effect of frequency on the efficacy of sludge sonication ... 88
4.2.4. Effect of sequential isothermal sonication on sludge disintegration ... 90
4.3. CONCLUSIONS ... 92
CHAPTER 5 ... 94
EFFECT OF HYDROSTATIC PRESSURE ... 94
ON SLUDGE PRETREATMENT BY ISOTHERMAL SONICATION ... 94
5.1. MATERIALS AND EXPERIMENTAL PROCEDURES ... 95
5.1.1. Sludge samples ... 95
5.1.2. Experimental procedures ... 96
5.2. RESULTS AND DISCUSSION ... 97
5.2.1. Effect of hydrostatic pressure on DDCOD for different ES values and sludge types ... 97
5.2.2. Effect of US power and intensity on the optimal pressure and subsequent DDCOD... 100
5.2.3. Effect of very low frequency on the optimum pressure and subsequent DDCOD ... 103
5.3. CONCLUSIONS ... 105
CHAPTER 6 ... 106
OPTIMAL SONICATION FOR PRETREATMENT OF SLUDGE ... 106
6.1. MATERIALS AND EXPERIMENTAL PROCEDURES ... 107
6.1.1. Sludge samples ... 107
6.1.2. Experimental procedures ... 108
6.2. RESUTLS AND DISCUSSION ... 108
6.2.1. Adiabatic sonication at atmospheric pressure ... 108
6.2.2. Optimal pressure under adiabatic sonication ... 112
6.2.4. Biochemical methane potential ... 116 6.3. CONCLUSIONS ... 117 CONCLUSIONS... 119 REFERENCES ... 121 APPENDICES ... 134 APPENDIX 1 ... 135 APPENDIX 2 ... 136 APPENDIX 3 ... 138 APPENDIX 4 ... 143 APPENDIX 5 ... 146 APPENDIX 6 ... 148 APPENDIX 7 ... 149 APPENDIX 8 ... 150
LIST OF TABLES
Table 1.1: Expressions of US energy for sludge disintegration ... 8
Table 1.2: Full scale US applications ... 10
Table 2.1: Characteristics of sludge samples from first sampling (Oct. 2011) ... 34
Table 2.2: Characteristics of mixed sludge from second sampling (Jan. 2012) ... 34
Table 2.3: Characteristics of secondary sludge from third sampling (Oct. 2012) ... 34
Table 2.4: Characteristics of secondary sludge from fourth sampling (Apr. 2013) ... 34
Table 2.5: Limitations of the equipment ... 40
Table 3.1: Characteristics of prepared samples from 1st sludge collection ... 52
Table 3.2: Characteristics of prepared sample from 2nd sludge collection (mixed sludge) ... 52
Table 3.3: Characteristics of prepared sample from 3rd sludge collection (secondary sludge) ... 53
Table 3.4: Characteristics of prepared sample from 4th sludge collection (secondary sludge) ... 53
Table 3.5: Alkaline pretreatment of mixed sludge (Table 3.2) at room temperature ... 62
Table 3.6: Size parameters of raw and pretreated sludge samples (see legend of Fig. 3.14) ... 73
Table 3.7: Morphological parameters of raw and pretreated sludge samples (see legend of Fig. 3.14) .... 74
Table 3.8: Apparent viscosity and parameters of Herschel-Bulkley model ... 75
Table 3.9: Solubilisation of organic fractions ... 76
Table 4.1: Characteristics of prepared sample from 3rd sludge collection (secondary sludge, recalled from Table 3.3) ... 80
Table 4.2: Characteristics of prepared sample from 4th sludge collection (secondary sludge, recalled from Table 3.4) ... 80
Table 4.3: Test parameters and levels ... 81
Table 5.1: Characteristics of prepared samples from 1st sludge collection (recalled from Table 3.1) ... 95
Table 5.2: Characteristics of prepared sample from 3rd sludge collection (secondary sludge, recalled from Table 3.3) ... 95
Table 5.3: Characteristics of prepared sample from 4th sludge collection (secondary sludge, recalled from Table 3.4) ... 96
Table 5.4: Amplitude of acoustic pressure corresponding to each PUS and probe size ... 97
Table 6.1: Characteristics of prepared sample from 3rd sludge collection (secondary sludge, recalled from Table 3.3) ... 107
Table 6.2: Characteristics of prepared sample from 4th sludge collection (secondary sludge, recalled from Table 3.4) ... 107
LIST OF FIGURES
Fig 1.1: Model of an activated sludge floc (Jorand et al., 1995) ... 5
Fig 1.2: Diagram of sonication range (Pilli et al., 2011) ... 5
Fig 1.3: Formation and collapse process of a cavity ... 7
Fig 1.4: Ultrasonic set-up (Kidak et al., 2009) ... 8
Fig 1.5: Integration of the US technology in WWTP (Ultrawaves GmbH - Water & Environmental Technologies) ... 9
Fig 1.6: Configurations of (a) Ultrawaves and (b) SonixTM reactor ... 11
Fig 1.7: Relationship between sludge microbial activity and disintegration degree during ultrasonic treatment (Li et al., 2009) ... 20
Fig 2.1: Outline of research plan ... 32
Fig 2.2: Sampling points at Ginestous WWTP ... 33
Fig 2.3: Photos of sludge samples: ... 34
Fig 2.4: High pressure US reactor set-up... 37
Fig 2.5: (a) Closed and (b) opened cup-horn autoclave reactor ... 38
Fig 2.6: Photos of the sonication devices: (1) 20 kHz, (2) 12 kHz, (3) 35 mm diameter probe, (4) 13 mm diameter probe. ... 39
Fig 2.7: NABERTHERM 30-3000 P330 furnace... 42
Fig 2.8: Equipment for COD measurement: (a) COD reactor, (b) Hach spectrophotometer ... 43
Fig 2.9: Malvern particle size analyzer (Mastersizer 2000, Malvern Inc.)... 45
Fig 2.10: Morphologi G3 equipment ... 46
Fig 2.11: Equipment for BMP tests: (a) sealed Pyrex bottle with sampling tube, (b) Heraeus oven, (c) 5890 series II gas chromatograph ... 47
Fig 2.12: Flow curves of different fluids: (a) power law fluids, (b) Bingham plastic fluid ... 48
Fig 2.13: Rheometer AR 2000 (TA Instruments) ... 49
Fig 2.14: Rheological behavior of raw secondary sludge by Herschel–Bulkley model ... 50
Fig 3.1: Effect of TS content on mixed sludge disintegration (DDCOD) vs. ES: PUS = 150 W, BP, FS = 20 kHz, TS = 28 g/L (other properties in Table 3.1), adiabatic condition, and atmospheric pressure ... 55
Fig 3.2: Effect of stirrer speed on time-evolution of mixed sludge disintegration PUS = 150 W, BP, FS = 20 kHz, TS = 28 g/L (other properties in Table 3.1), T = 28±2°C, and atmospheric pressure ... 56
Fig 3.3: Effect of temperature profile* on time-evolution of sludge disintegration (DDCOD): PUS = 150 W, BP, FS = 20 kHz, TS = 28 g/L, and atmospheric pressure. (a) Synthetic mixed sludge (Table 3.1), (b)
synthetic secondary sludge (Table 3.3). ... 58 Fig 3.4: Effect of ES on US pretreatment efficacy of different sludge types (DDCOD based on SCODNaOH): PUS = 150 W, BP, FS = 20 kHz, TS = 14 g/L (other properties in Table 3.1), and atmospheric pressure. (a) T = 28±2°C and (b) adiabatic condition ... 60
Fig 3.5: Effect of ES on US pretreatment efficacy of different sludge types with DDCOD based on TCOD*: PUS = 150 W, BP, FS = 20 kHz, TS = 14 g/L (other properties in Table 3.1), and atmospheric pressure. (a) T = 28±2°C and (b) adiabatic condition. ... 61
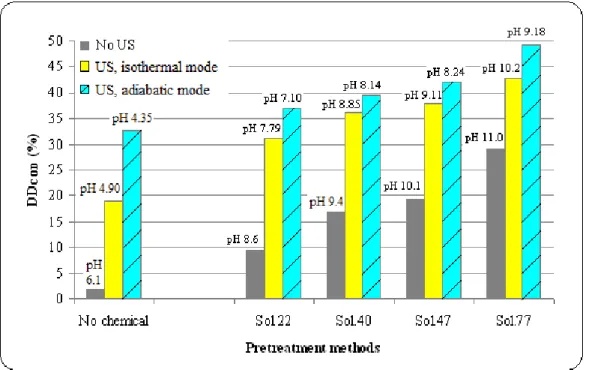
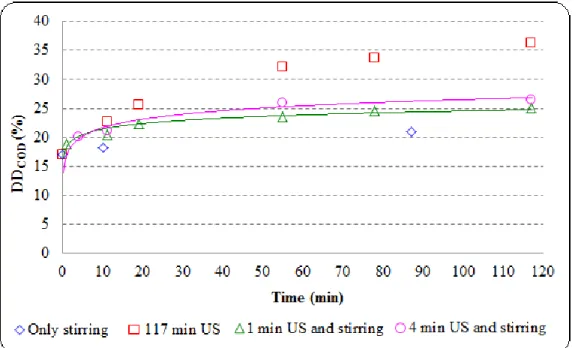
Fig 3.6: Comparison of different methods for mixed sludge disintegration (TS = 28 g/L, other properties in Table 3.2): FS = 20 kHz, PUS = 150 W, BP, sonication duration = 117 min, NaOH dose = 0-77
mgNaOH/gTS (holding time = 30 min), and atmospheric pressure. Final pH value after treatment is also indicated on top of each corresponding bar ... 63 Fig 3.7: Mean particle (D[4,3]) size evolution of different types of sludge during US pretreatment: PUS =
150 W, BP, FS = 20 kHz, TS = 28 g/L (other properties in Table 3.1), and T = 28±2°C, atmospheric
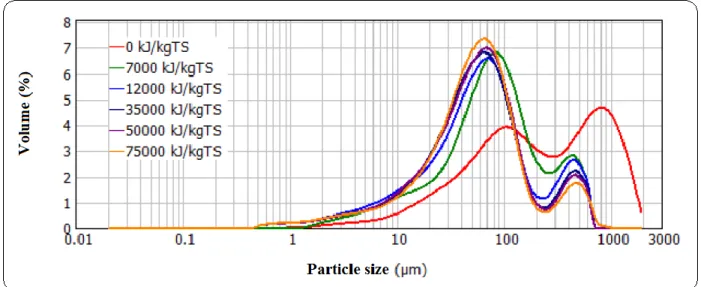
pressure ... 64 Fig 3.8: Evolution of particle size distribution of mixed sludge during US pretreatment: PUS = 150 W, BP, FS = 20 kHz, TS = 28 g/L (other properties in Table 3.1), T = 28±2°C, and atmospheric pressure ... 65
Fig 3.9: Mean particle size (D[4,3]) evolution of mixed sludge during the early stage of (alkali-) US pretreatment: PUS = 150 W, BP, FS = 20 kHz, TS = 28 g/L (other properties in Table 3.2), T = 28±2°C,
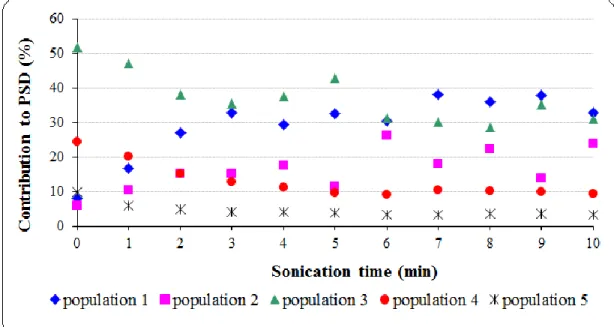
and atmospheric pressure ... 66 Fig 3.10: Deconvolution of PSD of raw mixed sludge (Table 3.2) ... 67 Fig 3.11: Evolution of PSD of mixed sludge during short sonication: (a) contribution of each population to PSD, (b) mean diameter of the populations (PUS = 150 W, BP, FS = 20 kHz, TS = 28 g/L (other
properties in Table 3.2), T = 28±2°C, and atmospheric pressure) ... 68 Fig 3.12: Evolution of PSD of mixed sludge during short sonication after NaOH addition (40 mgNaOH/gTS): (a) contribution of each population to PSD, (b) mean diameter of the populations (PUS = 150 W, BP, FS =
20 kHz, TS = 28 g/L (other properties in Table 3.2), T = 28±2°C, and atmospheric pressure) ... 69 Fig 3.13: Effect of short sonication time on mixed sludge disintegration: PUS = 150 W, BP, FS = 20 kHz, TS = 28 g/L (other properties in Table 3.2), T = 28±2°C, and atmospheric pressure. ... 71
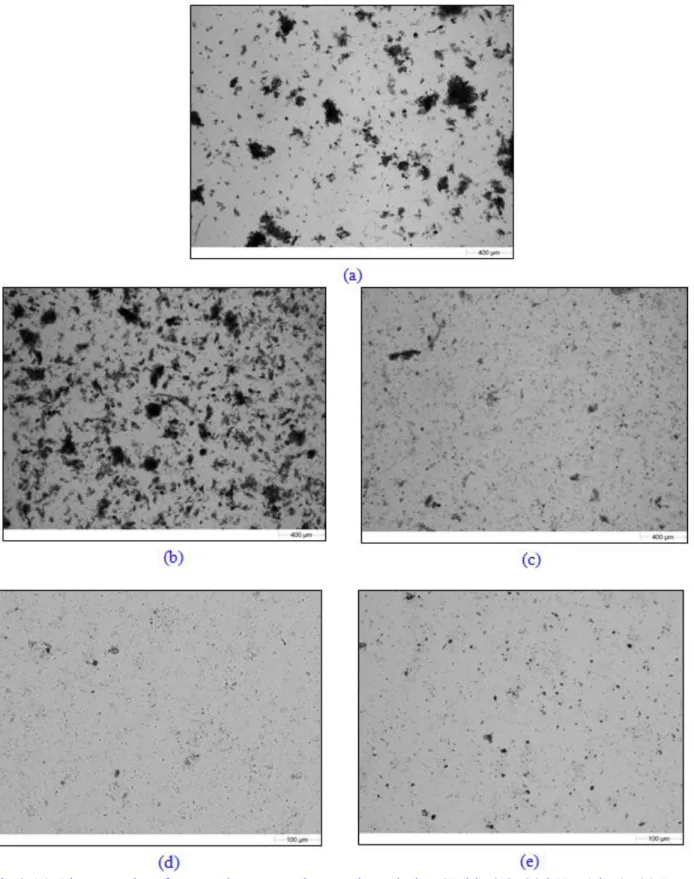
Fig 3.14: Photographs of raw and pretreated secondary sludge (Table 3.3, 20 kHz, 1 bar): (a) Raw sludge after defrosting (2.5), (b) after 78 min of thermal hydrolysis up to 80oC (2.5), (c) after 5 min of US (150 W) + 73 min of thermal hydrolysis up to 80oC (2.5), (d) after 78 min of adiabatic US (150 W) + 162 min of stirring (10), (e) after 117 min of isothermal US 150 W (10) ... 72 Fig 3.15: Apparent viscosity versus shear rate curves for raw and sonicated secondary sludge: PUS = 360
W, BP, FS = 20 kHz, TS = 28 g/L (other properties in Table 3.4), T = 28±2°C, and atmospheric pressure75
Fig 3.16: Effect of ES on SCOD/TCOD and CCOD/TCOD during US: PUS = 360 W, BP, FS = 20 kHz,
secondary sludge with TS = 28 g/L (other properties in Table 3.4), T = 28±2°C, and atmospheric pressure ... 77
Fig 4.1: Effect of ES and PUS on DDCOD: 20 kHz, TS = 28 g/L, T = 28±2°C, and atmospheric pressure: (a) SP, secondary sludge (Table 4.1). (b) BP, secondary sludge (Table 4.1). (c) BP, mixed sludge (Table 3.1),
―limited PUS‖ generator (max.150 W) ... 83
Fig 4.2: Evolution of secondary sludge mean particle size as a function of (a) high ES, (b) low ES and (c) sonication time using different PUS and probe sizes: 20 kHz, T = 28±2°C, and atmospheric pressure ... 85
Fig 4.3: Comparison of IUS (same PUS of 50W) and PUS (same probe) effects on DDCOD at different ES: TS
= 28 g/L, T = 28±2°C, and atmospheric pressure. (a) 20 kHz, secondary sludge (Table 4.1). (b) 12 kHz, secondary sludge (Table 4.2) ... 86 Fig 4.4: Effect of IUS (by changing PUS and sludge V proportionally with the same probe) on DDCOD at different ES: 20 kHz, BP, DUS = 300 W/L, TS = 28 g/L (Table 4.2), T = 28±2°C, and atmospheric pressure. ... 87 Fig 4.5: Effect of ES and sound frequency on sludge disintegration (DDCOD): BP, TS = 28 g/L, T = 28±2°C, and atmospheric pressure. (a) Secondary sludge given in Table 4.1. (b) Secondary sludge given in Table 4.2. ... 89 Fig 4. 6: Mean particle size reduction under sonication at different FS: PUS = 360 W, BP, TS = 28 g/L (Table 4.2), T = 28±2°C, and atmospheric pressure... 90 Fig 4.7: Effect of isothermal sequential sonication on sludge disintegration: SP, ES = 35000 kJ/kgTS, 12 kHz, T = 28±2°C, and atmospheric pressure ... 91 Fig 4.8: Effect of isothermal sequential sonication on sludge disintegration: BP, ES = 35000 kJ/kgTS, 12 kHz, 1 and 3.25 bar of pressure ... 92 Fig 5.1: Effect of hydrostatic pressure on mixed sludge disintegration (DDCOD) for different final ES
values: PUS = 150 W, BP, FS = 20 kHz, TS = 28 g/L (Table 5.1), and T = 28±2°C. ... 98
Fig 5.2: Effect of hydrostatic pressure on secondary sludge disintegration (DDCOD): PUS = 150 W, BP, ES
= 75000 kJ/kgTS, FS = 20 kHz, TS = 28 g/L (Table 5.1), and T = 28±2°C ... 99
Fig 5.3: Mean particle size evolution of different sludge type during US pretreatment (based on D[4,3]):
BP, PUS = 150 W, FS = 20 kHz, TS = 28 g/L (Table 5.1), and T = 28±2°C ... 99
Fig 5.4: Effect of hydrostatic pressure on DDCOD of secondary sludge for different PUS and probe sizes (FS
= 20 kHz, ES = 50000 kJ/kgTS, T = 28°C - Table 5.2, and TS = 28 g/L): (a) 35 mm diameter probe (BP), (b) 13 mm diameter probe (SP) and BP at same PUS ... 100
Fig 5.5: Disintegration degree of secondary sludge as a function of ES at the optimal pressures of each configuration (PUS, probe size): FS = 20 kHz, TS = 28 g/L - Table 5.2, and T = 28±2°C ... 101
Fig 5.6: Effect of ES, US intensity (at same PUS) and pressure on secondary sludge disintegration: FS = 20
kHz, TS = 28 g/L - Table 5.2, and T = 28±2°C ... 102 Fig 5.7: Effect of hydrostatic pressure on DDCOD of secondary sludge for different PUS: BP, ES = 35000
kJ/kgTS, FS = 12 kHz, TS = 28 g/L (Table 5.3), and T = 28°±2C ... 103
Fig 5.8: Effect of ES and frequency on secondary sludge disintegration under optimum pressure (3.25 bar): PUS = 360 W, BP, T = 28°C, and TS = 28 g/L... 104
Fig 6.1: Effect of ES and PUS on DDCOD under adiabatic sonication (FS = 20 kHz, secondary sludge
solutions with TS = 28 g/L - Table 6.1, atmospheric pressure): (a) SP and (b) BP. Final temperatures of adiabatic US are also given ... 109 Fig 6.2: Temperature evolutions for experiments with BP using ―adiabatic‖ US at ES = 50000 kJ/kgTS and stirring afterwards up to 240 min: FS = 20 kHz, secondary sludge solutions with TS = 28 g/L (Table
6.1), atmospheric pressure ... Error! Bookmark not defined. Fig 6.3: Effect of ES and PUS on DDCOD under adiabatic US followed by stirring up to 240 min (same
conditions as in Fig. 6.2) ... 111 Fig 6.4: Effect of pressure on DDCOD under adiabatic sonication for different combinations of PUS-probe
sizes: ES = 50000 kJ/kgTS, FS = 20 kHz, secondary sludge solutions with TS = 28 g/L (Table 6.1).. Error!
Bookmark not defined.
Fig 6.5: Comparison of continuous and sequential sludge US disintegration at different pressures under adiabatic conditions: BP, ES = 35000 kJ/kgTS, FS = 12 kHz, secondary sludge solutions with TS = 28 g/L
(Table 6.2) ... 114 Fig 6.6: Temperature evolutions of sequential sonication (same conditions as in Fig. 6.5) ... 115 Fig 6.7: BMP of pretreated sludge samples ... 116
1
INTRODUCTION
1. BACKGROUND OF THE PROBLEMThe activated sludge process is the most widely used biological treatment for eliminating organic and nitrogen pollutants in domestic wastewater. At the end of the process, a large amount of excess bacterial biomass (sludge) needs to be treated, e.g. more than a million tons of dry matter per year in France. Therefore, sludge management is a major issue as it represents about 50-60% of the total expense of wastewater treatment plants (WWTP) (Nowak, 2006; Banu et al., 2009). Incineration, ocean discharge, land spreading, and composting are the most common sludge disposal options used over the years, but no longer sustainable due to economic reasons or negative impacts on environment. Therefore, anaerobic digestion (AD) has been applied as an efficient and sustainable technology thanks to mass reduction, odor removal, pathogen decrease, less energy use, and energy recovery in the form of methane (CH4). However, the first stage of
AD process, hydrolysis, is the rate-limiting step of microbial conversion and requires a
pretreatment that ruptures cell walls and facilitates the release of intracellular matters into the aqueous phase.
There are some very popular techniques applied in sludge pretreatment, e.g. biological (aerobic and anaerobic processes), mechanical (US pretreatment, lysis-centrifuge, liquid shear, grinding, etc.), chemical (oxidation, alkali, acidic pretreatment, etc.), electrical methods, and thermal hydrolysis (>100oC) (Carrère et al., 2010).
Pilli et al. (2011) reported in their review that ultrasonication (US) is a feasible and promising mechanical disruption technique for sludge disintegration and microorganism lysis, with improvement in sludge biodegradability (Khanal et al., 2007), increase in methane production (Onyeche et al., 2002; Barber, 2005; Khanal et al., 2007), no need for chemical additives (Mao
et al., 2004), less sludge retention time (Tiehm et al., 1997), and sludge reduction (Onyeche et al., 2002).
Many studies aiming at optimization of US efficiency have been conducted. However, there is lack of researches on the individual and integrated effects of some key US parameters as well as external conditions of sludge pretreatment, i.e. process conditions (stirrer speed, temperature, pressure), US parameters (power -PUS, intensity -IUS, specific energy input ES, and frequency
-FS), and sludge characteristics (sludge type, total solids TS concentration, sludge pH). The
2
of sludge, and especially to emphasize for the first time the effects of hydrostatic pressure and frequency –down to audible range- which are expected to enhance sludge disintegration, to save energy input, and to facilitate the anaerobic digestion. Sludge ultrasonic pretreatment is generally assessed mainly based on disintegration degree (or solubilisation yield of chemical oxygen demand). Here we also add examination of particle size reduction, morphology changes, and the evolution of sludge viscosity.
2. ORGANIZATION OF THE STUDY
The Introductionpresents the background of the environmental problem due to sludge massive production, and the potential use of ultrasound as sludge pretreatment. Literature review is discussed in details in Chapter 1. In this chapter, sludge type is depicted first. Researches in sludge US pretreatment field are collected and displayed in three main sections: brief background of US pretreatment of sludge, approaches to assess its efficiency, and optimization efforts in literature. Chapter 2 introduces Research methodology where outline of research plan, sludge samples, sonication apparatus, and analytical methods are detailed. Findings of this work are shown in the next chapters. Chapter 3 exhibits Preliminary study of operation parameters whereat effects of solid concentration, sludge type, sludge pH (alkaline addition), stirrer speed, and thermal effects are taken into consideration. In addition to COD solubilisation, the changes of particle size distribution, morphology, and viscosity are investigated. Effect of ultrasound
parameters on sludge disintegration is presented in Chapter 4, including US power, intensity,
and frequency. For the first time Effect of hydrostatic pressure is taken into account and reported in Chapter 5. This chapter aims at investigating the interaction between PUS, IUS, FS, and pressure and their effects on isothermal sludge pretreatment. Optimal sonication
pretreatment of sludge is described in Chapter 6. Optimum conditions of PUS, IUS, FS, T, pressure, TS, and sequential sonication are discussed. Long term AD runs of some pretreated sludge are also carried out to quantify the effects of US pretreatment.
3
CHAPTER 1
LITERATURE REVIEW
Incineration, ocean discharge, land application, and composting are the common ways used for sludge disposal over the years, but they are no longer sustainable due to high costs and/or negative impacts on the environment. Therefore, anaerobic digestion (AD) of sludge has been applied as an efficient and sustainable technology for sludge treatment, allowing mass reduction, odor removal, pathogen decrease, and energy recovery in the form of methane.
AD of sludge is a complex and slow process requiring high retention time to convert degradable
organic compounds to CH4 and CO2 in the absence of oxygen through four stages: hydrolysis, acidogenesis, acetogenesis, and methanogenesis. Hydrolysis is known as the rate-limiting step, in which the intracellular biopolymers solubilize and convert to lower molecular weight compounds. This low rate of microbial conversion requires a pretreatment of sludge which ruptures the cell wall and facilitates the release of intracellular matter into the aqueous phase to improve biodegradability and enhance AD.
There are some very popular techniques used in sludge pretreatment, such as biological, thermal, mechanical, chemical, and electrical methods. Biological treatment provides a moderately better performance over the mesophilic digestion with mild energy input. Mechanical methods (US pretreatment, lysis centrifugation, liquid shear disruption, grinding, etc.) also provide a moderate performance improvement with moderate electrical input. Meanwhile, thermal hydrolysis (>100oC) provides a significant increase in performance with a substantial thermal energy consumption. Chemical methods (oxidation, alkali, acidic pretreatment, etc.) are also applied in sludge pretreatment (Carrère et al., 2010). Recent studies have taken intense electric fields into account (Kopplow et al., 2004; Rittmann et al., 2008; Salerno et al., 2009; Keles et al., 2010; Mahmoud et al., 2010; Pham, 2011; Rynkiewicz, 2011).
In their review, Pilli et al. (2011) claimed ultrasonic irradiation (US) to be a feasible and promising mechanical disruption technique for sludge disintegration and microorganism lysis according to the treatment time and power, equating to specific energy input (ES). Some positive characteristics of this method are efficient sludge disintegration (Pilli et al., 2011), improvement in biodegradability and bio-solid quality (Khanal et al., 2007), increase in biogas/methane production (Onyeche et al., 2002; Barber et al., 2005; Khanal et al., 2007), no need for chemical
4
additives (Mao et al., 2004), less sludge retention time (Tiehm et al., 1997), and sludge reduction (Onyeche et al., 2002).
1.1. SLUDGE TYPES AND PROPERTIES
Primary sludge is produced through the mechanical wastewater treatment process. It occurs after the screen and the grit chamber and contains untreated wastewater contaminations. The sludge amassing at the bottom of the primary clarifier is also called primary sludge. It is decayable and must be stabilized before being disposed of (Liu and Liptak, 1999). The composition of this sludge depends on the characteristics of the collecting area. Primary sludge is easily biodegradable since it consists of more easily digestible carbohydrates and fats (faeces, vegetables, fruits, textiles, paper, etc.). Biogas therefore is more easily produced from primary sludge but the methane content of the gas is lower.
Activated sludge comes from the secondary wastewater treatment. In the secondary treatment, different types of bacteria and microorganisms biodegrade the organic matter and consume oxygen to live, grow and multiply. The resulting sludge from this process is called waste activated sludge (WAS). Normally, a part of the WAS is returned back to the system (called return activated sludge) and the remaining is removed at the bottom of the secondary clarifier (called excess sludge or secondary sludge). Overall, the sludge has the same properties, but different names regarding its usage. WAS consists largely of biological mass, i.e. proteins (30%), carbohydrates (40%) and lipids (30%) in particulate form (Lin et al., 1999), as well as large amount of pathogens. It causes odour problems and thus must be stabilized. Besides, activated sludge is more difficult to digest than primary sludge.
Activated sludge floc is a heterogeneous mixture of particles, microorganisms, colloids, organic polymers and cations whose composition depends on the origins (Forster 1976; Urbain et al., 1993). Flocs have three structural levels (Fig. 1.1): microflocs, which are primarily particles of 2.5 μm in size, secondary particles (13 μm) linked together by exo-polymers and forming tertiary structures having a mean diameter of 125 μm (Jorand et al.,1995; Chu et al., 2001).
5
Fig 1.1: Model of an activated sludge floc (Jorand et al., 1995)
Digested sludge is the residual product after AD of primary and activated sludge. The digested sludge is reduced in mass, less odorous, and safer in the aspect of pathogens and easier dewatered than the primary and activated sludge types (Liu and Liptak, 1999).
1.2. BRIEF BACKGROUND OF SONICATION The diagram of sonication range is presented in Fig. 1.2
Fig 1.2: Diagram of sonication range (Pilli et al., 2011)
When an acoustic field is applied, the sonic vibrations create an acoustic pressure (Pa) which must be considered to be additional to the ambient hydrostatic pressure (Ph) already present in the medium:
Pa = PA sin 2 π FS t
where FS is the sound frequency and PA is the maximum pressure amplitude of the wave. The
6
I = PA 2 / (2 ρ c) = (ρ c / 2) (a ω)2
where ρ is the density of the medium, c is the velocity of sound in that medium, a is the amplitude (half the height difference between a peak and a trough), and ω is the angular frequency (= 2π FS).
When propagating in a solution, ultrasound waves generate compressions (they cause a positive pressure on the liquid by pushing molecules together) and rarefactions (they cause a negative pressure by pulling molecules one from each other). If a sufficiently large negative pressure is applied during rarefaction, acoustic cavitation will take place.
It is now clearly stated that most of ultrasound outstanding effects are due to acoustic cavitation. Acoustic cavitation is a very complex highly non-linear phenomenon which occurs at given acoustic pressure conditions (needing rather high ultrasound intensity, > 1 W/cm2 in water at room conditions). Micro-bubbles are generated from nuclei -favored by dissolved gas, wall defects, and liquid impurities- during the low pressure half periods (bubble formation and expansion). They may oscillate a few periods, undergoing a slow average growth due to the so called ―rectified diffusion‖ process (up to several µm) and suddenly, reaching a critical size, they dramatically grow during the low pressure half period and collapse violently in a very short fraction of the high pressure half period. Most often the bubble breaks up after the collapse point, giving smaller bubbles ready to reproduce the same scenario: oscillatory growth, driven by rectified diffusion, then sudden collapse (as schematized on Fig. 1.3). Such a fast collapse being nearly adiabatic gives rise to extreme conditions inside and around the collapsing bubble.
Theoretical considerations byNoltingk and Neppiras (1950), Flynn (1964),Neppiras (1980),and Lorimer and Mason(1987),assuming adiabatic collapse of the bubbles, allow for the calculation of the maximal temperature (Tmax) and pressure (Pmax) within the bubble at the end of collapse (bubble rebound):
where T is the ambient temperature, γ is the ratio of the specific heats of gas (or gas vapour) mixture, P is the pressure in the bubble at its maximum size and is usually assumed to be equal
7
to the vapour pressure (PV) of the liquid. Pm is total solution pressure at the moment of transient collapse (Pm = Ph + Pa).
Such models and experimental validations suggest that final collapse leads to a temperature as high as 5000 K at the bubble center, a pressure of 500 bar, and a high radial velocity -up to the sound speed- then shock waves at the bubble rebound. These cavitation characteristics have different impacts on the sonicated media: high temperature peaks produce very active free radicals (mainly OH in aqueous media), giving the way to intense radical chemistry either inside or at the interface of the cavitation bubble depending on the volatility of the target dissolved molecules. On the other hand, high pressure, high velocity gradients, and shock waves have mainly physical effects through very strong micro turbulence and intense local mixing, increasing heat and mass transfer. These physical effects are even more efficient in multiphase systems and especially on solid surfaces due to asymmetrical collapse with projection of a very fast jet towards the solid close to cavitation bubbles. This is the main cause of ultrasonic cleaning and also of most of ultrasonic solid processing, such as sludge disintegration.
Fig 1.3: Formation and collapse process of a cavity
When applied to solid suspension and especially for sludge treatment the power/energy may be expressed in many ways as given in Table 1.1: specific energy input ES, US dose, US density, and US intensity.
8
Table 1.1: Expressions of US energy for sludge disintegration No. Parameter Expression Unit Reference
1 Specific energy input ES = (PUS * t) / (V * TS) J/kgTS Feng et al., 2009
2 Ultrasonic dose DOUS = PUS * t / V J/L Tiehm et al., 2001
3 Ultrasonic density DUS = PUS / V W/L Tiehm et al., 2001
4 Ultrasonic intensity IUS = PUS / A W/cm2 Neis et al., 2000
PUS: power input (W), t: sonication duration (s), V: volume of sludge (L), TS: total solid concentration (kg/L), A: surface area of the probe (cm2)
The piezoelectric generator is one of the most common techniques for generating ultrasound.
This apparatus is comprised of three major parts: converter, booster, and horn (or probe). In the
converter (transducer), the piezoelectric ceramics is put in the electric fields with varying
polarity which causes changes in its dimension. These repeated changes create ultrasound of a specific frequency. The booster is designed to control (increase or decrease) the amplitude of the ultrasonic energy before it is delivered to the liquid through the horn (sonotrode). These three parts are stacked by clamping at the nodal points of either the converter or the booster. The horn, like the booster, also contributes to the amplification of the US; therefore the half or full wavelength design of the horn depends on the application of this apparatus. Furthermore, the design of the horn, enhanced by the power input levels, impacts on the intensity of the sonication, which indicates the magnitude of the ultrasonic motion, in other words, the amplitude of the vibration. An example of US set-up is presented in Fig. 1.4.
9
Wang et al. (2005) indicated that the mechanisms implied in US sludge disintegration are hydro-mechanical shear forces, oxidizing effect of OH, H, N, and O produced under US, and thermal decomposition of volatile hydrophobic substances in the sludge due to the increase in temperature during sonication. The effect of hydro-mechanical shear forces is nevertheless much higher than that of radicals.
1.3. EVALUATION APPROACHES OF SLUDGE ULTRASONIC PRETREATMENT EFFICIENCY
Ultrasonic irradiation (US) is a feasible and promising mechanical disruption technique for
sludge disintegration, biodegradation acceleration, and AD enhancement. Ultrasonic cell lysis was first studied at lab-scale in the 1960s, but it was initially found uneconomical due to limitations of the US equipment at that time (Roxburgh et al., 2006). In the last fifteen years, researches on US application for sludge disintegration have developed, as illustrated by the works of Chiu et al. (1997), Tiehm et al. (1997, 2001, 2002), Wang et al. (1999), Neis et al. (2000), Chu et al. (2002), Onyeche et al. (2002), Gonze et al. (2003), Bougrier et al. (2006), Cao
et al. (2006), Bragulia et al. (2006), etc. Advances in US technology in the last decade have
enabled commercial applications, especially for wastewater treatment. Fig. 1.5 depicts options for installation of US systems in WWTP (Ultrawaves GmbH - Water & Environmental Technologies).
Fig 1.5: Integration of the US technology in WWTP (Ultrawaves GmbH - Water & Environmental Technologies)
10
Ultrawaves and SonixTM, whose configurations were described in Fig. 1.6, have the largest
number of full-scale trials and full-scale installations in wastewater treatment, i.e. over 30 installations in Europe, the United States, Asia, and Australia. Ultrawaves is a commercial business born from the research activities at the Technical University of Hamburg-Harburg, has different trademarks such as Eimco Sonolyser, Dumo, Euro-open KFT, Sonoflux (sold by Stereau in France), etc. Sonix™ technology is supplied under licence from Sonico - a joint venture company between Purac Ltd and Atkins Water. Sonotronic Nagel is a worldwide provider and manufacturer of ultrasonic equipment serving a variety of industries for the last 30 years. Sonolyzer technology is the product of years of development between Ultrawaves and Sonotronic Nagel. For WAS pretreatment, US installations have been applied in many WWTP, especially in Germany, since 2000 with different capacities (Table 1.2). In general, US system has been operated at 20 kHz and PUS up to 48 kHz. According to Roxburgh et al., (2006), the largest installation is at Mangere WWTP in New Zealand, from Sonico.
Table 1.2: Full scale US applications WWTP Country Capacity
(PE) US system Application year Substrate / Stage Ref. 1 Heiligenstadt Germany 52 000 Ultrawaves (20 KHz, 5 generators, 5 kW/generator, V = 29 L) 2003 Return sludge (For Aerobic Stabilization - AS) Ultrawaves – Royce Water Technologies 2 Leinetal Germany 50 000 2003 3 Tanba City Japan 2004
4 Bamberg Germany 230 000 2004 Primary and Thickened WAS for AD Rossier et al. 2007; Ultrawaves – Royce Water Technologies 5 Meldorf Germany 70 000 2004 (For AD) 6 Zeist Netherlands 75 000 2005 7 Hennef Germany 65 000 2006 8 Kleinsteinbach Germany 40 000 2006 Ultrawaves – Royce Water Technologies 9 Marselisborg-Arhus Denmark 220 000 2006
10 Pecs Hungary 200 000 2006 Return sludge (For
AS)
11 Datansha China 550 000 2006
12 Bath England 550 000 2006 Rossier et al. 2007
13 Slupsk Germany 250 000 2007
14 Detmold Germany 95 000 DMS, 14 kW 2000 Mixed
sludge Rossier et al. 2007
15 Mannheim Germany 725 000 DMS, 24 kW 2001 Primary :
WAS = 1 : 1,
for AD Bartholomew 2002; Rossier
et al. 2007 16 Russelsheim Germany 80 000 DMS, 10 kW 2001 Mixed
sludge 17 Wiesbaden Germany 360 000 DMS, 48 kW 2002 Mixed sludge 18 Kavlinge Sweden 100 000 SonixTM, 3-6
kW 2002 WAS Rossier et al. 2007
19 Mangere New
Zealand 800 000 Sonix
TM 2005 WAS
11
21 Villach Austria 200 000 2003 2007
22 Eberstadt Germany 200 000 2003 Primary :
WAS = 1/3 :
2/3 23 Zemtralklarwerk
Darmstadt Germany 240 000 2004 24 Halle Nord Germany 300 000 2004 25 GroBostheim Germany 35 000 2004 26 Kitzbuhel Austria 46 500 2005 27 Winsen/Luhe Germany 50 000 2005 28 Penthaz Switzerland 10 000 2006 29 Obersee Germany 25 000 2006
30 Sud Germany 40 000 6 kW 2000 WAS for AD
Bartholomew 2002
31 Darmstadt Germany 180 000 16 kW 2000 Primary :
WAS = 1/3 :
2/3, for AD
(a)
(b)
12
Some achievements from Sonix™ (a high-power US system for conditioning sludge) have been reported. For instance, TS and VS reduction in digesters were 40% and 50%, respectively for untreated sludge and 60% and 70%, respectively for sonicated sludge (Hogan et al., 2004). Xie
et al. (2007) showed an increase in biogas production of 15-58% (average of 45%) in the
full-scale US installation for mixed sludge treatment. For the full-full-scale part-stream US plants in Germany, Austria, Switzerland, Italy, and Japan, biogas, VS reduction, and sludge dewaterability were increased by 20–50% (volume/kg fed), 20–50%, and 3–7%, respectively (Barber, 2005). It is clear that many processing factors significantly affect cavitation and consequently the efficiency of sludge pretreatment. Therefore, assessment, comparison, and selection of optimal ultrasonic conditions for actual application of sludge pretreatment are sorely necessary. An extensive review of approaches to evaluate sludge ultrasonic pretreatment efficiency is presented with regard to changes in:
- Physical properties: particle size, sludge mass and volume reduction, dewaterability,
settleability, turbidity, and microscopic examination.
- Chemical properties: increase in soluble chemical oxygen demand (SCOD), nucleic acids, proteins, polysaccharides, release of NH3, total organic carbon (TOC), etc.
- Biological properties: heterotrophic count and specific oxygen uptake rate.
1.3.1. Physical change-based evaluation of sludge US pretreatment efficiency 1.3.1.1. Particle size reduction
US pretreatment is very effective in reducing the particle size of sludge particles, which is
analyzed by different techniques: sieves, sedimentation, electric-ozone sensing, microscopy, and laser diffraction which is usually used. The efficiency of size reduction depends on US parameters (PUS, DUS, US duration, ES) and sludge characteristics.
The floc size reduction improves (sludge disintegration efficiency also improves) with the increase in both PUS and DUS(Show et al. 2007; Pilli et al., 2011), e.g. 60% and 73% at 2 W/mL and 4 W/mL, respectively (Mao et al., 2004). Chu et al. (2001) showed that after 40 min US at 0.11 W/mL, the architecture of flocs was basically the same as that of the raw sludge (although the floc structure became looser and some filamentous bacteria were exposed). Meanwhile, the structural integrity of flocs was almost completely broken down after 40 min US at 0.33 W/mL. Thereby, there is a critical PUS value beyond which the sludge flocs could be sufficiently disintegrated.
13
Besides, the particle size also reduces owing to the increase in US duration (Tiehm et al., 1997; Show et al., 2007), but beyond 10 min of sonication, the particle size can exhibit a reverse trend (Gonze et al., 2003) due to re-flocculation of the particles. However, this phenomenon was not recorded by Show et al. (2007) even after 20 min of sonication.
In terms of ES, 1000 kJ/kgTS may be the disruption threshold of usual flocs (Feng et al., 2009a). Following the increase in ES, US causes a decrease in particle size (Tiehm et al., 2001; Gonze et
al., 2003; Feng et al., 2009a). For example, the volume occupied by particles of less than 1 µm
increased from 0.1% in the raw sludge to 1.5% in the pretreated one at ES of 14550 kJ/kgTS (Bougrier et al., 2005). Mean particle size of sludge decreased from 33.8 µm to 10.1–13.3 µm when ES increase in the range of 0-15000 kJ/kgTS (El-Hadj et al., 2007).
Show et al. (2007), Na et al. (2007), and Pilli et al. (2011) agreed that flocs above 4.4 microns showed more disruption probability as they exhibit a larger surface area and less strong binding forces.
With regard to the sludge type, the particles of flocculated sludge in AD were reduced by more than 50% in size after US compared to those of raw sludge (Chu et al., 2002). Similarly, within 20 min of sonication, the disintegration was more significant in secondary sludge (85%) than in primary sludge (71%) because the former contains mostly biomass (microbial cells) whereas the latter mainly consists of settle-able solids (fibers and less degradable cellulosic material) (Mao et
al., 2004).
For sludge TS concentration,the size reduced more in lower TS sample. d50 of sludge with 2% TS
decreased by 6.5 fold at 0.67 W/mL. Higher TS concentrations (4% and 6%) required more DUS
(0.83 W/mL and 1.03 W/mL, respectively) to gain the same level of particle size reduction (Akin
et al., 2006).
In short, US pretreatment significantly decreases the particle size of sludge, especially in the very first period of sonication. Sludge particle size reduction is sometimes used to assess the degree of sludge disintegration.
1.3.1.2. Sludge mass reduction or solubilisation
The sludge mass reduction results mainly from solubilisation of the organic matters and is
usually measured by the decrease in the suspended solid (SS) concentration. During US (0–30 min, 0.5 W/mL, 9.945 gSS/L of raw sludge), SS reduction increase was almost linear with US duration, indicating the continuous and stable sludge floc disintegration, mass reduction, and cell
14
lysis (Zhang et al., 2007). This parameter was also presented as matter solubilisation in Bougrier
et al. (2006).
Apart from SS concentration, total dissolved solids also reflect the mass transfer from the solid into the aqueous phase. Feng et al. (2009a) proved the amount of soluble matters in the supernatant to be strongly affected by US, e.g. in ES range of 500-26000 kJ/kgTS, the increase in total dissolved solids was 3-46% as compared to untreated sludge.
Other parameters used to assess the sludge reduction, subsequently the efficiency of sludge US disintegration, were the solubilisation of total solids (STS) and of volatile solids (SVS). Salsabil et
al. (2009) observed that STS increased linearly with in ES (3600 - 108000 kJ/kgTS) and reached 14.7% at ESmax. Meanwhile, SVS initially increased fast in the ES range of 0-31500 kJ/kgTS (reaching 15.8 %) and then slowed down at higher ES values (reaching 23% at ESmax). The main purpose of sludge disintegration is to transfer organic matters from the solid to the aqueous phase. The increase in soluble organic compounds can be correlated with VS reduction (as both
COD and VS represent the organic matters of sludge). A higher SVS is important for eliminating/shortening the hydrolysis step of AD. In addition, increasing VS reduction directly improves methane production during AD. Therefore, SVS is comparatively more meaningful than
STS in terms of sludge disintegration (Salsabil et al., 2009; Erden and Filibeli, 2009).
1.3.1.3. Dewaterability of sludge
The capillary suction time (CST) and the specific resistance to filtration (SRF) tests (related to permeability) are both commonly used to estimate sludge dewaterability. Both tests are known to be empirically related but the SRF (based on an analysis of pressure drop for flow through a porous medium) is much more expensive and time consuming compared with the CST test. For
CST test, sludge is poured into a small open tube resting on a piece of filter paper. The capillary
suction pressure generated by the standard filter paper is used to extract water from the sludge. The rate at which water permeates through the filter paper varies, depending on the condition of the sludge and the filterability of the cake formed on the filter paper. The time taken for the water front to pass between these two electrodes (placed at a standard interval from the funnel) constitutes the CST.
Most authors agree with Gonze et al.(2003) that are two opposite effects of US on sludge dewaterability: positive for short time US (or low ES) then negative for longer US duration (higher ES).
15
Feng et al. (2009) found an increase of sludge dewaterability for an ES range of 0 - 2200 kJ/kgTS, but a decrease when ES exceeded 2200 kJ/kgTS, especially beyond 4400 kJ/kgTS.Li et al. (2009) indicated that when DDCOD was too low (<2%), floc structure exhibited a limited change and
sludge dewaterability was almost unchanged. When DDCOD was proper (2-5%), the incompact
sludge flocs can be disrupted to smaller fragments and then be re-flocculated to tighter particles with the help of conditioning agents, subsequently resulting in an improvement of sludge dewaterability. When DDCOD was high (>7%), sludge particle size was significantly decreased, a number of fine particles were then produced, leading to the deterioration of sludge dewaterability.
According to Chu et al. (2001), sludge dewaterability decreases gradually with an increase in US
duration because of the subsequent increase in small particles. After 5 min of sonication at 0.528 W/mL, Wang et al. (2006b) observed that SRF and CST increased from 1.67 x 10¹² m/kg and 82 s, respectively for raw sludge to 1.33 x 10¹⁴ m/kg and 344 s, respectively for pretreated sludge. They linked this phenomenon to floc structure disruption, cell lysis, and release of biopolymers from extracellular polymeric substances (EPS) and bacteria into aqueous phase.
The authors stated that sludge particles are disintegrated to smaller size with higher surface area causing adsorption of more water, thus slowing the release of water from sludge. Moreover, the release of EPS in the solutioncreates a thin layer on the surface of the filtrating membrane acting as a barrier against the water, consequently reducing sludge dewaterability (Chen et al., 2001; Houghton et al., 2002; Wang et al., 2006b; Feng et al., 2009b). It was proved that both EPS and particle size have effects on sludge dewaterability but the former is considered prevalent (Feng et
al., 2009b).
On the other hand, SRF and CST increase with the decrease in free water of the sludge, which means dewaterability shows a positive correlation with free water content. Nevertheless, despite
US transforms interstitial water retained by EPS and inside cells into free water, the negative
adsorption effectis predominant; thereby sludge dewaterability is deteriorated at high ES.
1.3.1.4. Settleability and Turbidity of sludge
Settling velocity is one of the most important settling parameters of sludge in routine process
control and plays an important role in controlling the excess sludge emission and sludge bulking (Feng et al., 2009a).
16
The settleability of sludge is not enhanced by US treatment (Chu et al., 2001). It is deteriorated when increasing ES due to the breakdown of flocs, decrease in particle size, and increase in EPS concentration in the liquid phase (Feng et al. 2009a).
On the contrary, the turbidity of sludge usually increases with ES due to particle size reduction (Tiehm et al., 2001) and subsequent release of micro-particles into supernatant, which settle very slowly (Feng et al. 2009a).
Sludge settleability and turbidity are rarely used individually, but combined with other parameters to evaluate the efficiency of sludge US pretreatment.
1.3.1.5. Microscopic examination of sludge
Microscope imaging displays sludge floc and cellular level before and after sonication, thus it can be used to evaluate the disintegration degree of sludge (Chu et al., 2001; Khanal et al., 2006).
US pretreatment reduces average size of flocs and creates a lot of separate cells and short
filaments pieces - Actinomyces (Dewil et al. 2006). Feng et al. (2009a) found that neither the floc structure nor the microbial cells were totally disintegrated, even at ES of 26000 kJ/kgTS (TS of 14.4 g/L), because there was still a network of filamentous bacteria in the photomicrographs of the treated sludge. Meanwhile, Chu et al. (2001) observed flocs and cell walls to be almost completely broken down after 40 min of US at 0.33 W/ml (PUS of 82.5 W, ES of 96100 kJ/kgTS,
TS of 8.3 g/L). This controversy may be due to different experimental conditions. It is therefore
clear that US has considerable effects on microbial disruption but the efficiency of the disruption should be presented enclosed with process parameters (PUS, ES, TS, etc.).
1.3.2. Chemical change-based evaluation of sludge US pretreatment efficiency
Chemical evaluation mainly focuses on sludge disintegration efficiency (Khanal et al., 2007), reflected by the degree of sludge disintegration (DDCOD) based on a chemical digestion reference. Besides, the ratio of soluble COD to total COD (SCOD/TCOD) is also used as it represents the release of organic matters from solid to liquid phase after US (TCOD being not significantly affected by US as oxidation remains very limited). Apart from SCOD, nucleic acids,
EPS, ammonium nitrogen, and total organic carbon (TOC) concentrations are also considered as
17 1.3.2.1. Degree of disintegration (DDCOD)
Both cellular/extracellular matter and organic debris/EPS of sludge are disintegrated by US, leading to the solubilisation of solid matters and the increase in organic matters/EPS concentrations in aqueous phase; thereby SCOD of sludge increases (Zhang et al., 2007). That is why the release of those components, especially SCOD can be used to assess sludge disintegration efficiency (Tiehm et al., 2001; Rai et al., 2004; Wang et al., 2006a; Nickel and Neis, 2007).
There are different approaches to determine DDCOD after US.
DDCOD = (SCODUS – SCOD0) / (SCODNaOH – SCOD0) * 100 (%)
(Li et al., 2009) where - SCODUS is supernatant COD of the sonicated sample (mg/L);
- SCOD0 is supernatant COD of original sample (mg/L);
- SCODNaOH is the COD release in the supernatant after NaOH digestion (the sludge sample being mixed with 0.5 M NaOH at room temperature for 24 h)
DDCOD = (SCODUS – SCOD0) / (TCOD - SCOD0) * 100 (%)
(Bougrier et al., 2006; Zhang et al., 2007) DDCOD = [(SCODUS – SCOD0)/ CODMax] * 100 (%) (Braguglia et al. 2008)
where; CODmax is COD of the reference sample after complete chemical solubilisation with
H2SO4.
It was proved that US sludge disintegration depends on various factors, such as FS, IUS, US duration, DUS, ES, temperature, TS, sludge type/properties, etc., among which US duration, ES,
TS, and temperature are the most important (Gronroos et al., 2005).
1.3.2.2. Nucleic acid assessment
Nucleic acids are biological molecules essential for life, and include deoxyribonucleic acid
(DNA) and ribonucleic acid (RNA). Together with proteins, nucleic acids make up the most important macromolecules. The increase in nucleic acid concentration represents cell lysis, thus it is also used to evaluate the efficiency of sludge US pretreatment.
18
Zhang et al. (2007) measured the concentration of nucleic acids after US treatment and found a linear relationship between cell lysis and DUS (0.1-1.5 W/mL for 30 min US) as well as sonication time (0-30 min US at 0.5 W/mL).
1.3.2.3. Protein assessment
Proteins are important building blocks of bacteria with many different functions in the living cell (they catalyze chemical and biochemical reactions in living cell and outside). It was found about 70–80% of the extracellular organic carbon contained in WAS to be in form of proteins and saccharides (Neyens et al., 2004).
Under US, the activated sludge is disintegrated, cells are ruptured, and consequently EPS and cellular substances are released into the aqueous phase, resulting in an increase in protein and polysaccharide levels. It can be inferred that the rise of soluble protein increases the AD efficiency (Saad et al., 2008), thus it was used to evaluate the efficacy of sludge US pretreatment (Akin et al., 2006; Wang et al., 2006a; 2006b). Besides, Ca2+ and Mg2+ play a key role in binding the EPS. Sonication first causes a fast increase in Ca2+ and Mg2+ concentrations in the aqueous phase, but then these concentrations decrease as the cations are adsorbed by smaller sludge particles formed during US (Wang et al., 2006a).
The amounts of proteins, polysaccharides, and DNA in the supernatant first increase fast when
US is applied (Feng et al., 2009a; 2009b). Then the release of proteins and polysaccharide slows
down when sludge is almost disintegrated, but DNA concentration drops due to temperature increase during US which would denature the DNA (Wang et al., 2006a). Among those components, protein is the most released due to large quantities of exoenzymes in the flocs: a ratio of protein to polysaccharide of about 5.4 was found by Feng et al. (2009a).
However, the protein measurement is not common and not yet well accepted for evaluating sludge ultrasonic disintegration efficiency. Therefore, COD measurement is preferred for this purpose due to its simplicity and easiness in daily operation (Pilli et al., 2011).
1.3.2.4. The release of ammonia and soluble organic nitrogen assessment
The ammonia nitrogen concentration increases following the increase in ES due to the disintegration of bacterial cells and release of intracellular organic nitrogen into the aqueous phase, which is subsequently hydrolyzed to ammonia (Khanal et al., 2006; Akin, 2008). The
19
disintegration of organic nitrogen from non-biological debris is also an important contribution to ammonia nitrogen (Khanal et al., 2007).
Bougrier et al. (2005) and Salsabil et al. 2009 claimed that total Kjeldahl nitrogen (sum of organic nitrogen and ammonia nitrogen) in the whole sludge is constant regardless of ES, which means US does not lead to nitrogen mineralization or volatilization. Following an increase in ES, organic nitrogen in particles decreases meanwhile organic nitrogen in soluble phase and ammonia concentrations increase. Different estimations of solubilisation of organic nitrogen were obtained: about 40% at 15000kJ/kgTS-220W (Bougrier et al. 2005) and about 19.6% at 108000kJ/kgTS-60W (Salsabil et al. 2009). Very little organic nitrogen is transformed into ammonium (NH4+-N).
In short, the release of ammonia and soluble organic nitrogen in the aqueous phase could be another useful indicator to assess sludge US pretreatment efficacy. However, a correlation between nitrogen release data and subsequent AD efficiency under different conditions is required to obtain a standardized method based on NH3 data (Pilli et al., 2011).
1.3.2.5. TOC assessment
In agreement with TCOD, TOC of sludge (solid + liquid) stays almost constant as the organics only pass from solid to liquid phase during US treatment without significant oxidation. After 90 min of sonication at 200 W, Kidak et al. (2009) observed that the solubilisation of organics (based on TOC measurement in the supernatant) reached 7.9% and 22.8% for industrial and municipal sludge, respectively. This increase of TOC in the liquid phase was consistent with the results obtained from the COD analysis.
To measure TCOD of sludge, a pre-digestion (hydrolysis) step is needed which somehow may not allow the solubilisation of all solid particles. Besides, there are also some refractory organics which are not oxidized by the oxidizing agents used in COD tests. Therefore, TOC measurement -based on combustion- is more accurate due to those difficulties in COD analysis.
1.3.3. Biological change-based evaluation of sludge ultrasonic pretreatment efficiency Evaluation of biological properties is usually based on heterotrophic count and specific oxygen uptake rate.
20
The breakdown of bacterial cell walls due to US can be evaluated by biological utilization tests. The sludge microbiological activity is characterized using Oxygen Utilization/Uptake Rate (OUR). OUR measurement therefore could be used to evaluate the sludge US disintegration efficiency.
In general, sludge microbial activity decreases when DDCOD increases during US sludge treatment. Nevertheless, Li et al. (2009) found that microbial activity was first enhanced and
OUR increased about 20–40% when DDCOD was in the range 0-20%. This indicates that the flocs were slightly disrupted, but the cell lysis did not occur at this stage. In other words, the microbial activity would go up when the micro-floc aggregates are separated from the sludge flocs. When
DDCOD was 20–40%, OUR still increased but by less than 20%, which means that some
microorganisms were damaged. When DDCOD was over 40%, inactivation of microbes occurred,
i.e. most bacteria were disrupted at different degrees, and sludge microbial activity decreased
significantly. In other words, cells started to lyse only when DDCOD was over 40% as presented in Fig. 1.7.
Fig 1.7: Relationship between sludge microbial activity and disintegration degree during ultrasonic treatment (Li et al., 2009)
DDOURis considered as the degree of inactivation and calculated as follows:
DDOUR (%) = (1 – OUR/OUR0) * 100 (Rai et al., 2004)
where OUR and OUR0 is the oxygen uptake rate of sonicated and original sample, respectively.
DDOUR first increases quickly with the increase in ES, but the increase then slows down, above
ES of 40 kJ/gTS according to Rai et al. (2004). It could be inferred that DDOUR is directly proportional to DDCOD. However, Zhang et al. (2007) observed a big difference between DDOUR