DOCTORAT DE L'UNIVERSITÉ DE TOULOUSE
Délivré par :Institut National Polytechnique de Toulouse (INP Toulouse) Discipline ou spécialité :
Micro-ondes, Électromagnétisme et Optoélectronique
Présentée et soutenue par :
Mme ANYA NADIRA-ASANTI TRAILLEle mardi 25 novembre 2014
Titre :
Unité de recherche : Ecole doctorale :
FLEXIBLE MONOLITHIC ULTRA-PORTABLE GROUND PENETRATING
RADAR USING INKJET PRINTING TECHNOLOGY
Génie Electrique, Electronique, Télécommunications (GEET) Laboratoire d'Analyse et d'Architecture des Systèmes (L.A.A.S.)
Directeur(s) de Thèse :
M. HERVE AUBERT
Rapporteurs :
M. ALAIN REINEIX, UNIVERSITE DE LIMOGES M. DOMINIQUE BAILLARGEAT, UNIVERSITE DE LIMOGES
Membre(s) du jury :
1 M. GILLES DAMBRINE, UNIVERSITE LILLE 1, Président
2 M. COUSTOU ANTONY, LAAS TOULOUSE, Membre
2 M. HERVE AUBERT, INP TOULOUSE, Membre
I would like to acknowledge my thesis director Professor Hervé Aubert for coordinating this research, Sangkil Kim, Antony Coustou, Xavier Bouquet and Emilie Debourg for their contributions on characterization and assembly of the flexible circuits. I would also like to acknowledge IRD (Institut de recherche pour le déeveloppement)
Flexible monolithic ultra-portable ground penetrating radar using inkjet printing tech-nology A Ground Penetrating Radar (GPR) performs nondestructive detection of buried objects, or subsurface imaging by transmitting electromagnetic waves and de-tecting and analyzing the reflections. The main challenge of GPR is the reduction in detection range due to the severe signal attenuation that is caused by subsurface con-ductivity that becomes more severe at high frequencies. In order to increase the detec-tion range, GPR uses lower frequencies than non-GPR radars and thus requires larger antennas that may limit system portability. Most GPR systems use impulse radars however the FMCW (frequency modulated continuous wave) radar can provide some advantages such as frequency versatility, reduced system maintenance and improved range resolution. Frequencies below 1 GHz were initially uncommon in short-range FMCW radars but are now finding their way back in systems such as ultra-wideband (UWB) ground penetrating radars for mine detection and as well as other applications. When measurements are performed on vehicles, large antenna fixtures are not a prob-lem. Portability, however, can become an issue in geophysical studies or emergency work in which one may need to transport the system through rugged, unexplored and/or hazardous locations without vehicle access and perform measurements. Inac-cessible environments may require climbing up and down, squeezing through, jumping over, crawling under, maneuvering through or swimming through obstacles (moun-tains, caves, lakes, rocky areas). In addition to transportation, rapid system setup is critical in difficult conditions such as freezing temperatures or extreme heat where exposure time is costly and limits measurement time. One solution to enhance the portability and deployability of a GPR system for wide area rugged measurements is to realize a complete system on a continuous substrate that is rollable around a rea-sonably small radius and storable in a scroll or poster-like fashion for easy backpack transportation. Electronics that can flex and bend have already used in military appli-cations and for outdoor sporting gear. Currently, there are a few types of technology available to realize flexible electronics that have been a major topic of research, each
with different levels of integration. Inkjet printing technology offers a cost effective, versatile and efficient method for realizing flexible devices. In this work a classical FMCW radar system is designed and an effort is made, for the first time, to apply inkjet printing technology to a radar system. The system is referred to as a portable monolithic radar system in which all actives, passives and antenna are meant to share the same continuous rollable substrate. In doing this, a medium level of integration is used to investigate limits of system complexity, resolution and ultra miniaturization for tight rollability. Various design challenges of a large system are overcome that will hopefully give insight to new designs as the integration level using inkjet printing technology increases.
Contents vii
List of Figures xi
List of Tables xv
Nomenclature xv
1 Introduction 1
1.1 Stepped frequency modulated continuous wave ground penetrating radar
for groundwater detection . . . 1
1.1.1 Concept of Operation . . . 1
1.1.2 Exploration Depth . . . 3
1.1.3 Groundwater . . . 7
1.1.4 FMCW/SFCW Architecture . . . 9
1.1.5 State of the art Systems . . . 12
1.1.6 Research Focus . . . 14
1.2 Ultra-portable ground penetrating radar using inkjet printing technology 15 1.2.1 Portable monolithic radar . . . 15
1.2.2 State of the art devices . . . 18
1.2.3 Technology Processes . . . 21
1.2.4 Inkjet Printing . . . 25
1.2.5 Research Focus: Hybrid Technology . . . 25
2 System Design 29 2.1 System Overview . . . 29
2.2 Waveform Specifications . . . 30
2.4 Transmitted Power . . . 42
2.5 Soil Environment and Target Reflection . . . 43
2.5.1 Soil and Water Properties . . . 43
2.5.2 Ground Model . . . 43
2.5.3 Power at Each Stage . . . 47
2.6 Receiver Design . . . 60
2.7 Analog to Digital Conversion . . . 60
2.8 Signal Processing . . . 61
2.9 Detection . . . 61
2.10 System specifications . . . 63
2.11 Conclusion . . . 64
3 Design and Fabrication of Monolithic GPR 67 3.1 Introduction . . . 67
3.1.1 Background: Materials . . . 68
3.1.2 Integration Level of Flexible Electronics . . . 69
3.1.3 Technology and Applications . . . 70
3.2 Design . . . 72 3.3 Fabrication . . . 74 3.4 Assembly . . . 80 3.5 System design . . . 85 4 Measurement verification 89 4.1 SFCW GPR on classical technology . . . 89 4.1.1 Introduction . . . 89 4.1.2 Hardware . . . 90 4.1.3 System construction . . . 92 4.1.4 Software . . . 92 4.1.5 Measurements . . . 98 4.1.6 Measurement data . . . 98 4.1.7 Conclusion . . . 103
4.2 Measurements of FMCW system in inkjet printed rollable substrate . . 104
4.2.1 Introduction: Assembled system . . . 104
4.2.2 Unrolled system . . . 104
4.2.3 Rolled system . . . 105
4.2.5 Results Analysis . . . 111 4.3 Antennas . . . 114 4.3.1 Conclusions . . . 117 4.3.2 Recommendations . . . 118 References 119 Appendix A Appendix A 129 A.1 Dwell time: td . . . 129
1.1 GPR concept of operation. . . 3
1.2 Largest observed GPR exploration depths for different subsurface ma-terials. . . 4
1.3 Resolution versus exploration depth tradeoff. . . 5
1.4 Groundwater. . . 8
1.5 Groundwater detection challenge. . . 8
1.6 FMCW concept of operation. . . 10
1.7 State of the art radars employing SFCW dual SFCW/FMCW or FMCW architecture. . . 13
1.8 Development of a new radar system using a unique combination of technologies (type of radar, chosen architecture, frequencies, application. 15 1.9 Reflection Surveys. . . 16
1.10 GPR applications involving measurements in rugged outdoor environ-ments. . . 17
1.11 Concept of ultra portable ground penetrating radar system. . . 18
1.12 Flexible electronics is one of several types of disruptive technology. . . . 19
1.13 Flexible electronics benefit to everyday life. . . 19
1.14 State of the art flexible devices. . . 22
1.15 Technology processes for rigid and flexible electronics. . . 24
1.16 Integration levels of inkjet printing technology. . . 25
1.17 Concept of hyrbrid approach. . . 27
2.1 General system architecture. . . 31
2.2 Relationship between system specifications established for the specific SFCW GPR system under design. . . 32
2.3 Waveform. . . 33 2.4 Experimental validation of frequency stepsize ∆f on range ambiguities. 36
2.5 Tm/τ according to theory. . . 37
2.6 Experimental validation of sweep period (or dwell time) on signal. . . . 38
2.7 Waveform properties to scale calculated using [60]. . . 51
2.8 Water properties. . . 52
2.9 Power budget. . . 54
2.10 Power transmitted into the ground. . . 54
2.11 Two way attenuation and spreading loss versus range. . . 55
2.12 Water properties. . . 56
2.13 Power received versus range. . . 57
2.14 Power received versus range for various frequencies and target condi-tions (dry soil). . . 58
2.15 Power received versus range for various frequencies and target condi-tions (wet soil). . . 59
2.16 Receiver design. . . 60
2.17 Signal to noise ratio. . . 61
2.18 Detection. . . 64
2.19 Schematic (indoor, outdoor setup) . . . 65
2.20 Portable radar. . . 66
3.1 concept of portable Radar. . . 69
3.2 Key applications for discruptive technology. . . 71
3.3 Focus of this research. . . 72
3.4 Commercial mixer (LT5560) reduced to single layer. . . 74
3.5 Realization of circuit using silver nanoparticle technology process. . . . 76
3.6 Electroless copper deposition. . . 78
3.7 Realization of a) using b) inkjet printing silver nanoparticle ink versus c) two-step electroless plating bath process. . . 79
3.8 a)-c) metal delamination after bridge removal d) successful mounting e) package choice for bridge prevention. . . 82
3.9 Bonding materials used to attach components to Cu contact pads inkjet printed onto PET a) poxy glue, b) solid solder and c) solder paste. . . . 83
3.10 Thermal profile settings, oven temperature, and device temperature used. 84 3.11 Resolution limit reached for printing and assembling components onto flexible PET. . . 84
3.13 CADEagle schematic. . . 86
3.14 Full system assembled on inkjet printed flexible substrate technology. . 87
3.15 Illustration of a) parylene coating b) flexible system layout. . . 88
4.1 Indoor setup. . . 93 4.2 Indoor setup. . . 94 4.3 DDS Software. . . 95 4.4 ADC software. . . 97 4.5 Measurements. . . 99 4.6 Measurement data (B = 200 MHz). . . 100 4.7 Measurement data (B = 250 MHz). . . 101 4.8 Measurement data (B = 350 MHz). . . 102
4.9 Measurements of rollable radar module a) fabricated system b) VCO output c) full system measurements, mixer output d) full system mea-surements, mixer output (normalized). . . 105
4.10 Bending test. . . 106
4.11 Normalized output of the rollable radar system for horizontal and ver-tical bending around cylinder of radius 4.5cm. . . 107
4.12 Output of the rollable radar system for horizontal and vertical bending around cylinder of radius 4.5cm. . . 108
4.13 Refabrication and measurement of mixer insertion loss. . . 109
4.14 Xray image of manually assembled circuit. . . 110
4.15 Xray image of heat controlled assembled circuit. . . 111
4.16 Improvement in insertion loss (dotted blue curve to solid blue curve) upon addition of wire. . . 112
4.17 Thermal profile settings, oven temperature, and device temperature used.113 4.18 Addition of inductance to remove the CPW parasitic mode. . . 114
4.19 Far field radiation pattern . . . 115
4.20 Dual frequency CP rhombic Loop with crossed dipole. . . 116
4.21 Impedance matching. . . 116
1.1 Maximum allowed measured radiated PSD for GPR/WPR imaging
sys-tems according to European rules taken directly from [43] . . . 6
1.2 Maximum allowed mean PSD for GPR/WPR imaging systems accord-ing to European rules taken directly from [43] . . . 6
1.3 Maximum permitted exposure (MPE) according to FCC rules [94] . . . 6
2.1 System specification list. . . 31
2.2 Maximum unambiguous range versus frequency stepsize. . . 34
2.3 Range resolution versus bandwidth for different material properties. . . 35
2.4 Beat frequencies fb versus range R, (for ϵs = 3) . . . 39
2.5 Beat frequencies fb versus range R, (for ϵs = 15) . . . 39
2.10 Average power. . . 42
2.11 Soil Properties. . . 44
2.14 Reflection coefficient from soil to water. . . 46
2.15 Scattering cross section calculated from [42, 83, 93] . . . 47
2.16 Power at each stage (dry soil). . . 48
2.17 Power at each stage (wet soil). . . 49
2.6 System specifications (case 1). . . 50
2.7 System specifications (case 2). . . 50
2.8 System specifications (case 3). . . 50
2.9 System specifications (case 4). . . 50
2.12 Water properties from [13] . . . 53
2.13 values . . . 53
2.18 System specifications. . . 65
4.1 Parts List . . . 90
Introduction
Liquid water is the most important and essential resources needed to host life. It is one of the most widely available ingredient of nature however due to man made activities, usable has become scarce in certain locations. The largest percentage of fresh water (70%) resides in ice caps, glaciers and snow and the second largest percentage (30%) is groundwater [98]. Ground penetrating radar, amongst other techniques can be used to locate groundwater sources.
1.1
Stepped frequency modulated continuous wave
ground penetrating radar for groundwater
de-tection
1.1.1
Concept of Operation
Ground Penetrating Radar (GPR) is a very popular microwave technique used to per-form non destructive testing in a variety of applications ranging from civil engineering and forensics to environmental research, archeology and agriculture. A GPR system uses electromagnetic waves in the form of radar pulses to detect objects deep under-ground or within non-earth mediums such as within walls, bridges or other structure. GPR detection operates on the well known principle that an electromagnetic wave will undergo a reflection in the form of scattering when it encounters a sharp contrast in electrical properties. This same phenomena can be used to detect large bodies of groundwater. A GPR system can also synthesize a detailed image representative of the subsurface layers. When an electromagnetic wave is transmitted into an
inho-mogeneous ground, a portion of the wave is scattered back each time an electrical contrast is encountered. Each reflection reaches the receiver at a particular time in-stant and the receiver detects a series of distinct reflections versus time (Figure 1.1a) scattered from electric discontinuities that vary in space. The composite of the reflec-tion amplitudes versus time is referred to as a reflecreflec-tion trace (Figure 1.1b). During a scan, measurement are taken and processed into reflection traces and collected across incremental spatial positions that is tangential to the measured surface (Figure 1.1c) known as survey lines. The traces can be combined to produce a wiggle diagram or 2D or 3D reflection profile. Producing such a profile require extensive amount of signal processing that includes filtering, background removal, deconvolution, velocity analysis, migration depth conversion as well as other steps.
Reflection surveys (Figure 1.9) employ various spatial configurations to measure signals traveling through the ground with each configuration providing different per-spective for analyzing the signal path below the subsurface. There are five well known surveys, these include the common midpoint (FIgure 1.9c), common offset (Figure1.9b), common source (Figure1.9d), common receiver (Figure1.9e) and trans-illumination (Figure 1.9a) survey. The common offset survey is the most commonly used and is performed by moving a single transmit and receive antenna along the ground surface with each antenna remaining at a fixed separation. The common midpoint reflection survey (WARR-Wide Angle Reflection Refraction) is performed by incrementing the transmit and receive antenna separation with respect to a fixed point and measuring the difference in two-way travel time for each spatial separa-tion. Common source surveys involve transmitting to multiple receiver antennas and common receiver configurations involve receiving from multiple transmit antennas. In trans-illumination surveys, used in borehole GPR, a transmit antenna directly illumi-nates the receiver. A more thorough overview of methods GPR uses to collect data can be found in [79]. GPR can complement other nondestructive methods such as elec-tromagnetic induction, seismic detection, infrared detection, resistivity and acoustic methods [74].
GPR Applications
GPR is a sucessful nondestrutive analysis technique used in various applications in the fields of archeology, geophysics, utility detection, civil engineering and snow research. The following applications have been listed in [Daniels] and numerous other references as having successfully utilized GPR:
(a) GPR Reflections (b) reflection(s) ampli-tude versus time
(c) wide area measurements across different spatial posi-tions
Fig. 1.1 GPR concept of operation.
• Civil engineering: nondestructive testing and assessment of tunnel linings, wall condition, bridge decks, reinforced concrete, building condition, road condition and rail tracks
• Utilities: pipes and cable detection, mapping trench boundaries
• Geophysics: planetary exploration, snow/ice/glacier studies, measuring the depth to bedrock, depth to water table, mapping or detecting permafrost, imaging frac-tures and cavities, measuring glacier thickness, soil/rock characterization • Environmental or geotechnical: investigation of land contaminants, mapping
landfills, borehole inspection
• Snow research: to understand the properties of snow for environmental studies on energy balance (FMCW radar)
• Other Applications: archaeological investigations, timber condition, mine detec-tion, forensic investigations, medical imaging, soil moisture content for agricul-ture and remote sensing
1.1.2
Exploration Depth
Groundwater can exist over a hundred meters deep. Ground Penetrating Radar is a useful technique because of the high resolution detection and imaging capabilities, however the exploration depth of GPR is limited. The achievable exploration depth of a GPR system depends on several factors: subsurface material properties, frequency, power, instrumentation and signal processing.
Fig. 1.2 Largest observed GPR exploration depths for different subsurface materials.
Subsurface materials
The primary uncontrollable factor that limits GPR exploration depth is the subsurface material properties. This is because the conductivity the material determines the skin depth or level of signal attenuation undergone. Figure1.2shows the best case possible exploration depths and it can be seen that materials such as ice are as transparent as air, and in materials such as dry sand and certain types of snow, a perfect GPR system can theoretically see 100 meters. For materials such as concrete or those containing clay, no more than 10 meters can be observed. Achieving such depths in Figure 1.2
is very difficult, even with commercial systems. The measured properties of common soil materials can be found in [29]. This data is used to determine more precisely the amount of attenuation loss for the GPR signal for specific soil conditions and at specific frequencies.
Frequency
The second factor dictating exploration depth is frequency. Low frequencies undergo less attenuation and therefore travel further however lowering the center frequency increases the pulse length and degrades the resolution, especially for impulse radar. The tradeoff between resolution and exploration depth (Figure 1.3) must be handled depending on the application. For instance FMCW radars used to characterize the properties of snow (properties which have a spatial distributions that vary on the order of a few centimeters) require architectures that utilize one or multiple frequencies
Fig. 1.3 Resolution versus exploration depth tradeoff.
between 4-40 GHz (C, K, Ka, Ku bands) in order to image different levels of snow. In utilities detection applications, when imaging larger structures such as pipes less than one meter deep, frequencies over 1 GHz are sufficient. For environmental applications, in order to reach large scale landforms that are deeply buried in soil that is potentially damp or wet, frequencies under 500 MHz are needed and some cases in literature even report frequencies as low as 25 MHz [Harry M. Jol].
Power
Another factor affecting exploration depth is power. Raising the transmitted power level increases the exploration depth however the exponentially increasing level of power needed to penetrate deeper into the ground makes this one of the less effective methods of increasing penetration. GPR systems are usually categorized as UWB de-vices, and therefore must conform to the rules for UWB power emissions limits as well. Table 1.2 shows the maximum allowed peak power spectral density and Table 1.1 the maximum allowed mean power spectral density for GPR devices for various frequency ranges according to the European rules [43]. In the Electromagnetic compatibility and Radio spectrum Matters (ERM); Code of Practice in respect of the control, use and application of Ground Probing Radar (GPR) and Wall Probing Radar (WPR) sys-tems and equipment [34], concerning the use of Ground Penetrating Radar in Europe, several requirements are specified to minimize unnecessary radiation. These include: keeping the transmitter on only during measurements, having a deactivation mech-anism, avoiding measurements near a radio site unless an agreement is made, and
whenever practical, to ensure that the GPR/WPR operating face is in contact with a layer of absorptive earth or structural material of sufficient thickness and properties to absorb and dissipate the GPR/WPR low level radiation [34]. More information can also be found in the CENELEC European Committee for Electrotechnical Standard-izations: Electromagnetic Compatibility (EMC) [19], guide list [18], guide 24 [16] and guide 25 [17].
Max allowed measured radiated PSD Frequency Range [MHz] Maximum Peak PSD
30 to 230 MHz -44.5 dBm/120kHz 230 to 1000 MHz -37.5 dBm/120kHz
Table 1.1 Maximum allowed measured radiated PSD for GPR/WPR imaging systems according to European rules taken directly from [43]
Max allowed measured radiated PSD Frequency Range [MHz] Maximum Peak PSD
<230 MHz -65 dBm/MHz 230 to 1000 MHz -60 dBm/MHz
Table 1.2 Maximum allowed mean PSD for GPR/WPR imaging systems according to European rules taken directly from [43]
For the US, the FCC MPE (Maximum Permitted Exposure) limits for electric fields in the 30MHz-300MHz range according to US rules are shown in Table 1.3.
Maximum occupational
(controlled exposure) (time averaged over 6 minutes)1mW/cm^{2}, 0dBm/cm^{2} Maximum general population
(uncontrolled exposure) 0.2mW/cm^{2}, -7dBm/cm^{2}(at any given point in time) Table 1.3 Maximum permitted exposure (MPE) according to FCC rules [94] The same efforts to minimize radiation are made in the US as they are in Eu-rope [34] in regards to the antenna design and positioning. The power radiated into the air is considered as backlobe radiation and should be varified for each system. For the case of stepped frequency GPR, as was done in [97], the power emissions
lim-its under NTIA rules may also apply. The NTIA (National Telecommunications and Information Administration) standards for non-licensed devices can be found in [78].
Other factors affecting exploration depth
In addition to all the factors mentioned above, signal processing and hardware also affect the exploration depth and can significantly improve detection range and mea-surement reliability. The selectivity and sensitivity of the receiver will of course have the biggest impact on the detection range. In the case of GPR, gating switches add further enhancements by allowing the system to transmit more power while still de-tecting weak GPR reflections.
1.1.3
Groundwater
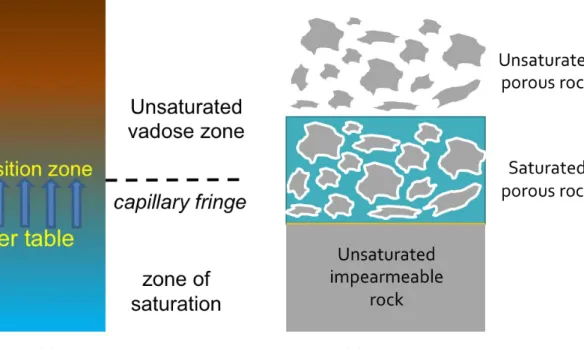
Ground penetrating radar requires expertise in two main areas: electrical engineering and/or geophysics therefore in addition to system engineering work, a very thorough detail of study into the geophysical nature of groundwater was performed to determine the system requirements. Groundwater originates from rain, snow, lakes or rivers and is recharged from the surface into the ground. Underground water resides within soil pore spaces (Figure 1.4a), or within rock fractures and voids, in this case referred to as aquifers (FIgure 1.4b). Groundwater can come to the surface naturally or can be extracted from wells. The interest in observing groundwater is usually related to agriculture, contamination, resource management, or just understanding its effect on land formations.
The level at which water is found is called the water table. When using GPR to locate a groundwater table, a detection challenge is encountered due to the existence of a inhomogeneous zone that that reduces the contrast seen by electromagnetic waves, weakening the GPR reflections, particularly for high frequencies (Figure 1.5a). The inhomogeneous zone is formed by a capillary fringe [10] which is a tension saturated layer about half a meter thick where groundwater moves upwards through pores by means of capillary action and feeds what is called the transition zone. The capillary effect and transition zone thickness depend on the pore size, shape and number [8,
31]. In coarse textured soils the capillary fringe is thinner and creates a more sharp dielectric contrast to the transition zone whereas in fine textured soils the capillary fringe is thicker and creates a more gradual dielectric contrast to the transition zone [31]. The movement of water (ϵr = 81) from the saturated region through pores
(a) soil pore spaces (b) fractures of rock formations
Fig. 1.4 Groundwater.
towards a low ϵr unsaturated region of soil (ϵr = 3-15) results in transition zone
electrical properties that gradually progress. High frequency signals with wavelengths that are small compared to the transition zone thickness will fail to see the impedance contrast and therefore undergo significantly weaker reflections, often causing failure of the GPR system to detect the water table [47]. The thicker the transition zone, the lower the frequencies required for adequate detection [8] and often groundwater detection requires even lower frequencies than other buried targets such as those in other applications (Figure 1.5b).
(a) High frequencies: wavelength too small to observe contrast
(b) Low frequencies: wavelength large enough to see contrast
Fig. 1.5 Groundwater detection challenge.
frequen-cies of around 10-300 MHz are necessary and allow for a large exploration depth. The resulting degradation in resolution from the low center frequency can be compensated for through signal processing techniques to improve the target recognition or contrast between layers. In [47] it was found through measurement that the detection range of a 100MHz GPR antenna was limited to 35m while that of a 500MHz GPR antenna was limited to only 9m. In addition, using the 100MHz antenna resulted in more accurate groundwater detection than the 500MHz antenna as there was less masking due to the transition zone. In [92], a commercial GPR with 50MHz and 100 MHz antennas successfully detected a water table located 10 meters below the ground surface. In [20] it is indicated that GPR frequencies of less than 100 MHz undergo optimal conditions when it comes to subsurface attenuation.
1.1.4
FMCW/SFCW Architecture
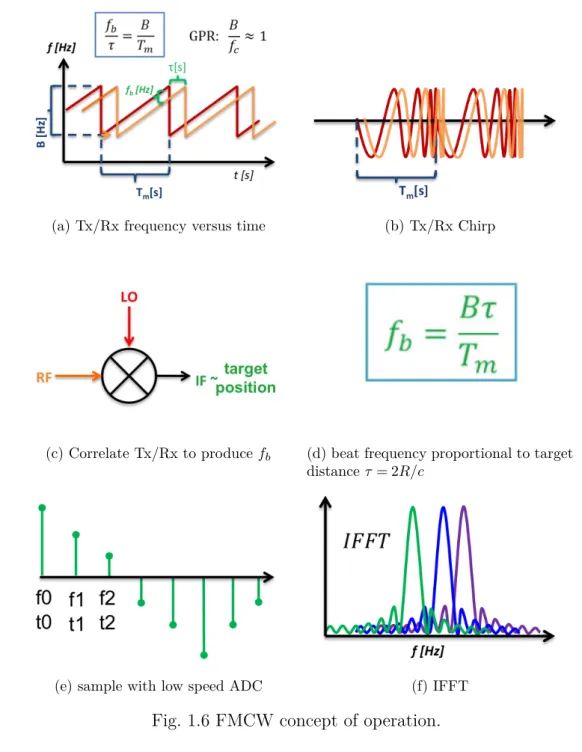
For ground penetrating radar, it is ideal to keep a low center frequency for maximum exploration depth and a large absolute bandwidth for good resolution [85]. This is done by maximizing the bandwidth to center frequency ratio (B/fc ≈ 1). The SFCW (Stepped Frequency Continuous Wave) architecture, also known as SFMCW (Stepped Frequency Modulated Continuous Wave) is based on the FMCW (Frequency Modu-lated Continuous Wave) or chirp radar which operates like the impulse radar, except that it acquires the information in both the time and frequency domain (generally speaking). The FMCW radar transmits a frequency sweep or chirp and the reflected echo is delayed in time (Figure1.6a, Figure1.6b). The receiver correlates the transmit-ted and received signal (Figure 1.6c) and the converted signal is an IF beat frequency that is proportional to the target range (Figure 1.6d), and that can be sampled (Fig-ure 1.6e) by a low speed analog to digital converter and then interpreted using the IFFT (Figure 1.6f).
Most GPR groundwater detection has been performed with impulse radars how-ever the FMCW radar can provide some alternate advantages in ground exploration. The FMCW-based architecture is very practical for GPR, particularly because of the fine resolution capabilities. Sweeping the frequency decreases the pulse length at a rate that is inversely proportional to the absolute sweep bandwidth ∆ R = v/(2B), therefore provides higher resolution detection and imaging. The FMCW chirp also transmits more energy with less average power: E = PavTm, increasing the signal to
noise ratio (SNR ∝ Tm) which is beneficial for GPR which suffers from a significant
(a) Tx/Rx frequency versus time (b) Tx/Rx Chirp
(c) Correlate Tx/Rx to produce fb (d) beat frequency proportional to target distance τ = 2R/c
(e) sample with low speed ADC (f) IFFT
Fig. 1.6 FMCW concept of operation.
easy control over the frequency and radiated power, making the system extremely ver-satile for varying power emission limits or for different measurement conditions. The FMCW/SFCW receiver design demonstrates high efficiency and a low noise figure, both of which increase the dynamic range and increases exploration depth by allowing more power to be transmitted, weaker reflections to be detected despite strong surface reflections. The FMCW receiver also allows for easy control of the system gain and filtering which facilitates the analog to digital conversion of the beat frequency. The
simple low power hardware used (power amplifier, analog to digital converter) reduces the required system maintenance and finally these types of radars are also more diffi-cult to intercept because the transmitted power spectrum is rectangular. One major disadvantage of FMCW/SFCW radar systems is that the continuous transmission in-troduces leakage into the receiver, usually 100dB higher, thus requiring at least 60dB of isolation. Range sidelobes can also make these types of radars vulnerable to nearby reflections and clutter.
For the SFCW architecture in particular, transmitting in the form of discrete fre-quency steps rather than a continuous sweep allows for I/Q processing. With a slight modification in architecture, the signal can be mixed with the two orthogonal basis functions having correlation of zero (cosine and sine). The real and imaginary parts allow for computation of amplitude and phase of the frequency spectrum. This is ben-eficial as phase conveys more information than magnitude. In the case of detecting a target, the magnitude energy peaks and decays independently of the phase whereas the phase energy is more equally distributed across all frequencies. The phase prop-erties are more easily detected in situations where the SNR is lower, making it better than amplitude detection.
A frequency domain radar system can be designed to be switchable between SFCW and FMCW modes and is often done in certain applications to exploit the complemen-tary advantages of both. Swept FMCW demonstrates high processing speed, moving platform tolerance, high unambiguous range, better spectral purity and facilitation of gating. With swept FMCW though, data acquisition can be complicated, I/Q pro-cessing is not performed and achieving high linearity over a wide bandwidth is very challenging (posing the issue of range sidelobes). SFCW can achieve very linear sweep over a wide bandwidth, implement I/Q processing for more accurate detection/imaging and zooming capabilities and the data acquisition is simpler since it is performed at discrete steps. SFCW however suffers from digitally induced spurious emissions that can cause false detections and as well as doppler smearing (leakage between range bins) due to the slower processing.
The first patent for FMCW radar was filed by J.O. Bentley for the airplane al-titude indicating system [60]. FMCW radar is still used today in the radio altime-ter (RADALT), meteorological and atmospheric observations, through wall detection, tank liquid level measurements, vehicle collision warning, small motion measurements and other short range applications, typically using frequencies above 1 GHz.
1.1.5
State of the art Systems
Table 1.7 displays three examples of state of the art radar systems using different architectures: SFCW, SFCW/FMCW and FMCW. The first system, WISDOM (Fig-ure1.7a) [21] down-converts DDS output with a reference oscillator to obtain a highly linear frequency sweep, stepping over a wide bandwidth. It also employs an automatic gain control circuit containing a variable gain amplifier in order to transmit the same power level across all frequencies. The gating switches increase the dynamic range by allowing the system to transmit more power while still detecting weak GPR reflec-tions. Gating is quite complicated, as it requires switches on the order of nanoseconds in order to gate out surface reflections. The second system, PANDORA (Figure 1.7b) uses DDS output that is split across 8 channels, amplified, recombined in a Wilkin-son combiner and transmitted. The received signal is sent to the LNA, then split into several channels using band pass filters before detection. Isolation between the channels is achieved by performing measurements in two phases in which only half the channel frequencies are used at a given point in time, essentially creating a gap between channels. It was emphasized that realizing this radar system consisted or integrating off the shelf components [109]. The third system (Figure 1.7c) is designed for a larger exploration depth and reduced range resolution, justifying the need for VHF frequencies. It actually features two different modes of operation UHV and VHF for different exploration depths. The frequency sweep was obtained by downcoverting a digital chirp synthesizer with a YIG oscillator, then using automatic gain control to maintain uniform power at all frequencies. The architecture shown also illustrates the use of attenuators for matching. Two sets of bowtie antennas are used having lengths of 80cm and 20cm for the VHF and UHF operation modes [51].
VHF frequencies are commonly used for impulse radars but frequencies below 1GHz are not so common for most short-range FMCW radars used in tracking, navigation, meteorological studies, sensing and other applications. The VHF microwave band (A-band up to 250MHz and B-(A-band 250-500MHz), was commonly used for two- way radio communication and today used in television broadcasting, land mobile radio systems, air traffic control and other applications. It is obvious that the large physical antenna size degrades angular resolution, but despite this disadvantage, the ability of these frequencies to travel further at less power makes it essential for some applications. These frequencies are becoming practical for use in UHF microwave band radars C-band (300MHz-1GHz) and A-C C-band Ultra-wideC-band (UWB) Radars. Such radars are used in ground exploration for archaeological explorations, soil mapping and mining
(a) WISDOM radar (b) Pandora radar (c) UWB radar
Name
WISDOM (Water Ice Subsurface Deposits Observation on Mars)
PANDORA (Parallel Array for Numerous Different Operational Research Activities) Ultrawideband penetrating radar Application
high resolution imaging of sedimentary layers of well preserved organic molecules (ESA 2018 ExoMars Rover mission)
Landmine detection and other
applications
Measuring the thickness of sea ice above water System Gated SFCW GPR FMCW/SFCW GPR multichannel FMCW GPR2 modes Frequency 500MHz - 3GHz N = 501 ∆f = 5MHz 400MHz - 4.845GHz across 8 channels VHF: 50-200MHz Tm = 2ms, fs = 500kHz Run = 3-30m UHF: 300-1300MHz Tm = 10ms, fs = 500 MHz Run = 0.5-5m Exploration
depth 2-3 meters 1-4.5 meters 0.3-10 meters Resolution A few centimeters <5 centimeters VHF: 75cm
UHF: 15cm
Transmit
Power 10-20 dBm
Average power = 5W
37 dBm per channel 20 dBm
Fig. 1.7 State of the art radars employing SFCW dual SFCW/FMCW or FMCW architecture.
1.1.6
Research Focus
This work is dedicqted to the design of a SFCW/SFMCW GPR (stepped frequency modulated continuous wave ground penetrating radar) system designed specifically and exclusively for groundwater detection at very large depths. This requires a sys-tem designed for a long detection range and with a sufficient resolution to detect or image a large groundwater source, therefore frequencies of no more than 400 MHz will be used. The system developed in this work utilizes as unique combination of technolo-gies (Figure 1.8) that cannot be found commercially or in literature. Nearly all GPR systems for geophysical/environmental applications, more specifically for groundwater detection use impulse radar. Impulse ground penetrating radar systems are prevalent in academic research and exist on the market but a recent interest other types of radars, such as FMCW, for ground penetration has arisen due to some advantages it gives in performance and system architecture. FMCW radars are not commercially available and existing FMCW GPR architectures for research have been designed for applica-tions such as snow research, shallow soil mapping or landmine detection. These radars use frequencies over 1GHz and are designed to penetrate no more than 5 meters deep. Ultra-wideband FMCW/SFCW ground penetrating radars for very high resolution imaging applications have been realized by focusing primarily on a general system ar-chitecture and using commercial state of the components. High performance, portable systems have also been realized by developing new hardware over a long period of time. There do exist some FMCW GPR systems designed for long range detection using VHF frequencies for measuring sea-ice thickness. Currently there exists almost no FMCW/SFCW radar system that is specifically designed detect groundwater at depths of tens of meters while also addressing the low frequency restriction in the case that a transition zone exists [7]. The first focus of this research will therefore be to design an FMCW/SFCW Ground Penetrating Radar to accurately detect the presence of water in realistic conditions. Frequencies under 1 GHz will be used to achieve ranges over tens of maters, and restricted to below 500 MHz to ensure good detection despite the possible presence of a transition zone. Improvements in SNR, dynamic range, penetration depth and probability of detection can be made, particu-larly for groundwater research applications. This system will provide a theoretical and experimental foundation to address the portability issues in ground penetrating radar applications through the development of a flexible monolithic ultra-portable ground penetrating radar using advanced fabrication technology.
Fig. 1.8 Development of a new radar system using a unique combination of technologies (type of radar, chosen architecture, frequencies, application.
1.2
Ultra-portable ground penetrating radar using
inkjet printing technology
1.2.1
Portable monolithic radar
GPR reflection surveys can be complex, tedious, dangerous, time consuming and ex-pensive (Figure 1.10). The complexity arises from the fact that certain measurement require the system to be moved across wide areas (Figure 1.9) and/or for the system antennas to be oriented in different spatial configurations (Figure 1.10a). Many com-mercial vendors include practical portability enhancements such as equipping GPR systems with wheels.
frequen-(a) transillumina-tion
(b) common offset
(c) common midpoint
(d) common source (e) common receiver
Fig. 1.9 Reflection Surveys.
cies and therefore require physically large antennas. This is why many systems, in addition to wheels, also come with detachable antennas. Extremely large antenna fixtures are manageable when wide-area measurements are performed using vehicles or sleds however in many geophysics studies or emergency work, one often needs to transport the the system through difficult to reach areas with limited vehicle access (FIgure1.10b) and hazardous conditions such as extreme heat, arctic cold or volcanic environments (FIgure 1.10c). Many of these locations are unexplored and unmarked, therefore require climbing or maneuvering through small spaces (mountains, caves, rocky terrains) by foot. In such environments, the safe and easy portability of the system becomes extremely critical, just as it is when hiking. In addition to portabil-ity, when measurements must be performed in unfavorable conditions such as extreme heat, damp, or freezing temperatures, the rapid deployment and repacking of the en-tire system is critical, as it will save exposure time and cost by decreasing setup time and maximizing measurement time. A more portable system will also require less staff
to support while transporting and setting up the system which significantly saves cost.
(a) GPR sytem in verticql configuration (http://www.malags.com/solutions).
(b) GPR used in location without vehicle access (http://www.malags.com/solutions).
(c) GPR used in hazardous environments
(http://www.malags.com/solutions).
Fig. 1.10 GPR applications involving measurements in rugged outdoor environments. An ideal solution for an ultra portable radar would be to realize a complete system on a continuous rollable substrate. The system would be ultra thin, therefore rollable and able to fit into a compact container for storage. It would be lightweight, therefore back attachable and simple to transport because it folds up as tightly as a tent. And finally the deployment would simply involve unrolling the system to setup for measurements and rolling the system when measurements are complete (Figure1.11). Such a system would require for at least all actives, passives and antenna to share the same common substrate. To accomplish this, we look to electronics that can flex,
bend and roll. Such electronics are already used in military and outdoor sporting gear (ex. solar backpacks). Currently, there are several type of technology for realizing flexible electronics, each differing in the level of integration and performance. Some are commercially available while others are still under research.
Fig. 1.11 Concept of ultra portable ground penetrating radar system.
1.2.2
State of the art devices
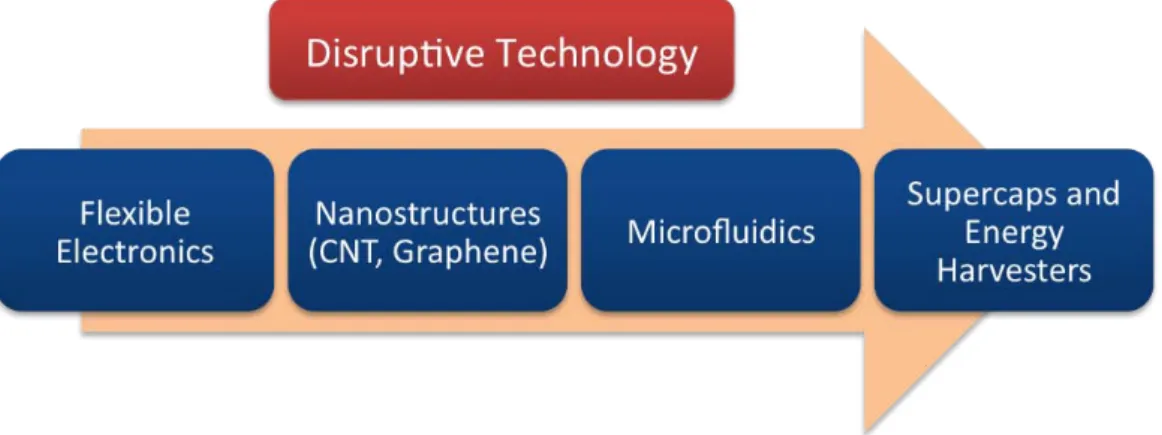
In order to realize a rollable radar system it is necessary to look into flexible electron-ics. One of the primary objectives in electronics packaging was miniaturization and integration, as it still is today. Technologies then emerged that could benefit from the ability of electronics to merge physically with non-rigid real world objects. As the number of devices per person increases, efforts are being made to make technology less imposing to the individuals personal space and time. Flexible electronics is now one of several types of disruptive technology (Figure 1.12) because it allows devices to be more easily integrated into everyday life by making them smaller, portable, wearable,
bio-compatible and even environmentally friendly (Figure 1.13) while also enhancing the functionality and performance, particularly for sensors.
Fig. 1.12 Flexible electronics is one of several types of disruptive technology.
Fig. 1.13 Flexible electronics benefit to everyday life.
Stretchable electronics
Stretchable electronics (or elastic electronics, elastronics) are electronics that can be pulled and elongated, increasing their area by several percent while still operating
nor-mally. In most cases the electronics are completely encapsulated in a stretchable ma-terial. Stretchable electronics are ideal for sensor applications (stress/strain/pressure) and applications where electronics are tightly wrapped around objects that expand and contract such as smart skins, band-aids and structural monitoring devices. Ad-ditional applications of stretchable electronics include batteries, capacitors solar cells and clothes. Substrates used in stretchable electronics are usually polymers such as polyurethane, polymide, silicone and other flexible materials. Realizing interconnects with elastic properties has been a major research topic and various types of tech-nology have been used ranging from patterning conductive materials (such as gold) onto elastic membranes to using SWCNT based stretchable conductors [14]. Rigid but miniaturized commercial off the shelf components are still used in stretchable electron-ics and one of the key challenges is managing the mechanical strain induced on the interconnects when stretching, a challenge that will continue to be a topic of research. For many of these devices, bonding is typically performed with low temperature solder alloy that is compatible with the stretchable materials.
Flexible electronics
Flexible electronics are electronics that can bend and flex. The typical structure consists of a flexible circuit mounted onto one or both sides of a flexible substrate. Applications for flexible electronics include those used for stretchable electronics as well as other devices such as keyboards, instrument panels, printers, cameras, calculators and solar cells. The typical technology used in flexible electronics is either etching or inkjet printing. Substrates usually include materials such as polymide, PEEK, polyester, PET and paper.
Rollable electronics
Rollable electronics, in addition to flexing, can roll about a reasonably small radius like a scroll or a poster. In many cases this includes stretchable electronics. Rollability is ideal for applications requiring mineaturization or convertibility within other devices or simply for rollable storage and easy transportation. The electronics world has been dreaming for half a century of the day you can roll a TV up in a tube [68]. Other uses of rollable electronics are for dynamic performance; devices designed to operate while in the rolled state. In addition to rollability, the mechanical properties of rollable electronics also make them thinner, lighter more robust (cleanable and less susceptible
to breakage when dropped). Rollable electronics are useful for the applications already mentioned in stretchable and flexible electronics. Biocompatability is another useful feature of rollable electronics for wearable/implantable medical devices.
In this work, rollability is of interest for ultra miniaturization of the GPR system. A new type of packaging is needed to realize a radar with this level of mechanical versatility, which is why we look at flexible electronics. The specific mechanical re-quirements for rollable electronics present key challenges that can only be met with new materials and new fabrication technology. As flexible, stetchable and rollable electronics, device such as antennas, batteries, sensors and flexible displays have al-ready been demonstrates as seen in Figure1.14. Examples include bendable antennas on liquid crystal polymer (Figure1.14afrom [81]), foldable antennas printed on paper (Figure 1.14bfrom [65]), flexible/stretchable batteries (Figure1.14cfrom [112]), flexi-ble sensors for medical applications (Figure 1.14d from [99]), wearable/biocompatible devices such as contact lenses (Figure 1.14b from [87]) and interactive displays (Fig-ure 1.14d from [110]). There are different ways of realizing flexible electronics, with each differing in the type of materials used, the technology process, and the level of integration.
1.2.3
Technology Processes
For most flexible electronics, conventional technology processes cannot be used. It is necessary to use a technology process that is both compatible with the low cost flexible materials used (Figure 1.15) by not causing thermal damage to them but at the same time reliable enough for the system to remain assembled and resist failure when mechanically stressed.
FlexCircuits
There are a few types of technology available to realize flexible electonics. FlexCir-cuits for example are available commercially (allflexinc, flexiblecircuit). They are made from polymide film laminated onto copper sheets and chemical etching is used for the circuit. A coverlay made out of polymide is often used as a protective top layer. The single sided flexcircuits have one conductor layer so components and interconnections are located on one side and accessed only from that one side. Minor crossovers can be formed on top of the coverlay. The advantage of the single layer design is that it has the advantages of being very thin (less than .10mm-.20mm) which is useful for certain
(a) Flexible DTSEA on LCP [81].
(b) Foldable magic cube an-tenna on paper [65].
(c) Stretchable battery [112].
(d) Flexible/stretchable medi-cal patch [99].
(e) Bionic contact lens [87]. (f) Interactive display [110].
Fig. 1.14 State of the art flexible devices.
applications prioritizing ultra thinness over high density. Single layer Flexcircuits with access on both top and bottom sides can be realized but require special processing and lasers to create such an access. Another commercial configuration reported is the sculptured flex circuit that uses multi-step etching to vary the conductor thickness at different sections to optimize either mechanical flexibility, electrical properties or as-sembly (making built-in termination points for connectors). Double sided flexcircuits can be used for more dense layouts that require GND or power planes, shielding, or layouts that just do not allow one layer. Double sided flexcircuits have two conductor layers and the components and interconnections are placed on both sides and access across layers is achieved with plated thu-holes. Multilayer flex circuits are available for even denser applications and provide impedance control, crosstalk elimination and shielding for applications and frequencies requiring it. They contain 3 or more conduc-tors layers, each accessible with plated through holes or by other means. Flexibility can be maintained by not using continuous lamination and leaving air gaps. Finally
more low cost flexcircuit is also commercially available where referred to as polymer thick film flex circuits made by screen printing conductor onto polymer film, and in the case of multilayer designs, printing insulating layers in between. It is reported that the low conductivity makes these more ideal for low-power but higher voltage applications.
Printing methods
Printing electronics offers a cost effective and efficient approach to realizing minia-turized, complex, stretchable/flexible/rollable devices. Various printing methods can be selected depending on the desired substrate, printed material, precision, printing area, layer quality, adhesion properties, time and cost desired for the job. For a large radar system at low frequencies, with a large antenna, the high volume/low precision roll-to-roll production could be more ideal than the sheet-based production.
Several printing methods already used in the printing industry are now used in electronics. Impact methods such as gravure, originally developed for printing news-papers gives the highest resolution and speed, and high volumes, which is why it is still used today for magazines and in graphic arts. The main disadvantage of this method is that the setup is timely and costly; rolls are expensive to pattern and the patterning process is slow. This can be major setback for realizing designs that differ from one another. In the area of electronics gravure can be used for printing organic semiconductors, organic and inorganic conductors and dielectrics. Lithography is the most widely used type of printing, still used for newspapers today however in the case of electronics, cross-contamination when two different solutions may pose an issue. Flexography (evolved from letterpress) can also be used for high volume printing for conductors and dielectrics. Screen printing is very commonly used though has a long setup time. Screen printing is a low cost method that is used for printing electronics. It involves silk screen printing of silver conductive paste into polyester. It can be used to print both single layer and multi layer designs on a variety of substrates and is a very efficient method however is restricted to printing only a single material. One of its biggest competitors is inkjet printing which will be explained in the following section.
Fig. 1.15 Tec hnology pro cesses for rigid and flexible electronics.
1.2.4
Inkjet Printing
Inkjet printing is one of several nonimpact printing methods already used for flexible electronics and is based on additive manufacturing. Additive manufacturing and 3D printing in general is listed among top 10 breakthrough technologies of 2013 according to technologyreview. It has not only helped fabrication, allowing researches to realize more creative ideas in academia. It has also made a turnaround in industry: in design, manufacturing and performance. Additive manufacturing saves production cost and one way is by using less material. More complex shapes can be manufactured and finished parts can be lighter. Inkjet printing is a flexible and versatile method that is very commonly used, and though a complicated process in itself, is the easiest to setup compared to other methods in the printing industry. Inkjet Printing is at the moment used for low volume production as the speed and resolution is slower than the previous methods mentioned, however one of the most extraordinary features of inkjet printing is the multi-material capabilities. Materials that can be printed include organic and inorganic semiconductors, metallic conductors, nanoparticles and nanotubes. The multi-material capability is allowing inkjet printing to achieve a very high level of integration when it comes to realising devies ranging from antennas, to sensors and microfluidics devices (Figure1.16). But how does one realize a complete radar system using inkjet printing?
Fig. 1.16 Integration levels of inkjet printing technology.
1.2.5
Research Focus: Hybrid Technology
In order to achieve the difficult task of realizing a large system using inkjet printing technology, this research uses the hybrid technology approach The hybrid approach is combining inkjet printing with off the shelf components (Figure 1.17). Why is this approach taken? For comparison, with inkjet printing technology one can realize trans-mission lines, antennas, passives (inductors and capacitors with Q factors of 20 up to several gigahertz) and 2D/3D interconnects. Printed transistors, using pentacene for instance are challenged by long channel length low electron mobility (5-10 cm2Vs)
compared to silicon electronics (10,000 cm2Vs), carbon nanotubes (100,000 cm2Vs)
and graphene (200,000 cm2Vs). To realize a large high performance system using only
inkjet printing technology is not yet possible. Using the hybrid approach, one can take advantage of the maturity of conventional CMOS ICs and quickly advance to a full high performance system while still taking advantage of the mechanical capabilities of flexible electronics. The hybrid approach simply works by printing the circuit foot-print, assembling the components and applying a protective layer. The hybrid process however is anything but trivial. It requires having flexible/stable interconnects with good adhesion and resistance to cracking. Both the printed film and the components themselves should demonstrate strong adhesion to the substrate, without delamina-tion, especially when flexing or rolling the devices. The hybrid approach also requires a low temperature assembly process that is compatible with both the flexible materi-als used as well as the off the shelf components. The process must be repeatable and reliable, and the structure itself must be robust, without and electrical or mechanical failure. In addition, component miniaturization is required in order to minimize the bending radius and handling small pin sizes with a nonstandard technology process is very challenging.
Fig. 1.17 Concept of hyrbrid approac h.
To achieve ultra-portability for a GPR system, a new system packaging approach is taken to make the system rollable. For the first time, inkjet printing technology will be applied to the radar system. In doing this, the focus will be shifted to the system level design and performance of systems using current inkjet printing technology.
System Design
2.1
System Overview
The system specifications for a SFCW/SFMCW GPR (stepped frequency modulated continuous wave ground penetrating radar) system designed specifically and exclusively for groundwater detection at large depths are established. These specifications provide a theoretical foundation to which the flexible monolithic ultra-portable ground penetrat-ing radar uspenetrat-ing inkjet printpenetrat-ing technology are be built upon.
The specifications are divided into six categories illustrated by color in Figure 2.1
which include: transmit waveform, power, signal propagation/loss/reflection, receiver design, digitization, signal processing; detection and finally the performance crite-ria. The establishment of the system specifications and selection or construction of hardware (Figure 2.1) were performed in parallel through multiple iterations in or-der to ensure that the requirements for the particular system could be meet with the available hardware components. The transmit waveform is controlled and limited by the DDS (Direct Digital Synthesizer) fed by a VCO reference clock. The DDS con-tains two outputs, the amplifier input and the the local oscillator which includes the in-phase channel (and optionally the quadrature channel when connecting the phase shifting circuit). The power stages include the power amplification stages that drive the transmit antenna, and the signal intercepted by the receive antenna. The signal propagation/loss/reflection stages are related to the soil environment and the reflec-tion characteristics of the target, in this case groundwater. This stage is quantified by using a detailed ground model estimate, and experimentally validated using an indoor delay cable that simulates a particular target depth. The receiver is designed
to have the sensitivity, selectivity, gain and filtering for the adequate digitization and signal processing (ex. IFFT) necessary to interpret reflections. The system specifi-cations are interrelated within one another, and the relationship between parameters established for this particular design is illustrated in Figure 2.2. The detection range is controlled by the soil environment and target reflection properties, the maximum sweep frequency, the transmitted power, the receiver design and the signal processing. The maximum unambiguous range is controlled by the modulation waveform and, in the case of SFCW, the frequency stepsize. The range resolution is determined by the sweep bandwidth, and sweep rate with the sweep rate also dictating the receiver bandwidth. An excel spreadsheet was used in order to calculate the specifications to establish operating points.
2.2
Waveform Specifications
The type of frequency modulation (Figure2.3) will affect the unambiguous range, reso-lution and doppler tolerance. Sawtooth linear modulation is the most common type of modulation used and demonstrates the largest range however doppler components can-not be isolated from the beat frequency component and may lead to range ambiguities that vary in severity depending on doppler frequency and sampling. With triangular modulation, the doppler can be averaged out of the distance measurement (as long as the doppler frequency is smaller than the beat frequency) and both target range and velocity can be measured accurately. In this design, stepped triangular modulation was chosen as it demonstrated experimentally the most narrow spectrum in the cho-sen hardware configuration, in addition to the advantages mentioned above. A Direct Digital Synthesizer (AD9910) provides fine frequency resolution down to < 0.5 MHz and covers a frequency range of up to 400 MHz with reasonable spurious performance however a high level of spurious emissions were observed The AD9915 is suggested as an alternative as it provides improved spurious performance, and allows for frequency output of up to 1 GHz. Benchmarking spurious performance is very complicated and additional work has been done in [Kroupa 2000], [Kroupa 1993] and [Nicholas 1987]. A significant level of amplitude modulation was observed at the DDS output. This was due to a current controlled source at the output, and a capacitive termination that caused the output impedance to vary with frequency. The components for a buffer circuit were obtained in order to solve this issue. The maximum frequency was chosen in order to minimize subsurface attenuation, and maximize the reflection coefficient
System Specifications Transmit Waveform
Modulation type Stepped Minimum frequency fmin
Maximum frequency fmax
Sweep bandwidth B Number of frequency points N Dwell time (at each freq) td
Modulation period Tm Modulation frequency fm Sweep period to TWT Tm/τ Power Transmit power Pt Antenna gain GT x, GRx
Signal Propagation/Path Loss
Attenuation/Skin depth α, δs
Target RCS σ
Target reflection Γ
Receiver Design
Receiver noise figure NF Conversion gain G
Thermal noise kT BIF
Receiver sensitivity Smin
Receiver bandwidth BIF
Maximum beat frequency fb,max
Beat frequency period 1/fb
Sampling, Signal Processing
ADC sampling frequency fs
FFT length N/fs
FFT gain, 10log(...) N/2 FFT resolution fs/N
Performance
Unambiguous range Run
Detection range Rmax
Range resolution ∆R Signal to Noise Ratio SN Rmin
Table 2.1 System specification list. Fig. 2.1 General system architecture. at the transition zone interface [Wolf 1937], [8]. The minimum frequency was then selected based on the chosen bandwidth to obtain the desired resolution and hardware capabilities. Finally, to avoid overlap of the RF or LO into the IF, it is confirmed that the minimum frequency will never cross into the IF bandwidth, which exists below 20 MHz in this system. The remaining waveform specifications were obtained using the
Fig. 2.2 Relationship between system specifications established for the specific SFCW GPR system under design.
classical FMCW equation which relates the sweep bandwidth B (fmax− fmin) and the
modulation period Tm to the difference frequency fb and two-way travel time τ for a
target at range R as seen in (2.2.1) and Figure 2.3a and Figure 2.3c
F M CW : fb τ = B Tm , where τ =2R v (2.2.1)
which is modified for the SFCW case by indicating ∆f and td where B = N∆f
and Tm= Ntd as seen in (2.2.2) and Figure 2.3b and Figure2.3c
SF CW : fb τ = ∆f td , where τ = 2R v (2.2.2)
(a) Sawtooth FMCW. (b) Sawtooth SFCW.
(c) Triangular FMCW. (d) Triangular SFCW.
Fig. 2.3 Waveform.
The maximum beat frequency measured corresponds to the maxim range measured in (2.2.3)
Rmax=
vtd
2∆ffbmax (2.2.3)
The SFCW frequency steps are synchronized with the ADC (one sample per step) in (2.2.4)
fs= 1
In order to avoid distortion in the IF beat frequency signal it is necessary to ensure that the number of frequency steps used, N, within a given sweep bandwidth B = N∆f is large enough so that the dwell time td is less than the beat frequency
period by satisfying (2.2.5)
td< 1
fb (2.2.5)
Or more specifically, taking the ADC Nyquist criteria in (2.2.6) fs
2 ≥ fbmax (2.2.6)
and imposing it on the SFCW frequency stepping tdby combining (2.2.4) and (2.2.6)
to get (2.2.7)
5mm 1
2td = fbmax (2.2.7)
By putting (2.2.7) into (2.2.6) gives the expression for the unambiguous range Rmax= vtd 2∆f 1 2td ! (2.2.8) Rmax= v 4∆f (2.2.9)
Since the phase shift is proportional to the target range ∆ϕ = 2π∆fτ where τ =
2R
v , v = c
√
ϵr the frequency stepsize is chosen so that the ∆ϕ < 2π over the desired unambiguous range. This is satisfied when 1
∆f > τ. The frequency stepsize should
be small enough so that Run exceeds the detection range. This particular system is
designed to have a very long detection range therefore Table 2.2. ∆fmax Run [m] ϵr = 3 ϵr= 15 20 2.17 9.7 40 1.08 4.8 60 0.72 0.32 80 0.54 0.24 100 0.43 0.19
Table 2.2 Maximum unambiguous range versus frequency stepsize.
experimentally validated (Figure 2.4) using a delay cable measurement (see Chapter 4), using a 47 m +/- 15cm cable (ϵr ≈ 2) to simulate reflection from a subsurface tar-get. Uniform frequency stepsizes of 1, 2, 3, 4 and 5MHz were used for three frequency sweeps of: 50-250 MHz, 50-300MHz and 50-400MHz corresponding to sweep band-widths 200MHz (N = 200, 100, 67, 50, 40), 250MHz (N = 350, 175, 116, 88, 70) and 350 MHz (N =350, 175, 116, 88, 70) making a total of 15 measurements. Figure 2.4a
shows the signal level versus frequency stepsize, Figure 2.4bshows the signal to noise ratio versus frequency stepsize and Figure 2.4c the range estimation error versus fre-quency stepsize. Figure 2.4d-Figure 2.4h show the beat frequency spectrums for each frequency stepsize for the sweep bandwidth of 350 MHz. As the frequency stepsize in-creases from 1MHz to 5MHz the signal level remains between -7 and -3dBFS however the SNR decreases from 10 dBFS to 6dBFS and the range estimatation error increases dramatically from 0m up to 200m. At ∆f = 1MHz the cable length is estimated to 49 meters whereas for ∆f = 5MHz estimated as 254 meters.
Number of frequency points and bandwidth
Using a frequency stepsize of 1MHz (corresponding to the number of frequency points, and assigned as a power of two), the range resolution versus bandwidth is shown in Table 2.3
range resolution ∆R[m] for ∆fDDS = 1 MHz B[MHz]= Nf
B[MHz]= Nf ∆R[m] ∆R[m] ∆R[m]
(ϵr = 2) (ϵr = 3) (ϵr = 15)
128 0.83 0.68 0.44
256 0.41 0.34 0.22
512 0.21 0.17 0.11
Table 2.3 Range resolution versus bandwidth for different material properties.
Dwell time
Sweeping too fast reduces the effective bandwidth (Figure2.5a), so the required sweep rate needed to meaintain resolution is verified. The Tm/τ ratio required depends on
the application, in particular to the target range. According to theory, a Tm/τ ratio
of at least 30 is required (Figure 2.5b).
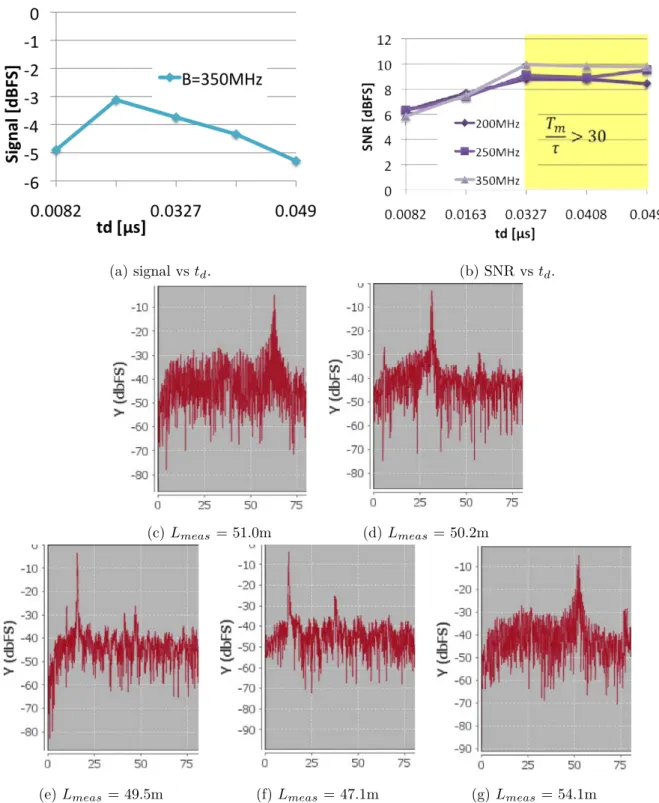
Figure 2.5 was also experimentally validated using using a 47 +/- 15cm cable (ϵr ≈ 2) over the full extent of the DDS sweeping capabilities (Figure 2.6). The same
(a) signal vs ∆f . (b) SNR vs ∆f . (c) Range error vs ∆f . (d) ∆f = 1 MHz, fb= 10 MHz Lmeas = 49 m (e) ∆f = 2 MHz, fb = 21.7 MHz Lmeas = 107 m (f) ∆f = 3 MHz, fb = 30.8 MHz Lmeas= 151 m (g) ∆f = 4 MHz, fb= 41 MHz Lmeas = 201 m (h) ∆f = 5 MHz, fb = 51.6 MHz Lmeas = 254 m
Fig. 2.4 Experimental validation of frequency stepsize ∆f on range ambiguities.
frequency sweeps were used: 50-250MHz, 50-300MHz and 50-400MHz corresponding to bandwidths of 200MHz, 250MHz and 350 MHz. Figure 2.6a shows the signal level
(a) effect of sweep rate on bandwidth and resolution (b) calculated required Tm/τ ratio Fig. 2.5 Tm/τ according to theory.
versus dwell time (ranging betweem -5 and -3 dBFS), Figure 2.6b shows the SNR versus dwell time. It can be seen that as the sweep rate decreases, the SNR increases from 6 dBFS and maximizes at 10dBFS in the Tm/tau < 30 region then levels off, confirming the theoretical estimation. Figure2.6c-Figure2.6gshow the beat frequency spectrum for the 350MHz bandwidth measurement.
The expected beat frequencies for different target ranges and DDS sweep rate settings are shown in Table 2.4 and Table 2.5 for three different materials. This information is used to verify the low pass filters, of which the LT6600 Fully Differential 4th Order Lowpass Filter was used, each model permitting cutoff frequencies that include: 2.5 MHz, 5MHz, 10MHz, 15MHz and 20 MHz. A tunable filter may add versatility of the system.
It is noted that the required waveform specifications to maximize detection (or imaging) may vary greatly depending on soil conditions. Various operating modes may be needed if one wants to extract a very detailed image of the properties. Fig-ure 2.6-FIgure 2.9 show operating modes for different groundwater scenarios, each list of specifications shows an illustration of the reflection coefficient as a function of frequency. Stepping through each different frequency slowly will result in a different amount of power reflected back, thus allowing the system to access more information about the groundwater source, however that can only be done operating within the cutoff frequency. In case 1 (Figure 2.6) where the transition zone height is small and
(a) signal vs td. (b) SNR vs td.
(c) Lmeas = 51.0m (d) Lmeas = 50.2m
(e) Lmeas = 49.5m (f) Lmeas = 47.1m (g) Lmeas = 54.1m Fig. 2.6 Experimental validation of sweep period (or dwell time) on signal. the soil dry (h = 0.1m, ϵr = 3), the transition zone cutoff frequency is 424 MHz and with the waveform specifications adjusted to operate within the 50-500MHz range as indicated in Figure 16a, the maximum unambiguous range is 43.3 meters, effective