Parametric Regression-Based Causal Mediation Analysis of Binary Outcomes and Binary Mediators: Moving Beyond the Rareness or Commonness of the Outcome
Mariia Samoilenko and Geneviève Lefebvre
Correspondence to Dr. Geneviève Lefebvre, Département de mathématiques, Université du
Québec à Montréal, C.P. 8888, Succursale Centre-ville, Montréal, Québec, Canada, H3C 3P8,
Phone: 1-514 987-3000 ext. 6166, Fax: 1-514 987-8935 (e-mail: [email protected]);
Mariia Samoilenko, Département de mathématiques, Université du Québec à Montréal, C.P.
8888, Succursale Centre-ville, Montréal, Québec, Canada, H3C 3P8 (e-mail:
Author affiliations: Department of Mathematics, Université du Québec à Montréal, Montréal,
Canada (Mariia Samoilenko and Geneviève Lefebvre); Faculty of Pharmacy, Université de
Montréal, Montréal, Canada (Geneviève Lefebvre); and Research Center, Centre hospitalier de
l’Université de Montréal, Montréal, Canada (Geneviève Lefebvre).
This work was funded by grants from the Fonds de recherche Québec-Santé (FRQ-S) and the
Natural Sciences and Engineering Research Council of Canada. Geneviève Lefebvre is a FRQ-S
Research Scholar.
ORIGINAL
UNEDITED
MANUSCRIPT
© The Author(s) 2021. Published by Oxford University Press on behalf of the Johns Hopkins Bloomberg School of Public Health. This is an Open Access article distributed under the terms of the Creative Commons Attribution Non-Commercial License
(http://creativecommons.org/licenses/by-nc/4.0), which permits non-commercial re-use,
distribution, and reproduction in any medium, provided the original work is properly cited. For commercial re-use, please contact [email protected].
Conflict of interest: none declared.
Running head: Exact Binary Regression-Based Natural Effects Estimator
ABSTRACT:
In the causal mediation framework, several parametric regression-based approaches have been introduced in past years for estimating natural direct and indirect effects. For a binary outcome, a number of proposed estimators use a logistic model and rely on specific assumptions or
approximations that may be delicate or not easy to verify in practice. To circumvent the challenges prompted by the rare outcome assumption in this context, an exact closed-form natural effects estimator on the odds ratio scale was recently introduced for a binary mediator. In this work, we further push this exact approach and extend it for the estimation of natural effects on the risk ratio and risk difference scales. Explicit formulas for the delta method standard errors are provided. The performance of our proposed exact estimators is demonstrated in simulation scenarios featuring various levels of outcome rareness/commonness. The total effect
decomposition property on the multiplicative scales is also examined. Using a SAS macro provided, we illustrate our approach to assess the separate effects of treatment to inhaled corticosteroids and placental abruption on low birthweight mediated by prematurity. Our exact natural effects estimators are found to work properly in both simulations and real data example.
KEYWORDS: binary mediator, binary outcome, causal mediation regression-based analysis,
exact natural effects estimator, outcome rareness/commonness
WORD COUNT ABSTRACT: 195 WORD COUNT MANUSCRIPT: 3846
ORIGINAL
UNEDITED
MANUSCRIPT
Mediation analysis approaches that rely on the specification of parametric models for the
mediator and outcome variables are naturally appealing to practitioners due to their conceptual
simplicity. However, it is notorious that the development of such approaches is more challenging
when the outcome is binary, as opposed to continuous, due to the consideration of nonlinear
models (1). In this line of research, contributions made over the years in the causal inference
framework have helped to increase resources available to estimate direct and indirect effects with
binary outcomes. However, a number of these invoke specific assumptions or approximations,
some of which may be delicate or not easy to verify in practice. VanderWeele and Vansteelandt
(2) and Valeri and Vanderweele (3) relied on the rare outcome assumption (ROA) to propose
regression-based estimators of natural direct and indirect effects (NDE, NIE) on the odds ratio
(OR) scale for continuous and binary mediators. For a normally distributed mediator, Gaynor,
Schwartz and Lin (4) used a probit approximation to the logit function to provide an estimator of
the NDE and NIE on the OR scale that can be used when the outcome is common. Previous work
by Tchetgen Tchetgen (5), which motivated the work by Gaynor et al. (4), introduced an exact
estimator for a non-rare outcome, but the approach assumed a bridge distribution for the
continuous mediator.
For a binary outcome and a binary mediator, the logistic regression-based causal mediation
approach by Valeri and Vanderweele (3) (V&V) is popular among applied researchers, arguably
because of its accessible implementation in standard statistical software (e.g. SAS procedure
PROC CAUSALMED and Stata module PARAMED (SAS Institute, Inc., Cary, North Carolina;
StataCorp LP, College Station, Texas; (6-8)). First designed for cohort data, this approximate
approach is based on the simplifying ROA, which is crucial in the development of the proposed
closed-form natural effects OR estimator. In practical contexts, the ROA is commonly verified
ORIGINAL
UNEDITED
MANUSCRIPT
by checking that the marginal outcome prevalence is reasonably small (9-11). However, as further expanded below, there is an increased awareness that this marginal
definition is inadequate for the ROA in causal mediation settings.
For a binary mediator, both Samoilenko, Blais and Lefebvre (12) and Gaynor et al. (4)
independently introduced a logistic regression-based estimator for cohort data that uses the
parametrized outcome and mediator probabilities to express the NDE and NIE on the OR scale.
This estimator is qualified as exact since it does not rely on approximations and can be used
regardless of the rareness or commonness of the outcome.
Samoilenko et al. (12) presented a simulation scenario mimicking real perinatal data in which the
outcome was rare marginally (that is, with ), but not in the strata formed by the exposure and mediator. They compared the proposed exact OR estimator with the V&V
approximate estimator and found that the former was unbiased for the NDE and NIE ORs
(ORNDE, ORNIE) unlike the latter. Commenting on Samoilenko et al. (12), VanderWeele, Valeri
and Ananth (13) acknowledged that the ROA needs to hold in strata formed by covariates,
including mediator, for their estimator to be valid. However, to require that the outcome be rare
in strata of a mediator is questionable when the mediator is strongly associated with the outcome.
The recent parametric estimator proposed by Samoilenko et al. (12) and Gaynor et al. (4) for a
binary mediator is attractive since it overcomes the marginal or conditional verification of the
ROA. Yet, more work is required to fully develop inference. In Samoilenko et al. (12), the
variance computation for the ORNDE and ORNIE estimators was done using bootstrap only. In
Gaynor et al. (4), the standard error formulas were not provided in the paper but were
implemented in a R code (R Foundation for Statistical Computing, Vienna, Austria) developed
for scenarios based on specific datasets. In Doretti, Raggi and Stanghellini (14), the exact
ORIGINAL
UNEDITED
MANUSCRIPT
parametric formulas for the natural effects on the log OR scale were extended for all possible
interactions in the outcome model (including exposure-mediator-confounding covariates’
interactions); corresponding expressions for standard errors were derived using the delta method.
However, the authors did not release computer code to provide easy implementation. The
purpose of our article is two-fold. The first objective is to provide explicit and straightforward
formulas for the delta method standard errors for the case of the mediator-exposure interaction
and make this option available in the general SAS macro developed in Samoilenko et al. (12).
While the bootstrap is indicated for inference on indirect effect (15), it is more
computer-intensive and not assumption-free (16, 17). Therefore, providing both delta and percentile
bootstrap confidence intervals (CIs) allows for greater flexibility and increased confidence in
mediation results. The second objective is to go beyond the OR scale and provide analogous
results for the NDE and NIE on the risk ratio (RR) and risk difference (RD) scales, with all three
scales using the same logistic model for the outcome.
METHODS
Models and counterfactual nested outcome probabilities
As in Samoilenko et al. (12) and Gaynor et al. (4), we assume the following logistic regression
models for the binary mediator and binary outcome , respectively:
( | ) , (1)
( | ) , (2) where is the exposure (binary or continuous) and is the set of covariates sufficient to control for exposure-outcome, mediator-outcome, and exposure-mediator confounding (18).
ORIGINAL
UNEDITED
MANUSCRIPT
Under identification assumptions (19) and modelling assumptions (1-2), the counterfactual
nested outcome probability is expressed as: ( ( ) | ) ( ) ( ) ( ) ( ( )) (3) where ( )
Generally, NDE compares to , while NIE is defined as a contrast between and . In the literature, NDE and NIE are also referred to as the pure (natural) direct effect and total (natural) indirect effect, respectively (20-22).
Equation 3 allows expressing the ORNDE, ORNIE, as well as the NDE and NIE RRs (RRNDE,
RRNIE), and the NDE and NIE RDs (RDNDE, RDNIE) in an exact manner.
Natural direct and indirect effects on the odds ratio, risk ratio and risk difference scales
Explicit expressions for the (conditional) natural direct and indirect effects ORs, | and | , corresponding to a change in the exposure level from to (also see
Samoilenko et al. (12), Gaynor et al. (4)) are derived using counterfactual nested outcome
probabilities defined in Equation 3 as follows:
ORIGINAL
UNEDITED
MANUSCRIPT
| ( ( ) | ) ( ( ) | ) ( ( ) | ) ( ( ) | ) | ( ( ) | ) ( ( ) | ) ( ( ) | ) ( ( ) | ) (4)
In an analogous manner, Equation 3 leads to exact natural direct and indirect effects RR
expressions, | and | , respectively:
| ( ( ) | )
( ( ) | ) |
( ( ) | )
( ( ) | ) (5)
The total effect (TE) odds and risk ratios, | and | , are defined as the product of the NDE and NIE on their respective scale:
| | | | | | (6)
From Equation 3, the NDE and NIE exact expressions on the RD scale are:
| ( ( ) | ) ( ( ) | ) | ( ( ) | ) ( ( ) | )
(7)
On the RD scale, the TE, | , is defined as the sum of the NDE and NIE:
| | |
ORIGINAL
UNEDITED
MANUSCRIPT
For each effect scale, the NDE and NIE estimators are induced by replacing the coefficients in
Equations 1-2 by corresponding estimators. The formulas for the natural effects standard errors
by delta method are provided in Web Appendix 1.
Valeri and VanderWeele (2013) approximate natural direct and indirect effects approach
As detailed in Samoilenko et al. (12), the approximate expressions for the ORNDE and ORNIE
provided in Valeri and Vanderweele (3) are obtained by invoking the ROA multiple times. First
replace, in Equation 3, the expit functions stemming from the outcome model by exponential
functions, and second, approximate the OR by RR, that is replace Equation 4 by Equation 5:
( ( ) | ) ( ) ( ) ( ) ( ( )) (8) | ( ( ) | ) ( ( ) | ) | ( ( ) | ) ( ( ) | ) (9)
The approximate expression for the TE is then given by
| | | . (10)
Simulation studies
Two simulation studies were conducted to examine the behavior of proposed exact estimators. In
the first simulation study, no covariates were included for the sake of simplicity, while two
ORIGINAL
UNEDITED
MANUSCRIPT
covariates were included in the second study. Both studies considered four scenarios
corresponding to different levels of outcome rareness/commonness:
Scenario 1. The outcome is rare in all the strata defined by the binary exposure and binary
mediator (conditional probabilities | );
Scenario 2. The outcome is rare marginally ( ), but it is not rare in one stratum defined by the binary exposure and binary mediator;
Scenario 3. This scenario is similar to Scenario 2, but features two common strata and a slightly
increased marginal outcome probability ( );
Scenario 4. The outcome is not rare marginally (is common) with .
Simulation study without covariates
For each scenario, we generated 1000 independent samples of size nonparametrically using sequential Bernoulli sampling for , and . The probability values used to generate the exposure, mediator and outcome variables are presented in Table 1.
The true mediation OR, RR and RD effects were calculated as
⁄ ⁄ ⁄ ⁄ ⁄ ⁄ (11)
with , computed using values from Table 1:
| | | ( | )
ORIGINAL
UNEDITED
MANUSCRIPT
The true total causal effects were calculated correspondingly as:
For each sample, exact estimates of natural direct and indirect effects were calculated on the OR,
RR and RD scales. The mean, bias, relative bias, standard deviation (SD) and root mean square
error (RMSE) of proposed exact estimators were then estimated over the 1000 samples
generated; the true RRs, ORs and RDs defined in Equation 11 were used as gold standard. For
each simulation scenario, the same statistics were also calculated for the approximate natural
effects estimator based on Equations 8-10. The approximate natural effects OR estimator was
evaluated in regard to both multiplicative scales (OR and RR). Indeed, because the approximate
natural effects are generally reported as ORs (23), we first compared the approximate natural
effect estimates to the true ORs. However, since the approximate ORs mimic RRs by
construction (see correspondence between Equations 5 and 9) we also evaluated the performance
of the approximate estimator using the true RRs as reference. The calculations described above
were performed using SAS, Version 9.5.
For each scenario and sample, we also considered two other existing approaches for comparison
with the exact method being introduced here. For all three scales (OR, RR, RD), we applied the
natural effect model (NEM) approach (24, 25)using the R package medflex (26). This approach
is not based on the ROA and directly parameterizes the natural effects. Two procedures,
weighting and imputation, are implemented in medflex; we used the weighting one which
requires specifying a regression model for the mediator and a NEM for the counterfactual
ORIGINAL
UNEDITED
MANUSCRIPT
outcome. A logistic model was specified for the mediator for all scales. NEMs
{ } , where is a link function, were fitted using logistic, log-binomial and linear regressions for the OR, RR and RD scales, respectively. For the
RD scale, we also applied Imai et al.(27)’s Parametric Inference Algorithm implemented in the
R package mediation(28).This causal approach, which also does not rely on the ROA, is based
on quasi-Bayesian Monte Carlo approximations and is provided as the default option in
mediation. A logistic model was specified for the mediator as well as for the outcome, where the
latter included a treatment-mediator interaction term as in the exact and approximate approaches;
1000 Monte Carlo draws were used for each sample generated. It should be noted that mediation
version 4.5.0 returns NDE and NIE estimates on the RD scale only.
We computed the coverage probabilities (CPs) of 95% CIs estimators by calculating the
proportion of times CIs enclosed corresponding true values of NDE, NIE and TE. For the exact
and approximate approaches, 95% CIs were constructed by percentile bootstrap based on 500
resamples with replacement (29) and using first order delta method. For the NEM approach, 95%
CIs were obtained using robust standard errors based on the sandwich estimator (30). For the
quasi-Bayesian approach, 95% CIs were based on the White’s heteroskedasticity-consistent
estimator for the covariance matrix (28).
Simulation study with covariates
In all scenarios, covariates and were generated independently as and , respectively. The binary exposure was generated according to the following model:
( | )
Then, the binary mediator and outcome were respectively generated under models
ORIGINAL
UNEDITED
MANUSCRIPT
( | ) and
( | ) where . The outcome simulation parameters are presented in Web Table 1 for each simulation scenario. Under these parameter values, the
stratum-specific outcome prevalences were similar to those from the simulations without
covariates.
The true mediation OR, RR and RD effects (gold standard) were calculated using simulation
parameters according to Equation 11, where
̅ ̅ ̅ ̅ ̅ ̅ ( ̅ ̅ ) and ̅ , ̅ .
The simulation study with covariates was conducted the same way as the one without covariates
regarding number of samples generated, sample size and estimators investigated. For the RR
scale in Scenario 4, the NEM was however fitted using a Poisson regression model instead of
log-binomial because of failed convergence of the latter model for 77.6% of samples generated.
For all approaches, models included covariates as main effect terms only and mediation effects
were estimated at the sample-specific mean values for and . It should be noted that in absence of exposure-covariate interactions, the conditional mediation effects returned by medflex
are the same for any level of adjustment covariates (31).
ORIGINAL
UNEDITED
MANUSCRIPT
The decomposition property of the exact and approximate TE estimators was examined in both
simulation studies (see Web Appendix 1). Further details on the estimation procedures are
provided in Web Appendix 1.
RESULTS
The performance of the proposed exact natural effects estimators on the OR, RR and RD scales
is summarized in Tables 2–4 and Web Tables 2-4 for the simulation studies without covariates
and with covariates, respectively (type of estimator = exact).
For the multiplicative scales, the means of exact NDE, NIE and TE estimates were very close to
corresponding true values for each scenario and each type of simulation, with relative bias values
ranging between -0.34% and 1.35%. All exact interval estimators (bootstrap and delta method)
yielded CP values close to 95%. For the simulations without covariates, the exact results were
almost identical to those returned by the NEM approach (results omitted from tables), while they
were very close in the simulations with covariates. The exact results were also very close to
those obtained using the quasi-Bayesian approach (for RD scale; see Table 4 and Web Table 4).
The results for the approximate natural effects estimator in the simulation studies without and
with covariatesunder increasing degrees of the ROA violation are presented in Tables 2-3 and
Web Tables 2-3, respectively (type of estimator = Approximate). In Scenario 1 (rare outcome in
all strata defined by and ), the approximate OR estimator demonstrated small relative bias values when either the true ORs or RRs was used as reference values (between 0.13% and
5.24%). Corresponding CPs by delta method and bootstrap were close to the 95% nominal level.
For Scenario 2, where the outcome is rare marginally, but not rare in the stratum defined by and , we observed relative bias values ranging between 5.93% and 62.6%, and a significant decrease in CP values. The same tendencies for relative biases and CPs were seen for
ORIGINAL
UNEDITED
MANUSCRIPT
Scenario 3. For Scenario 4, which violated the ROA in all strata defined by and , we obtained relative bias values up to 69.62% and CP values equal to 0% in some cases.
The total effect estimates obtained from the exact approach by the multiplication of
corresponding NDE and NIE estimates were closer to the non-mediated total effect estimates as
compared to the approximate approach (Web Tables 5-6).
REAL DATA EXAMPLE
We used cohort data presented in Samoilenko et al. (12) to illustrate our exact mediation
approach. Briefly, the data consisted of 6197 singleton pregnancies from asthmatic women who
gave birth in Quebec (Canada) between 1998 and 2008. Low birthweight (LBW) and prematurity
(PTB) were selected as the outcome and mediator, respectively, and two exposure variables were
examined separately: 1) treatment with inhaled corticosteroids (ICS) during pregnancy and 2)
placental abruption. These data correspond to a scenario in which the outcome (LBW) is rare
marginally, but not rare in some strata of mediator (PTB) and exposure.
We used our SAS macro mediation_estimates (see Web Appendices 2-3) to obtain exact NDE
and NIE estimates on the OR, RR and RD scales for each exposure variable. Mediation analyses
adjusted for maternal age at the beginning of pregnancy (< 18, > 18-34, > 34 years), baby’s sex,
diabetes mellitus, and gestational diabetes. The SAS CAUSALMED procedure was also applied
to obtain natural effects on the multiplicative scales, implementing the approximate approach
defined in Equations 8-10 for the OR scale. Mediation effects on the OR and RR scales were also
estimated using the NEM approach, as described in the simulation studies, and on the RD scale
using the quasi-Bayesian approach. For all approaches, exposure-mediator interaction was
considered, and mediation effects were estimated at the sample-specific mean values of the
ORIGINAL
UNEDITED
MANUSCRIPT
covariates. However, since our SAS macro mediation_estimates allows for the estimation of
conditional natural effects at user-specified values of the adjustment covariates (by default at the
mean values of the covariates), we also obtained natural effects for placental abruption at more
meaningful levels of the categorical covariates for purpose of illustration. More details on the
real data analyses are presented in Web Appendix 1.
The main results are presented in Table 5 and Figure 1. The exact and approximate OR estimates
did not generally agree, with the only exception of the NIE in the mediation analysis with ICS as
exposure variable. For placental abruption, the observed discrepancies were quite remarkable.
The RR point estimates computed by our SAS macro were close to those computed by PROC
CAUSALMED with a log-binomial or Poisson outcome regression model. However, abnormally
wide bootstrap 95% CIs for RRNDE and RRTE were returned by PROC CAUSALMED for ICS
exposure.
For both exposures, the natural effects OR and RR point estimates obtained by our exact
approach were similar to those obtained by the NEM approach. Some discrepancy was observed
between CIs returned by medflex and exact delta CIs for placental abruption. Exact estimates for
the NDE and NIE on the RD scale were found close to corresponding effect estimates obtained
using the quasi-Bayesian approach. Exact bootstrap CIs were observed in better agreement with
CIs returned by the quasi-Bayesian approach in comparison with exact delta CIs.
The exact TE point estimates were found close to the conventional TE estimates for both
exposures and scales. However, the TE decomposition property was markedly not satisfied for
the approximate OR estimates returned by PROC CAUSALMED, e.g. the approximate TE was
2.24*3.03=6.79 for placental abruption while the conventional TE was 5.13.
ORIGINAL
UNEDITED
MANUSCRIPT
Finally, Figure 2 showcases our SAS macro by presenting natural effects on the OR and RD
scales for placental abruption evaluated at two different sets of levels of fetal sex, maternal age
and diabetes statuses.
The data that support the findings of this section are not publicly available because of privacy
and ethical restrictions.
DISCUSSION
In this article, we introduced exact binary-binary regression-based estimators of the natural direct
and indirect effects for the three most commonly used scales in epidemiology, namely the OR,
RR and RD scales. Our work, which is based on the specification of a logistic outcome model,
thus extends previous works that have proposed an exact binary-binary natural effects estimator
on the OR scale. Our exact estimators were observed to be virtually unbiased, regardless of the
effect scale and the rareness or commonness of the outcome. Corresponding standard error
formulas were derived for each scale using first order delta method, thereby providing an
alternative approach for computing confidence intervals (in addition to bootstrap). In our
simulations, for which the sample size was relatively large, both the delta method and the
bootstrap yielded coverage probabilities close to the nominal value. Unlike other mediation
approaches implemented in the simulations and real data analyses, our exact approach was
observed to be numerically stable no matter the effect scale on which results were obtained.
Our investigations have brought additional evidence regarding the performance of the
approximate natural effects OR estimator proposed by Valeri and Vanderweele (3) for binary
mediators and outcomes. As expected, this estimator was found to behave adequately in the
scenario where the outcome was rare in all strata defined by mediator and exposure (Scenario 1),
ORIGINAL
UNEDITED
MANUSCRIPT
while the exact estimator performed comparably or better. In other scenarios investigated
(Scenarios 2-4), in which the outcome was either rare or common marginally but not rare
conditionally, the bias and variance of the approximate estimator were found systematically
larger than those of proposed exact estimator under both multiplicative scales, with large biases
and poor coverage probabilities sometimes exhibited.
Implementation of our proposed exact approach can be done using the SAS macro appended to
this article (Web Appendix 3). By default, the exact NDE and NIE are estimated at the
sample-specific mean values of the adjustment covariates, but our macro also handles user-specified
levels for the entire set of covariates or for some proper subset (in the latter case, our macro sets
the other covariates to the sample mean values). Another functionality of our macro is that it
allows for Firth penalization by calling the Firth option in PROC LOGISTIC. Firth penalization
is a general method designed to reduce bias of the maximum likelihood parameter estimator(32).
This penalization has been shown to be effective in dealing with separation problems in logistic
regression models in presence of small or sparse data(33-35).
Although the NDE and NIE are popular estimands in the applied literature, thecontrolled direct
effect (CDE) can also be of interest to practitioners (36, 37). Valeri and VanderWeele (3)
provided an expression for the CDE on the OR scale derived from logistic regression models for
the mediator and outcome. This expression is not obtained by invoking the ROA and is thus
exact by construction. For completeness, our macro also returns the CDE on all scales considered
(see Web Appendix 1 for our extension to the RR and RD scales).
To conclude, our exact estimator is indicated for those wanting to perform a conventional
binary-binary regression-based mediation analysis in the effect scale of their choice without worrying
ORIGINAL
UNEDITED
MANUSCRIPT
about the rareness or commonness of the outcome. By using the same two fitted logistic models
for all effect scales (OR, RR and RD), our exact approach also simplifies applications and
increases compatibility of mediation analyses results with binary mediators and outcomes. One
limitation of our exact estimator is that it is currently only applicable to data from cohort studies;
more developments will thus be required to extend proposed approach to accommodate data
from case-control study designs in which cases are overrepresented compared to controls.
Moreover, since our work has thus far focused on the case of a single mediator, it will also be
worthwhile to study the multiple mediators case and expand our SAS macro further.
ACKNOWLEDGMENTS
Author affiliations: Department of Mathematics, Université du Québec à Montréal, Montréal,
Canada (Mariia Samoilenko and Geneviève Lefebvre); Faculty of Pharmacy, Université de
Montréal, Montréal, Canada (Geneviève Lefebvre); and Research Center, Centre hospitalier de
l’Université de Montréal, Montréal, Canada (Geneviève Lefebvre).
This work was funded by grants from the Fonds de recherche Québec-Santé (FRQ-S) and the
Natural Sciences and Engineering Research Council of Canada. Geneviève Lefebvre is a FRQ-S
Research Scholar.
Conflict of interest: none declared.
ORIGINAL
UNEDITED
MANUSCRIPT
REFERENCES
1. Loeys T, Moerkerke B, De Smet O, et al. Flexible mediation analysis in the presence of
nonlinear relations: beyond the mediation formula. Multivariate Behav Res. 2013;48(6):871-894.
2. VanderWeele TJ, Vansteelandt S. Odds ratios for mediation analysis for a dichotomous
outcome. Am J Epidemiol. 2010;172(12):1339-1348.
3. Valeri L, Vanderweele TJ. Mediation analysis allowing for exposure-mediator
interactions and causal interpretation: theoretical assumptions and implementation with SAS and
SPSS macros. Psychol Methods. 2013;18(2):137-150.
4. Gaynor SM, Schwartz J, Lin X. Mediation analysis for common binary outcomes. Stat
Med. 2019;38(4):512-529.
5. Tchetgen Tchetgen EJ. A note on formulae for causal mediation analysis in an odds ratio
context. Epidemiol Methods. 2014;2(1):21-31.
6. Yung Y-F, Lamm M, Zhang W. Causal mediation analysis with the CAUSALMED
procedure. SAS Global Forum 2018 Conference: SAS Institute Inc.; 2018.
7. SAS Institute Inc. SAS/STAT® 14.3 User’s Guide. Cary, NC: SAS Institute Inc.; 2017. 8. Emsley R, Liu H. PARAMED: Stata module to perform causal mediation analysis using
parametric regression models. Boston College Department of Economics; 2013.
9. VanderWeele TJ. Explanation in Causal Inference: Methods for Mediation and
Interaction. New York, NY: Oxford University Press; 2015.
10. Feingold A, MacKinnon DP, Capaldi DM. Mediation analysis with binary outcomes:
Direct and indirect effects of pro-alcohol influences on alcohol use disorders. Addict Behav.
2019;94:26-35.
ORIGINAL
UNEDITED
MANUSCRIPT
11. Rijnhart JJM, Twisk JWR, Eekhout I, et al. Comparison of logistic-regression based
methods for simple mediation analysis with a dichotomous outcome variable. BMC Med Res
Methodol. 2019;19(1):19.
12. Samoilenko M, Blais L, Lefebvre G. Comparing logistic and log-binomial models for
causal mediation analyses of binary mediators and rare binary outcomes: evidence to support
cross-checking of mediation results in practice. Observational Studies. 2018(4):193-216
13. VanderWeele TJ, Valeri L, Ananth CV. Counterpoint: Mediation formulas with binary
mediators and outcomes and the "Rare Outcome Assumption". Am J Epidemiol.
2019;188(7):1204-1205.
14. Doretti M, Raggi M, Stanghellini E. Exact parametric causal mediation analysis for a
binary outcome with a binary mediator. arXiv preprint arXiv2:181100439. 2019.
15. Hayes AF, Little TD. Introduction to Mediation, Moderation, and Conditional Process
Analysis: A Regression-based Approach. 2nd ed. New York, NY: The Guilford Press; 2018.
16. The Basic Bootstraps. In: Davison AC, Hinkley DV, editors. Bootstrap Methods and their
Application. Cambridge Series in Statistical and Probabilistic Mathematics. Cambridge, United
Kingdom: Cambridge University Press; 1997. p. 11-69.
17. Efron B, Tibshirani RJ, Tibshirani R. An Introduction to the Bootstrap. London, United
Kingdom: Chapman and Hall; 1993.
18. VanderWeele TJ. Mediation analysis: A practitioner's guide. Annu Rev Public Health.
2016;37:17-32.
19. VanderWeele TJ, Vansteelandt S. Conceptual issues concerning mediation, interventions
and composition. Statistics and its Interface. 2009;2:457-468.
ORIGINAL
UNEDITED
MANUSCRIPT
20. Robins JM, Greenland S. Identifiability and exchangeability for direct and indirect
effects. Epidemiology. 1992;3(2):143-155.
21. De Stavola BL, Daniel RM, Ploubidis GB, et al. Mediation analysis with intermediate
confounding: structural equation modeling viewed through the causal inference lens. Am J
Epidemiol. 2015;181(1):64-80.
22. Wang A, Arah OA. G-computation demonstration in causal mediation analysis. Eur J
Epidemiol. 2015;30(10):1119-1127.
23. Oberg AS, VanderWeele TJ, Almqvist C, et al. Pregnancy complications following
fertility treatment-disentangling the role of multiple gestation. Int J Epidemiol.
2018;47(4):1333-1342.
24. Lange T, Vansteelandt S, Bekaert M. A simple unified approach for estimating natural
direct and indirect effects. Am J Epidemiol. 2012;176(3):190-195.
25. Lange T, Hansen KW, Sørensen R, et al. Applied mediation analyses: a review and
tutorial. Epidemiol Health. 2017;39:e2017035.
26. Steen J, Loeys T, Moerkerke B, et al. medflex: An R package for flexible mediation
analysis using natural effect models. Journal of Statistical Software. 2017;76(11):1-46.
27. Imai K, Keele L, Tingley D. A general approach to causal mediation analysis. Psychol
Methods. 2010;15(4):309-334.
28. Tingley D, Yamamoto T, Hirose K, et al. Mediation: R package for causal mediation
analysis. Journal of Statistical Software. 2014;59(5):1-38.
29. Chernick MR. Bootstrap Methods: A Guide for Practitioners and Researchers. 2nd ed.
Hoboken, NJ: John Wiley & Sons; 2011.
ORIGINAL
UNEDITED
MANUSCRIPT
30. Liang K-Y, Zeger SL. Longitudinal data analysis using generalized linear models.
Biometrika. 1986;73(1):13-22.
31. Starkopf L, Andersen M, Gerds T, et al. Comparison of five software solutions to
mediation analysis. University of Copenhagen; 2017.
32. Firth D. Bias reduction of maximum likelihood estimates. Biometrika. 1993;80(1):27-38.
33. Heinze G, Schemper M. A solution to the problem of separation in logistic regression.
Stat Med. 2002;21(16):2409-2419.
34. Mansournia MA, Geroldinger A, Greenland S, et al. Separation in logistic regression:
causes, consequences, and control. Am J Epidemiol. 2018;187(4):864-870.
35. Allison PD. Logistic Regression Using SAS: Theory and Application. 2nd ed. Cary, NC:
SAS Institute; 2012.
36. VanderWeele TJ. Controlled direct and mediated effects: definition, identification and
bounds. Scand Stat Theory Appl. 2011;38(3):551-563.
37. Imai K, Tingley D, Yamamoto T. Experimental designs for identifying causal
mechanisms. Journal of the Royal Statistical Society: Series A (Statistics in Society).
2013;176(1):5-51.
ORIGINAL
UNEDITED
MANUSCRIPT
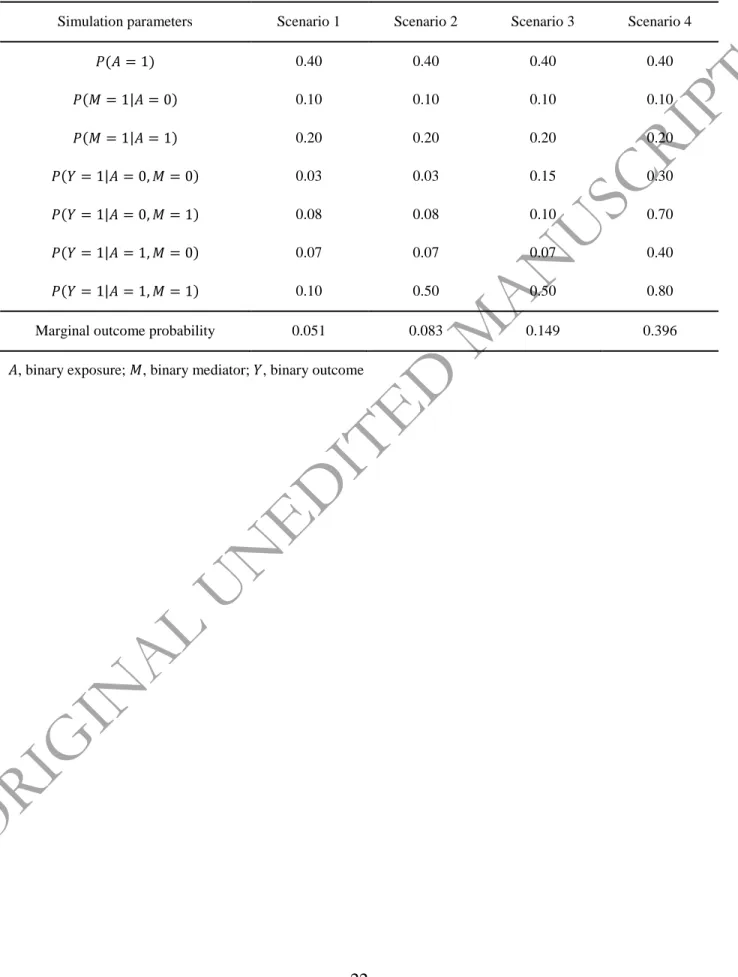
Table 1. Data Generating Mechanisms for the Simulation Study Without Covariates
Simulation parameters Scenario 1 Scenario 2 Scenario 3 Scenario 4
0.40 0.40 0.40 0.40 | 0.10 0.10 0.10 0.10 | 0.20 0.20 0.20 0.20 | 0.03 0.03 0.15 0.30 | 0.08 0.08 0.10 0.70 | 0.07 0.07 0.07 0.40 | 0.10 0.50 0.50 0.80
Marginal outcome probability 0.051 0.083 0.149 0.396 , binary exposure; , binary mediator; , binary outcome
ORIGINAL
UNEDITED
MANUSCRIPT
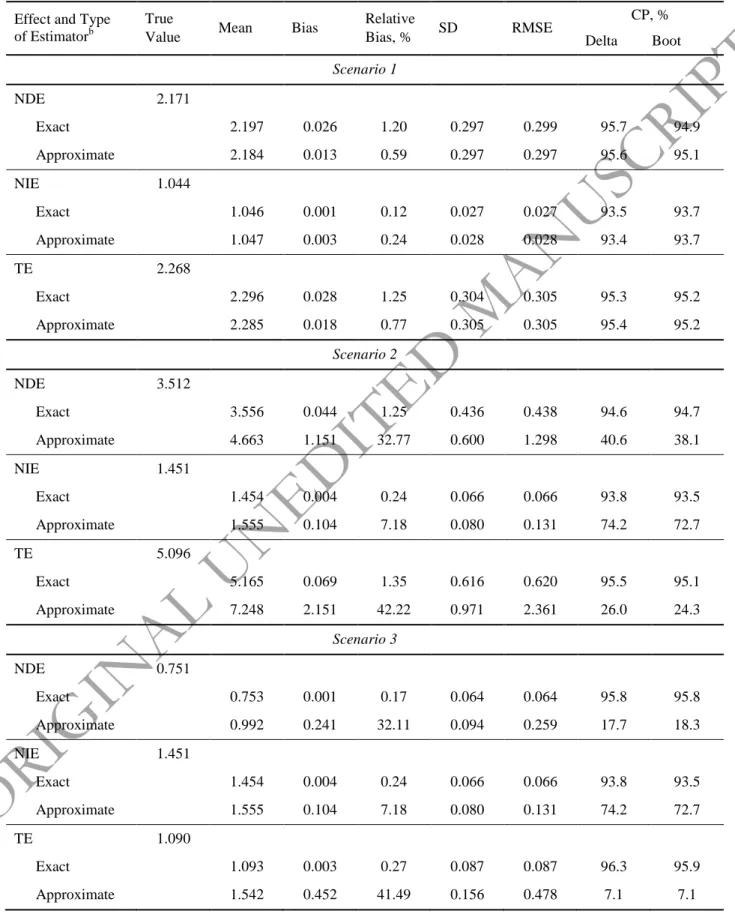
Table 2. Simulation Study Without Covariatesa: Exact and Approximate Natural Effects Estimators on the OR Scale by Scenarios With Increasing Outcome Commonness
Effect and Type of Estimatorb
True
Value Mean Bias
Relative Bias, % SD RMSE CP, % Delta Boot Scenario 1 NDE 2.171 Exact 2.197 0.026 1.20 0.297 0.299 95.7 94.9 Approximate 2.184 0.013 0.59 0.297 0.297 95.6 95.1 NIE 1.044 Exact 1.046 0.001 0.12 0.027 0.027 93.5 93.7 Approximate 1.047 0.003 0.24 0.028 0.028 93.4 93.7 TE 2.268 Exact 2.296 0.028 1.25 0.304 0.305 95.3 95.2 Approximate 2.285 0.018 0.77 0.305 0.305 95.4 95.2 Scenario 2 NDE 3.512 Exact 3.556 0.044 1.25 0.436 0.438 94.6 94.7 Approximate 4.663 1.151 32.77 0.600 1.298 40.6 38.1 NIE 1.451 Exact 1.454 0.004 0.24 0.066 0.066 93.8 93.5 Approximate 1.555 0.104 7.18 0.080 0.131 74.2 72.7 TE 5.096 Exact 5.165 0.069 1.35 0.616 0.620 95.5 95.1 Approximate 7.248 2.151 42.22 0.971 2.361 26.0 24.3 Scenario 3 NDE 0.751 Exact 0.753 0.001 0.17 0.064 0.064 95.8 95.8 Approximate 0.992 0.241 32.11 0.094 0.259 17.7 18.3 NIE 1.451 Exact 1.454 0.004 0.24 0.066 0.066 93.8 93.5 Approximate 1.555 0.104 7.18 0.080 0.131 74.2 72.7 TE 1.090 Exact 1.093 0.003 0.27 0.087 0.087 96.3 95.9 Approximate 1.542 0.452 41.49 0.156 0.478 7.1 7.1
ORIGINAL
UNEDITED
MANUSCRIPT
Scenario 4 NDE 1.525 Exact 1.525 -0.001 -0.04 0.090 0.090 95.3 95.3 Approximate 1.616 0.091 5.97 0.129 0.158 90.8 90.1 NIE 1.175 Exact 1.175 0.000 0.02 0.023 0.023 94.7 95.1 Approximate 1.335 0.160 13.61 0.052 0.168 6.3 5.2 NDE 1.792 Exact 1.791 -0.001 -0.04 0.105 0.105 95.4 95.5 Approximate 2.159 0.367 20.49 0.210 0.423 56.1 53.1 Abbreviations: CP, coverage probability; NDE, natural direct effect; NIE, natural indirect effect; OR, odds ratio; RMSE, root mean square error; SD, standard deviation; TE, total effect.
a: Simulation study based on 1000 independent samples of size n=5000; b
: exact: exact estimator proposed; approximate: approximate estimator by Valeri and Vanderweele (3).
ORIGINAL
UNEDITED
MANUSCRIPT
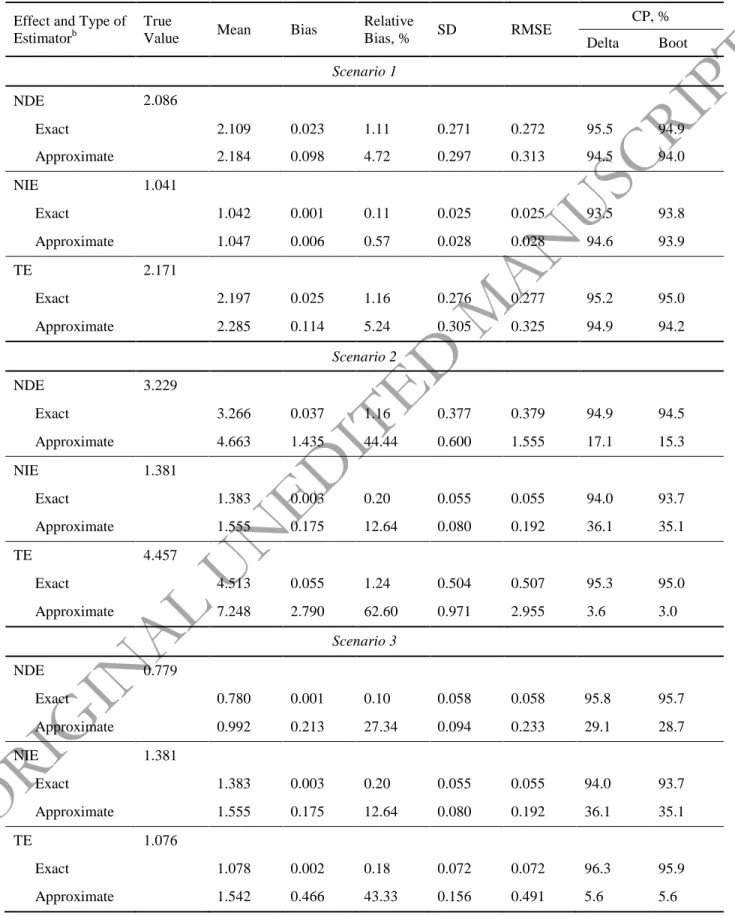
Table 3. Simulation Study Without Covariatesa: Exact and Approximate Natural Effects Estimators on the RR Scale by Scenarios With Increasing Outcome Commonness
Effect and Type of Estimatorb
True
Value Mean Bias
Relative Bias, % SD RMSE CP, % Delta Boot Scenario 1 NDE 2.086 Exact 2.109 0.023 1.11 0.271 0.272 95.5 94.9 Approximate 2.184 0.098 4.72 0.297 0.313 94.5 94.0 NIE 1.041 Exact 1.042 0.001 0.11 0.025 0.025 93.5 93.8 Approximate 1.047 0.006 0.57 0.028 0.028 94.6 93.9 TE 2.171 Exact 2.197 0.025 1.16 0.276 0.277 95.2 95.0 Approximate 2.285 0.114 5.24 0.305 0.325 94.9 94.2 Scenario 2 NDE 3.229 Exact 3.266 0.037 1.16 0.377 0.379 94.9 94.5 Approximate 4.663 1.435 44.44 0.600 1.555 17.1 15.3 NIE 1.381 Exact 1.383 0.003 0.20 0.055 0.055 94.0 93.7 Approximate 1.555 0.175 12.64 0.080 0.192 36.1 35.1 TE 4.457 Exact 4.513 0.055 1.24 0.504 0.507 95.3 95.0 Approximate 7.248 2.790 62.60 0.971 2.955 3.6 3.0 Scenario 3 NDE 0.779 Exact 0.780 0.001 0.10 0.058 0.058 95.8 95.7 Approximate 0.992 0.213 27.34 0.094 0.233 29.1 28.7 NIE 1.381 Exact 1.383 0.003 0.20 0.055 0.055 94.0 93.7 Approximate 1.555 0.175 12.64 0.080 0.192 36.1 35.1 TE 1.076 Exact 1.078 0.002 0.18 0.072 0.072 96.3 95.9 Approximate 1.542 0.466 43.33 0.156 0.491 5.6 5.6
ORIGINAL
UNEDITED
MANUSCRIPT
Scenario 4 NDE 1.294 Exact 1.293 -0.001 -0.08 0.046 0.046 95.2 95.2 Approximate 1.616 0.322 24.89 0.129 0.347 20.9 22.1 NIE 1.091 Exact 1.091 0.000 0.01 0.012 0.012 94.6 95.1 Approximate 1.335 0.244 22.35 0.052 0.249 0.0 0.0 TE 1.412 Exact 1.411 -0.001 -0.08 0.048 0.048 95.5 95.4 Approximate 2.159 0.747 52.93 0.210 0.776 0.7 0.7 Abbreviations: CP, coverage probability; NDE, natural direct effect; NIE, natural indirect effect; RMSE, root mean square error; RR, risk ratio; SD, standard deviation; TE, total effect.
a: Simulation study based on 1000 independent samples of size n=5000;
b: exact: exact estimator proposed; approximate: approximate estimator by Valeri and Vanderweele (3).
ORIGINAL
UNEDITED
MANUSCRIPT
Table 4. Simulation Study Without Covariatesa: Natural Effects Estimators on the RD Scale by Scenarios With Increasing Outcome Commonness
Effect and Type of Estimatorb
True
Value Mean Bias
Relative Bias, % SD RMSE CP, % Delta/ Robust SEc Boot Scenario 1 NDE 0.038 Exact 0.038 0.000 0.04 0.007 0.007 95.8 95.4 Mediation 0.038 0.000 0.16 0.007 0.007 95.8 NIE 0.003 Exact 0.003 0.000 1.26 0.002 0.002 93.7 93.3 Mediation 0.003 0.000 3.81 0.002 0.002 94.4 TE 0.041 Exact 0.041 0.000 0.13 0.007 0.007 96.1 95.8 Mediation 0.041 0.000 0.42 0.007 0.007 95.8 Scenario 2 NDE 0.078 Exact 0.078 0.000 0.07 0.007 0.007 95.4 95.1 Mediation 0.078 0.000 0.06 0.007 0.007 95.4 NIE 0.043 Exact 0.043 0.000 0.27 0.005 0.005 94.3 94.2 Mediation 0.043 0.000 0.25 0.005 0.005 97.4 TE 0.121 Exact 0.121 0.000 0.14 0.009 0.009 95.9 95.8 Mediation 0.121 0.000 0.13 0.009 0.009 96.8 Scenario 3 NDE -0.032 Exact -0.032 -0.000 0.39 0.009 0.009 95.8 95.4 Mediation -0.032 -0.000 0.22 0.009 0.009 96.0 NIE 0.043 Exact 0.043 0.000 0.27 0.005 0.005 94.3 94.2 Mediation 0.043 0.000 0.25 0.005 0.005 97.5 TE 0.011 Exact 0.011 -0.000 -0.10 0.010 0.010 96.4 96.0 Mediation 0.011 0.000 0.33 0.010 0.010 96.8
ORIGINAL
UNEDITED
MANUSCRIPT
Scenario 4 NDE 0.10 Exact 0.099 -0.001 -0.50 0.014 0.014 95.0 95.4 Mediation 0.099 -0.000 -0.52 0.014 0.014 95.0 NIE 0.04 Exact 0.040 -0.000 -0.06 0.005 0.005 94.6 95.2 Mediation 0.040 -0.000 -0.21 0.005 0.005 97.5 TE 0.14 Exact 0.139 -0.001 -0.38 0.014 0.014 95.4 95.2 Mediation 0.139 -0.001 -0.43 0.014 0.014 96.0
Abbreviations: CP, coverage probability; NDE, natural direct effect; NIE, natural indirect effect; RD, risk difference; RMSE, root mean square error; SD, standard deviation; SE, standard error; TE, total effect.
a
: Simulation study based on 1000 independent samples of size n=5000;
b: exact: exact estimator proposed; mediation: quasi-Bayesian approach by Imai et al. (27) implemented in the R
package mediation (28).
c: Delta method for exact estimator; for mediation, the 95% CIs were based on the White’s
heteroskedasticity-consistent estimator for the covariance matrix (28).
ORIGINAL
UNEDITED
MANUSCRIPT
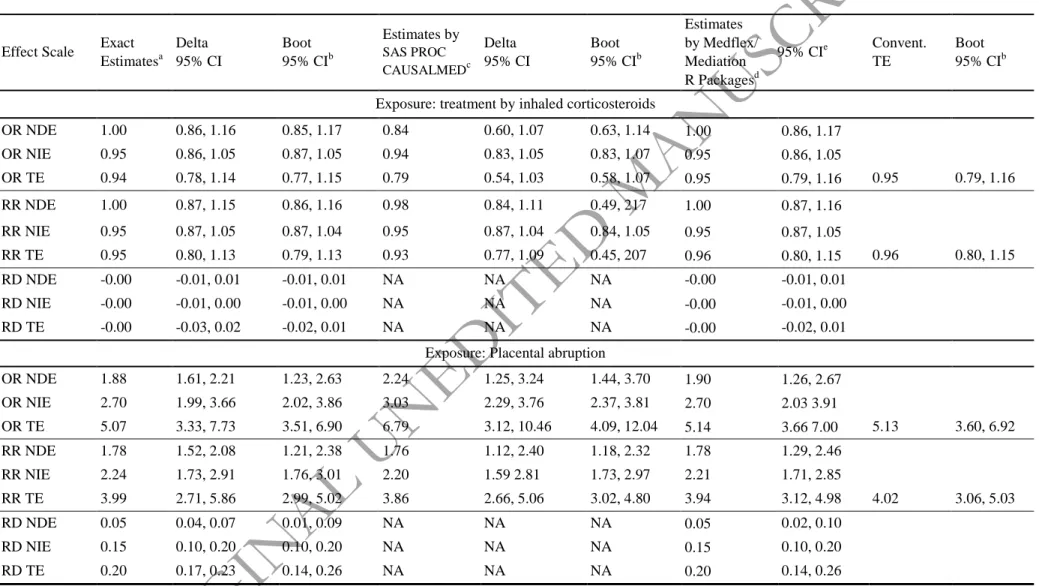
Table 5. Real Data Example: Comparison Between Natural Direct and Indirect Effect Estimates on the OR, RR and RD Scales Obtained
From Exact Estimator and Existing Estimators Available in Software
Effect Scale Exact Estimatesa Delta 95% CI Boot 95% CIb Estimates by SAS PROC CAUSALMEDc Delta 95% CI Boot 95% CIb Estimates by Medflex/ Mediation R Packagesd 95% CIe Convent. TE Boot 95% CIb
Exposure: treatment by inhaled corticosteroids
OR NDE 1.00 0.86, 1.16 0.85, 1.17 0.84 0.60, 1.07 0.63, 1.14 1.00 0.86, 1.17 OR NIE 0.95 0.86, 1.05 0.87, 1.05 0.94 0.83, 1.05 0.83, 1.07 0.95 0.86, 1.05 OR TE 0.94 0.78, 1.14 0.77, 1.15 0.79 0.54, 1.03 0.58, 1.07 0.95 0.79, 1.16 0.95 0.79, 1.16 RR NDE 1.00 0.87, 1.15 0.86, 1.16 0.98 0.84, 1.11 0.49, 217 1.00 0.87, 1.16 RR NIE 0.95 0.87, 1.05 0.87, 1.04 0.95 0.87, 1.04 0.84, 1.05 0.95 0.87, 1.05 RR TE 0.95 0.80, 1.13 0.79, 1.13 0.93 0.77, 1.09 0.45, 207 0.96 0.80, 1.15 0.96 0.80, 1.15 RD NDE -0.00 -0.01, 0.01 -0.01, 0.01 NA NA NA -0.00 -0.01, 0.01 RD NIE -0.00 -0.01, 0.00 -0.01, 0.00 NA NA NA -0.00 -0.01, 0.00 RD TE -0.00 -0.03, 0.02 -0.02, 0.01 NA NA NA -0.00 -0.02, 0.01
Exposure: Placental abruption
OR NDE 1.88 1.61, 2.21 1.23, 2.63 2.24 1.25, 3.24 1.44, 3.70 1.90 1.26, 2.67 OR NIE 2.70 1.99, 3.66 2.02, 3.86 3.03 2.29, 3.76 2.37, 3.81 2.70 2.03 3.91 OR TE 5.07 3.33, 7.73 3.51, 6.90 6.79 3.12, 10.46 4.09, 12.04 5.14 3.66 7.00 5.13 3.60, 6.92 RR NDE 1.78 1.52, 2.08 1.21, 2.38 1.76 1.12, 2.40 1.18, 2.32 1.78 1.29, 2.46 RR NIE 2.24 1.73, 2.91 1.76, 3.01 2.20 1.59 2.81 1.73, 2.97 2.21 1.71, 2.85 RR TE 3.99 2.71, 5.86 2.99, 5.02 3.86 2.66, 5.06 3.02, 4.80 3.94 3.12, 4.98 4.02 3.06, 5.03 RD NDE 0.05 0.04, 0.07 0.01, 0.09 NA NA NA 0.05 0.02, 0.10 RD NIE 0.15 0.10, 0.20 0.10, 0.20 NA NA NA 0.15 0.10, 0.20 RD TE 0.20 0.17, 0.23 0.14, 0.26 NA NA NA 0.20 0.14, 0.26
Abbreviations: CI, confidence interval; NDE, natural direct effect; NIE, natural indirect effect; OR, odds ratio; RD, risk difference; RR, risk ratio; TE, total effect.
a
: Estimates returned by SAS macro mediation_estimates (see Web Appendix 3);
b: Percentile bootstrap based on 1000 resamples with replacement;
ORIGINAL
UNEDITED
MANUSCRIPT
c: SAS procedure based on the approximate estimator by Valeri and Vanderweele (3);
d: medflex: natural effect models approach (24)using weighting method implemented in the R package medflex(26); mediation: quasi-Bayesian approach by Imai et al. (27) implemented in the R package mediation (28);
e: See Appendix for details.
ORIGINAL
UNEDITED
MANUSCRIPT
Figure 1. Real data example: comparison between natural direct effect, natural indirect effect
and total effect estimates on the odds ratio scale obtained from exact estimator and existing estimators available in software. Left panel A): mediation analyses with inhaled corticosteroids as exposure variable. Right panel B): mediation analyses with placental abruption as exposure variable. The solid lines present 95% confidence intervals (CIs) obtained by the exact approach using delta method. The dashed and dotted lines correspond to 95% CIs returned by the PROC CAUSALMED SAS procedure (by delta method) and the R package medflex (by percentile bootstrap), respectively. The dot-dash line presents 95% CI for the conventional (non-mediated) total effect (by percentile bootstrap). The bullets provide the effect point estimates; the empty circles correspond to the CI endpoints. NDE, natural direct effect; NIE, natural indirect effect; TE, total effect; CTE, conventional total effect.
Figure 2. Real data example with placental abruption as exposure variable: exact natural direct
effect, natural indirect effect and total effect on the odds ratio (left panel A)) and risk difference (right panel B)) scales evaluated at particular levels of the adjustment covariates. Solid lines correspond to 95% confidence intervals (CIs) given the following set of covariate values: baby’s
sex = girl, maternal age between 18 and 34 years, diabetes mellitus = no, gestational diabetes = no. Dashed lines correspond to 95% CIs when the covariate values are specified as follows: baby’s sex = boy, maternal age under 18 years, diabetes mellitus = no, gestational diabetes = yes. 95% CIs are constructed by percentile bootstrap based on 1000 resamples with replacement.
The bullets provide the effect point estimates; the empty circles correspond to the CI endpoints. NDE, natural direct effect; NIE, natural indirect effect; TE, total effect.