HAL Id: hal-02957560
https://hal.inrae.fr/hal-02957560
Submitted on 5 Oct 2020HAL is a multi-disciplinary open access archive for the deposit and dissemination of sci-entific research documents, whether they are pub-lished or not. The documents may come from teaching and research institutions in France or abroad, or from public or private research centers.
L’archive ouverte pluridisciplinaire HAL, est destinée au dépôt et à la diffusion de documents scientifiques de niveau recherche, publiés ou non, émanant des établissements d’enseignement et de recherche français ou étrangers, des laboratoires publics ou privés.
Distributed under a Creative Commons Attribution - NonCommercial - NoDerivatives| 4.0
organoleptic qualities
Maxime Lecomte
To cite this version:
Maxime Lecomte. Metabolic modeling for the optimization of cheese’s organoleptic qualities. Food engineering. 2020. �hal-02957560�
of cheese’s organoleptic qualities
Metabolic Metro Map, taken from1
Author : Maxime Lecomte
Co-supervisors: Clémence Frioux
2research fellow at Inria BSO and Simon
Labarthe
3research fellow at Inrae BioGeCo and MaIAGE
Master in Computational Biology
Promotion 2019-2020
University of Bordeaux
September 2, 2020
1
By Chakazul - Own work, CC BY-SA 4.0, https://commons.wikimedia.org/w/index.php?curid=49151925
2
clemence.frioux@inria.fr
3
Acknowledgements
I would like to thanks every person who supported me during this internship and contributed
to its results.
First of all, I am extremely grateful to my co-advisors, Clémence Frioux, research fellow
at Inria Bordeaux Sud-Ouest and Simon Labarthe, research fellow at INRAE Cestas Biogeco
and MaIAGE, for assisting me, their advice, the experience shared with me and their active
presence during the lockdown.
I sincerely thank David Sherman group leader of Pleiade team and Hélène Falentin,
re-searcher at INRAE (STLO), for their help during the internship and for their support through
PhD application.
I would like to thank teams of Pleiade at Inria BSO and INRAE UMR STLO of Rennes
and INRAE Biogeco Cestas for their investment and their expertise during the internship. In
addition, I am grateful to Clémence Frioux, Simon Labarthe and Hélène Falentin for their help
Contents
Acknowledgements 2
Abstract 5
Introduction 6
Biological context . . . 6
cheese manufactured at pilote-scale . . . 6
Main features of bacterial metabolism during cheese production. . . 7
Experimental design of the TANGO project . . . 8
Community modeling . . . 10
Interactions . . . 10
How to model them? . . . 11
Modeling the bacterial metabolism . . . 12
Metabolic network . . . 12
Metabolic network reconstruction . . . 13
Mathematical models of metabolism . . . 15
Dynamic modeling using ODE . . . 18
Materials & Methods 20 GEM reconstruction . . . 20
FBA model construction and assessment . . . 21
Omics data integration . . . 24
Software availability . . . 26
Results 27 Genome scale metabolic network Model (GEMs) reconstruction . . . 27
Interest of three different annotations tools . . . 27
Draft models . . . 27
Gap-filling and curation . . . 29
Focus on organoleptic compounds . . . 30
At genome scale . . . 30
At community scale . . . 30
Community model . . . 35
Discussion 37
Conclusion 40
References 41
Abstract
The cheese production industry has a great interest into understanding and controlling the
croorganisms in these fermented products. The TANGO project focuses on the study of a
mi-crobial systems consisting of three bacteria in order to understand the molecular mechanisms
involved in cheese flavour and their dependence to cheese production techniques. This project
therefore designed a experimental setup of four cheese production techniques with one
spe-cific parameter modified in each. Multi-omics data was generated for each experiment to help
answer the biological questions. The computational biology part of the TANGO project was
dedicated to modeling the metabolism mechanisms related to the production of organoleptic
molecules by a consortium of three bacteria in cheese in the four experimental settings. I
de-velopped a pipeline to reconstruct genome-scale metabolic networks for each bacterium using
heterogenous methods. I built mathematical models of the individual metabolism, identified
production pathways and characterized putative interactions. I relied on graph-based and
flux-based formalisms to provide predictions for the production of organoleptic compounds. Finally
I built a dynamic model of the community to predict the relationship between growth, limiting
substrate consumption and organoleptic compounds production. This study constitutes a first
step into understanding the impact of cheese production techniques on the metabolism using
modelling.
key words: Metabolic networks, bacteria, multi-omics, interactins, mathematical models,
Introduction
My internship took place in Bordeaux at INRAE Biogeco and Inria Pleiade laboratories. My
work was related to the TANGO project, funded by the CNIEL, an organization of
representa-tives of the dairy industry. The TANGO project aimed at deciphering the bacterial mechanisms
involved in the metabolism of organoleptic coumpounds during cheese production for
assess-ing their controllability through different production processes. To reach this goal, genomic
and meta-omic data are available to construct a metabolic model of the bacterial community
involved in cheese processing. I will first sketch the biological context, i.e. generalities about
cheese production, lactic bacteria main functions involved in cheese production, and I will
introduce the modeling framework that was used during the project.
Biological context
Cheese manufactured at pilote-scale [38]
The pre-processing of this cheese production starts with the collection of milk by the farmer,
before its storage in a fridge (at four degrees) to control the amount of bacteria inside, up
to seventy-two hours. The milk is checked by several analyses to guaranty its organoleptics
properties and keep the right sanitation for the consumer. After that, the milk is collected and
transported to the factory. Between these two steps, a quality check is done.
At this stage, milk is in the factory and its transformation begins (figure 1). First, the milk
is skimmed to reduce its fat content. Pasteurizing the milk removes all harmful bacteria for
human by heating fifteen seconds at seventy-two degrees. Once the milk is treated, the
cur-dling process is triggered by adding lactic ferments and rennet, inducing a semi-solidification
of the milk. A slicing step is added, in order to cut the curds to improve draining, which
prevent cheese acidity. Moulding and pressuring are later performed to separate the curds
from the whey, continue the draining and shape the cheese, which improves cheese
preser-vation. De-moulding follows. Then, to control the development of microorganisms and the
product preservation, the cheese is salted or bathed in a brine (brining step), which completes
the draining process and improves taste and preservation. Then, the cheese is washed and
vacuum-packed to prevent rind formation and transferred in a ripening room. Finally, ageing
be the longest one, up to months.
Figure 1: process of production of a cheese in standard way (from [38])
Main features of bacterial metabolism during cheese production.
During the cheese production, lactic ferments and rennet are added [39]. These lactic ferments
are micro-organisms that help to transform milk into milk-derived products thanks to the
fer-mentation process. It consists in a succession of natural biochemical reactions catalyzed by
lactic bacteria enzymes, that provide texture and taste properties. Lactic bacteria uptake sugar
in the milk (lactose) and produce lactate (lactic acid), ensuring acidification and coagulation
of the milk. In addition to the lactic bacteria, others microorganisms, designed as ripening
species, can be added to the cheese to reach the desired taste and texture.
Three bacterial species compose the community in the cheese under study in the TANGO
project : Lactococcus lactis, Lactobacillus plantarum and Propionibacterium freudenreichii. L.
lactis, and L. plantarum are lactic bacteria that produce similar metabolites such as L-Lactate (lactic acid), diacetyl and acetoin, two organoleptic compounds participating to the flavour of
the cheese [35]. Some features differentiate them, for example, in the bacteria lysis
mecha-nism [53]. At the opposite, P. freudenreichii is characterized by propionate synthesis, giving
cheese a mild taste, and is very relevant in the production of volatile compounds involved in
the flavour of cheese[52]. It is considered here as a ripening specie, providing an old-cheese
taste.
com-munity also uptake other nutriments in milk to produce organoleptic compounds, such as
amino acid, carbon sources, proteins. . .4[33][48]. We want to understand the mechanisms
un-derlying the production of these organoleptic compounds during the fermentation step (figure
2). It is during the maturation of the cheese (figure 1) that bacteria get an optimal growth, and,
that cheese develop its organoleptic properties. More precisely,L. lactis starts to grow
expo-nentially just after inoculation whereas L. plantarum growth is slightly delayed and slower,
with an optimal growth between renneting and ripening. P. freudenreichii growth follows L.
plantarum one, with a stronger increase during ripening.
Figure 2: Representation of bacterial fermentation, responsible of the organoleptic quality of
the cheese during its production.
Experimental design of the TANGO project
TANGO is a pluridisciplinary research project aiming at assessing the impact of technological
processes on the bacterial activity to control the flavour of cheese, that is, its organoleptic
qualities. Different processes of cheese production have been tested, and the resulting bacterial
activity has been monitored by multiomics experiments. A standardized production process
was first defined to be used as control experiment, with the following characteristics: pH at
6.5, 30 minutes of slicing, 10 hours of brining and maturation at 13 °C. Three other production
processes were set, by altering parameters susceptible to impact the bacterial activity: the first
one reduced the slicing time by 15 minutes, thereby modifying the texture of the curd and
their humidity, the second one reduced the brining time by 3h, thereby modifying salt levels,
and the last one enhanced the maturation temperature by 3°C (table 1).
RNA was extracted at different time points (moulding, demolding, end of brining, and
after four and seven weeks of maturation), to produce a metatranscriptomic time-serie.
Bac-terial counts were obtained at each time step by plating techniques. Cheese samples were
4
standardized process modified processes data
Control ST- BT- MT+
Curdling pH6.5 ø ø ø
Slicing time 30min x (-15 min) ø ø Bacterial genomes Bacterial counting Meta-transcriptomics
Metabolomics
Moulding and draining ø ø ø
Brining 10h ø x (-3h) ø
Maturation 13°C ø ø x (+3°C)
Table 1:Experimental design. ST- : reduced slicing time. BT- : reduced brining time. MT+ :
enhanced maturation temperature.
analyzed with liquid and gaz chromatographies at the end of maturation to identify volatile
and non volatile organoleptic compounds (metabolomic data). A multi-omic
(metatranscrip-tomics, metabolomics and microbial counts) dataset is obtained, providing information about
gene expression, bacterial dynamics and organoleptic compound productions. The goal is to
find production parameters which rule bacterial activity and the resulting organoleptic
prop-erties of the cheese.
The goal of the bioinformatic part is to infer the metabolism of the three bacteria involved
in the cheese production from their genomes and to use this knowledge to interpret the data,
specifically the link between metatranscriptomic and metabolomic data. The objectives of the
internship are to model the dynamics of the bacterial community and to calibrate the model
with the multiomic data of the TANGO project. Our approach is to model at genome scale the
metabolism of each bacterium and to combine them to build a community model. This project
aims at characterizing putative interactions (metabolic exchanges) within the communities,
involved in community-wide metabolic pathways producing organoleptic compounds.
In order to answer to the scientific questions of the project, a collaboration between INRAE
atUMR STLO Rennes, UMR BIOGECO Bordeaux and Inria Bordeaux Sud Ouest has been created.
Each institute brings expertise topics such as microbial ecology, biochemistry or mathematical
formalism.
A brief review of microbial ecology concepts and community modeling will follow, in order
Community modeling
A microbiota is a set of micro-organisms which live in a microbiome and can be found on the
skin, in the gut, in fermented products, in plants. . . A microbiome defines a habitat which
includes a set of micro-organisms, their genomes and all environmental conditions. They can
play a relevant role in health and disease [34]. In the example of cheese, we can find
dif-ferent microbial communities with difdif-ferent richness. Communities used in industrial cheese
production are controlled, meaning that the bacteria composing the community are selected
and well characterized. On the contrary, communities found in craft cheeses, such as ’AOC’
cheeses, are said uncontrolled, since they involve very diverse taxa, resulting in a very rich
and complex biodiversity. In this two types of communities, interactions between organisms
structure the community dynamics. This structure can be explained by its difference species
composition, nutritional environment or environmental conditions[49].
Interactions
Interactions within communities can be characterized by cross-feeding or pathway
comple-tion (metabolic interaccomple-tion) [6] or exchanges between one, or several species. There exists
many types of interactions[26]. First of all, competition where different bacterial species can
consume the same nutrients (Scramble competition [20]) for their own growth. In the TANGO
project, we know thatL. lactis and L. plantarum produce lactic acid which is metabolized by P.
freudenreichii, thereby, both lactic bacteria could be competing for lactose. Another competi-tion interaccompeti-tion is the produccompeti-tion of an antagonist by one species which inhibits the growth of
another (e.g. Bacteriocins interaction [20]). Secondly, mutualism can stimulate the growth or
survival of one or more species by very complex interactions by providing shelter, nutriments
[54], or even, by participating of the production of a precursor. These can also be described
as cooperation. Thirdly, commensalism which occurs when one species gains benefits while
another species neither benefits nor is harmed. It is the opposite of amenalism where a first
specie is harmed or killed by a second, while the second is unaffected by the first. Predation
occurs when one species benefits while the other is harmed. In the end, neutral interaction
re-sult in no gain nor loose for the species involved in the interaction process. Figure 3 describes
Figure 3: Possible bacterial interactions within a bacterial community. The letterα designates the effect of a specie on an another in an interaction matrix, for example in a generalized
lotka-voltera model ( figure adapted from [7])
How to model them?
There are three main ways to model communities :co-occurence networks, Genome-scale metabolic
Models (GEMs), and Dynamic models (e.g. Ordinary Differencial Equation (ODE) or stochastic individual based models). Each methods provides complementary information.
Firstly, co-occurrence networks seek at identifying repetitive patterns inside species
dis-tributions of different samples of comparable communities and thus, at searching species that
co-fluctuate together. They enable us to characterize interactions or to classify communities
and their members [55] but do not provide information on the underlying interaction
mech-anisms[28]. Co-occurence is generally used on complex communities whose composition is
determined by metabarcoding methods[9], and with a large amount of replicates for each
ex-perience. In the case of TANGO, only three bacteria and two replicates are available, that is
why this technique is not used.
Secondly, Genome-scale metabolic Models or GEMs are mathematical models built on
models can also integrate multi-omics data and enzyme kinetics [5] [25]. Gathering the whole
set of GPR included in the three bacterial genomes and organizing them in three GEMs could
allow us to link the metabolites of the milk to the organoleptic compounds produced by the
bacteria. One objective is to decipher the metabolic pathways that are activated during
bacte-rial growth in cheese production.
Finally, dynamic models such asOrdinary Differencial Equation (ODE), enable us to predict
the dynamics of metabolite concentrations and bacterial levels based on known metabolite
flux distribution [32]. ODEs can be built upon GEMs, resulting in dynamic GEMs. ODEs can
also involve simplified metabolic models, resulting in so called kinetic models. Kinetic models
can be seen as a simplification of dynamic GEMs models. The model is built in relation with
a given biological context, and its accuracy and the level of details introduced in the model
depend on the underlying biological question. There are many possible models to simulate a
community, such as prey-predator models or generalized Lotka-Volterra models.
Understand-ing the metabolic fluxes in the GEMs can be a basis to build a dynamic model for quantifyUnderstand-ing
the dynamics of organoleptic compounds shaping the cheese flavour.
Modeling the bacterial metabolism
Metabolic networks
Metabolites play an important role, like the regulation of the phenotype [2] of the organism
un-der environmental conditions[41]. A metabolic network consists in a set of metabolites
inter-connected by biochemical reactions which are catalyzed by enzymes. Genome scale metabolic
networks encompass all gene-protein-reaction (GPR) associations retrieved from the genome
of organism[16]. Reactions involve metabolites, that are either substrates or products such as
the 6PFRUCTPHOS-RXN, reaction of the glycolysis pathway, which uses :
1β − D − F F 6P + 1AT P → 1β − D − F 1, 6B + 1ADP + 1H+
where FF6P corresponds to fructofuranose-6-phosphate, and F1,6B to fructose-1,6-bisphosphate.
Terms on the left of the equation are substrates and those on the right are products. The
num-ber in front of each metabolites corresponds to the stoichiometry of this molecule. This
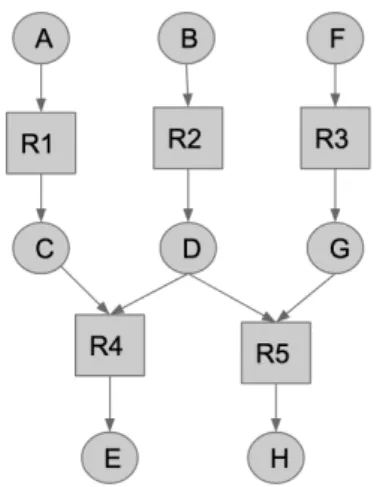
A metabolic network can be represented as a bipartite graph (figure 4), in which two types
of nodes are represented : nodes corresponding to metabolites (circle in figure 4) and nodes
of reactions (square in figure 4). Reactions-metabolites relationships can also be represented
with a stoichiometric matrix where rows describe reactions, columns describe metabolites and
values depict the stoichiometry of metabolites in reactions. Table 2 represents the
stoichio-metric matrix of the network in figure 4.
Figure 4: Example of metabolic
net-work represented as a graph. Circle
represents a metabolite, square a
re-action A B C D E F G H R1 -1 0 1 0 0 0 0 0 R2 0 -1 0 1 0 0 0 0 R3 0 0 0 0 0 -1 1 0 R4 0 0 -1 -1 1 0 0 0 R5 0 0 0 -1 0 0 -1 1
Table 2: Example of metabolic network
repre-sented as a stoichiometry matrix S. Rows
de-scribe reactions, columns metabolites and
val-ues the stoichiometry of metabolmite in a
reac-tion
Metabolic network reconstruction
The reconstruction of a metabolic network is an important and time-consuming part of metabolic
modeling. It consists in four big steps : annotation of the genome, drafts reconstruction,
gap-filling and curation.
The first step is to annotate, functionally and structurally, the entire genome by using
database and/or experiments in laboratory[50]. A database allows storing and retrieving all
raw data corresponding to a specific entity. For instance, functional annotation can consist
in finding gene ontology [24](GO) terms, source of information about gene function whereas
structural annotation consists in identifying coding region in DNA. At the end of this process,
functional genes and their associated enzymes (represented by an EC-number) are identified
workflow of this step. Several tools exist such as MERLIN5[10] which uses ModelSEED6[46] or
BIGG database7[45], or carveMe [30] which proposes lots of tools such as gapfilling but uses
the minimal constrains in the gapfilling process by minimizing the number of added reactions
within models or PathwayTools [23] and the MetaCyc8[8] databases. These tools can link
EC-number, found in the previous step, to reactions in databases, get its substrates and products
with their associated stoichiometry.
In the pipeline of reconstruction, two steps remain : the gap-filling and the curation.
Gap-filling consists in searching any precursor of a specific target, e.g. biomass reaction, which is
not produced in the metabolic network, and add into the GEMs the necessary reactions from
a database in order to produce the precursors and the target. In the figure 5b, gap-filling is
performed on the metabolite "b" and thus, reaction between "a" and "b" is added. The process of
curation ensures the overall consistency of the model and prevents non physiological behavior
of the model.
At each sub-process of the metabolic network reconstruction, the metabolic network draft
is updated and improved to get at the end a genome scale metabolic network. Next step consists
in building models, for instance identifying the production paths, i.e. in deciphering which
paths are essential to produce a target. Mathematical modeling of the metabolic network will
be used to answer it.
(a) workflow for the automated part of metabolic reconstruc-tion (from [29]). It starts from an annotated genome where EC number-genes associations are retrieved from enzyme or others databases. After confirmation by the literature and/or experiments, we get corresponding reactions to finally build the metabolic network.
(b) gap-filling process (from [44]. (A) example of a metabolic network where reactions are missing. (C) metabolic network in A after gap-filling completion 5 https://merlin-sysbio.org/index.php/Home 6 https://modelseed.org/ 7 http://bigg.ucsd.edu/ 8 https://metacyc.org/
Mathematical models of metabolism
Two techniques are mainly used : topological analysis, based on the network expansion
algo-rithm[11] and the flux balance analysis (FBA), based on the stoichiometry matrix.
On the one hand, the topological analysis is driven by logical rules: the products of
re-actions are producible if all reactants of this reaction are available. Hence, the producibility
is triggered by the presence of nutrients. This mathematical formalism gives only
qualita-tive information, it does not take stoichiometry or production fluxes into account. The result
of the topological analysis can for example lead to identify regulator factors that seem to be
important for the regulation of gene network in response of carbon source [43]. First of all,
nu-tritional environment must be determined. In the case of the cheese production, the set of milk
compounds (see ’The TANGO Project part for more details) represents the seeds. To model
the bacterial growth, metabolites of the biomass function need to be producible from these
seed. In the figure 6a, growth media is represented by the compounds SEEDa and SEEDb, and
the target is the metabolite ’E’. To ensure the product of ’E, reactions ’R4’,’R1’ and ’R2’ need
to be activated, independently of the amount of ’A’,’B’,’C’,D’. The application of the network
expansion algorithm gives us a set of metabolites which are producible or not. Topological
analysis, based on qualitative criterion, was demonstrated to be robust and relevant compared
to FBA [19]. Implementation of this algorithm is available in the series Menetools [1].
On the other hand, FBA is a quantitative modelling, which framework is illustrated in
the figure 6b. It is a mathematical model that enables to compute the fluxes, meaning the
quantity by time unit, of metabolites flowing through the metabolic network [37]. Unlike the
topological analysis, it gives quantitative information by taking into account the stoichiometry
of metabolites within the mathematical model (table 2). An objective function must be chosen
for optimization: for example, to predict cell growth using FBA, a biomass function is needed.
It describes the rate at which all of the biomass precursors are produced to allow 1) an optimal
growth, and 2) stationary metabolite concentrations. This biomass function is represented by
a reaction with macromolecular (DNA, RNA, proteins. . . ), primary and secondary metabolites
[13]. Mathematically, FBA consists first in defining mass balance equations for each metabolite
in the model. It can be defined by
dx dt = S
t
(a) Topology analysis : in red, the set of reactions activated and the scope of metabolites producible from the SEEDa and SEEDb.
(b) Process of FBA problem(from orth et al, 2010[37]). The metabolic network is converted into a stoichiometry matrix (describes in the table 2), then, at steady state (mass balanced define a linear equation) an objective function is defined. Optimize this objective function enable us to predict the max-imum/minimum of growth rate.
Figure 6: rules of each type of analysis
whereS is the stoichiometry matrix, and v represents the vector of fluxes with elements
cor-responding to the fluxes in given reactions (columns) inSt,x is the amount of compounds and
dx/dt is the time rate of concentration variations, andtis matrix transposition. Organisms are
known to maintain internal concentrations as constant as possible by the way of regulation. It
means that the changes of intracellular metabolite concentration occur at very fast rates. This
behavior is very close to the steady-state. At steady state, all metabolite variation ratesdx/dt
equal zero. Thus, the equation becomes
St.V = 0
This linear system is ill-posed: since the number of metabolites has no reason to be
identi-cal to the number of reactions in the model, the matrixS is not square. Hence, FBA aims at
optimizing one objective function under this linear constraint, that can be biologically
inter-preted as mass balance and physico-chemical constraints [27]. The objective function can be
represented by :
Z = ct.v
deter-mined),c is a vector of coefficients,tis the matrix transposition. This process can be scaled up to large scale biology systems [14]. There are multiple implementation of FBA, for instance,
cobraPy [12]
Mathematical techniques for the analys of metabolic pathways ca be derived from the FBA
and topological frameworks : Flux Variability Analysis (FVA) and Menepath. FVA [31] is used
to test the robustness of metabolic networks. It finds the flux range (minimal and maximal flux
values) for a reaction allowing for the same objective function optimum (e.g. optimal biomass
reaction): indeed, different fluxes can be found for the same optimum since metabolic
sub-pathways can be replaced by equivalent alternatives leading to the same consumption and
production fluxes of seeds and targets. FVA can be used in the FBA framework to identify
essential (reaction keeping the same flux across different solutions) and alternative reactions
(reaction with a broad range of possible fluxes). Menepath reaches the similar goal in the
topological framework by finding production paths to produce a particular target. All solutions
can be retrieve as welle as the union and intersection of them. In the case of the figure 7 there
are five reactions necessary forproduicing ’J’, three alternatives ([’Rc’, ’Rd’, ’Re’],[’Rf ’, ’Rg’,
’Rh’][’Ri’, ’Rj’, ’Rk’]) and two essentials(’Rb’ and ’Rj’). Should one alternative path be removed,
’J’ would be still producible, whereas, if one essential reaction is removed, no production of ’J’
will be possible.
Figure 7: Essential and alternative reactions within a metabolic network. It represents several
paths of production, called alternative path marked in red, and mandatory reactions for the
Dynamic modeling using ODE
Dynamic models represent at each time point a concentration or a mass of a specific molecule
or even the population of a species. This dynamics can be modeled usingOrdinary Differential
Equations (ODE). Two techniques is mainly used : Dynamic flux balance analysis (DFBA) and kinetic models. Both can describe the behavior of bacterial communities but using different
ways. DFBA models use FBA models to compute the evolution of the system while kintec
models are based on import/export reaction fluxes and Michaelis Menten term (Explained in
more detailed in materials and methods).
In dynamic models, basics steps are required [42] such as determining which substrates and
products one wants to follow (input / output); defining the rate of each exchange reaction (the
flux of substrate metabolites that are degraded and the resulting fluxes of products), choosing
the regulation mechanism models (for example Michaelis Menten equation will model
satu-ration effects for high concentsatu-rations in the kinetic model while the FBA model will take in
charge the regulation effects in the DFBA) and selecting the appropriate numerical methods
to integrate the ODE in time. To define import and export flux rate of substrates at each time
step, a FBA model can be used, enabling us to define the transformation rate of metabolites
of interest for each bacterium. So, both technique reaches to compute at each time step the
growth of each bacterium, the rate of consumption or production of metabolites depending of
the available nutritional environment.
Figure 8: Results of DFBA and kinetic model ( modified from Goldford et al, science 2018 [17])
In the end, the purpose of my internship is : first, build GEMs for the three bacteria ( Lac-tococcus lactis, Lactobacillus plantarum and Propionibacterium freudenreichii, then, combine the GEMs to build a bacterial community model, secondly, analyse metatranscriptomics and
metabolomics data to decipher the activated pathways at each time steps, and finally, construct
a DFBA model of the community together with a kinetic model approximating the DFBA. Both
Materials & Methods
In the TANGO project, metabolomics, metatranscriptomics, genomics and bacterial counts
data are used to measure the activity of the bacteria, their gene expressions, and also, to
recon-struct metabolic networks. Moreover, bacteria live in a nutritional environmental or growth
media that needs to be characterized for modeling. These seeds correspond to compounds
of the milk (amino-acids, vitamins, proteins. . . ) that bacteria uptake and consume to produce
other metabolites such as organoleptic compounds.
A conda9 environnement was created with all necessary bioinformatics packages such
as python3.6.10, clyngor version 0.3.31, clyngor-with-clingo version 5.3.post1, cobra version
0.16.0, biopython version 1.74, biseau 0.0.19, et-xmlfile 1.0.1, ipython 7.15.0, lxml version 4.3.4,
matplotlib version 3.1.1, memote version 0.11.0, meneco 2.0.0, menetools version 2.0.6, Metage2Metabo
version 1.2.0, miscoto 2.0.7, mpwt 0.5.5, networkx 2.2, numpy 1.18.5, openssl 1.1.1g, padmet
4.0, pandas 1.0.4, predator 0.0.4, libsbml 5.18.0.
GEM reconstruction
The reconstruction step (illustrated by the figure 9) is splitted in four sub-processes. In
addi-tion to the annotaaddi-tion of MicroScope10, annotation step was performed with Prokka11[47] and
EggNog mapper12[21]. Prokka is used with thecompliant option that forces
Genbank/E-NA/DDJB compliance. EggnogMapper and Prokka retrieve GOterm and ECnumber among
others annotations from genes. All output of each annotations tools are merged in gbk format13
and drafts of the metabolic network are built in Padmet file and SBML file thanks to the pipeline
I developped (cf 23) using packages described above. A metabolic network file is generated for
each bacterium by using MPWT14 that is a python package for running Pathway Tools
ver-sion 23.515on multiple genomes using multiprocessing. MPWT is used with-p=1 option that
keeps associated genes inside the metabolic network. PADMET file and SBML file are
gener-ated by the script with the AuReMe package16.
9 https://docs.conda.io/en/latest/ 10 https://mage.genoscope.cns.fr/microscope/home/index.php 11 https://github.com/tseemann/prokka 12 http://eggnog-mapper.embl.de/ 13 https://github.com/kblin/merge-gbk-records 14 https://github.com/AuReMe/mpwt 15 http://bioinformatics.ai.sri.com/ptools/ 16 http://aureme.genouest.org/
Figure 9: Pipeline of GEM reconstruction and analysis
adapted to the internship. At each step of reconstruction,
one possible tools is indicated. Gap-filling and the curation steps
are computed with Meneco[40].
For the gap-filling process,
tar-gets are compounds of the biomass
function whereas for the
cu-ration one, targets are the
organolep-tic compounds. During the
in-ternship, curation was applied
to the 2-methylbutanoate (2MB)
metabolites to P. freudenreichii
only since propionate and
bu-tanoate (forL. lactis) production
pathways were already present
in the draft models after the
pre-vious steps.
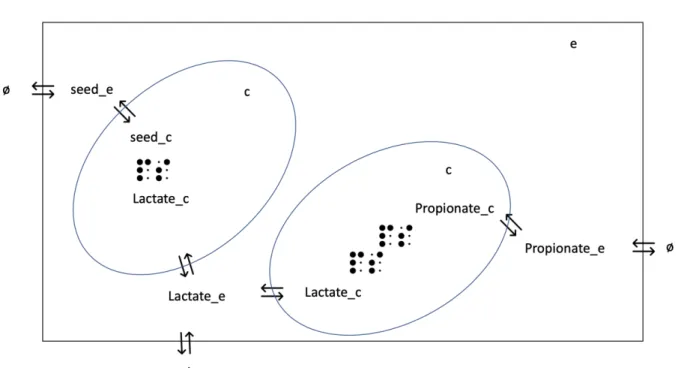
To get an optimal growth, exchange reactions are needed to evacuate the overflow of some
metabolites that can inhibit the flux in the objective reaction and to make exchanges within
the community (figure 10). These reactions are related to metabolites of biomass objective
function, seeds and organoleptic compounds. They were created and added to the drafts.
FBA model construction and assessment
The biomass objective functions were found in the litterature using GEMs of close bacterial
strains. For the bacteria used during the experiments, i.e. respectivelyP. freudenreichii
CIRM-BIA122,L. lactis CIRM-BIA465 and L. plantarum CIRM-BIA1206, the respective biomass
func-tions of the strains CIRM-BIA1, Il1403, ATCC_14917 are taken from VMH database17[36].
Clos-est strains are found by checking phylogenetic tree (appendix 21a, 21b, 21c) of each bacterium.
Metabolic networks of these close bacteria are downloaded then the biomass objective
func-tion is taken and added to the corresponding draft model. Before, identifiers of metabolites
and reactions must be translated into MetaCyc identifiers which was performed with a script
I developped (cf utils.py from the gitlab repository 23).
17
Figure 10: Example of exchange reactions modelled in the TANGO bacterial communnity.
Blue circles represent bacteria.
A dot matrix represents a metabolic reaction.
⇐⇒ : Symbolizes exchanges with extracellular / cytosol or exytracellular / boundary compo-nent (represented with ø)
c : Cytosol compartiment
Topology tools exploring pathways at the genome and community scale are used as well
as tools based on flux analysis. The series Menetools18[1] enable us to check if a target is
pro-duced from the seeds (menecheck) and reveals the path of production of this target (menepath,
figure 7). A complementary method in the FBA framework called FVA (flux variance analysis),
a function from the COBRApy package19, is used to identify essential and alternative reactions
associated to an objective function that we set up to the production of biomass or organoleptic
compounds.
To explore the metabolism at the community scale, we used the MiSCoTo tool that allows
us to screen the microbiome and select the community using topology analysis [15]. It is used
with option minexch that computes one minimal solution (intersection, union) for all possible
exchanges between species. Here, a minimal solution is a community ensuring a metabolic
pathway from seeds to targets involving the minimum number of bacteria and exchanges.
The last part is Dynamic FBA and it uses methods based on flux analysis. Packages such
as NumPy20, SciPy21 and COBRApy are used (filekinetic.py). The script computes the
dynamics of organisms in the bacterial community, the quantity of substrate in the growth
media and additional molecules the evolution of which is important to follow. For each
mi-croorganisms substrates and products, the production and consumption fluxes are computed
at each time step together with the resulting bacterial growth rate using the corresponding
microorganism FBA model. Then, using time integration method, the temporal fate of the
compounds of interest are built, from an initial condition.
More specifically, the script solves the following dynamical system:
∂tb = G(b, s)b
∂ts = −D(b, s)b
∂tp = P (b, s)b
whereb, s and p are vectors gathering the respective concentrations (g.L−1) of bacteria,
sub-18 https://github.com/cfrioux/MeneTools 19 https://opencobra.github.io/cobrapy/ 20 https://numpy.org/ 21 https://www.scipy.org/
strate metabolites and metabolic products. The functionG, D and P represent the growth, degradation and production fluxes computed at each time step with the respective FBA
mod-els of the 3 bacteria. In this FBA models, import bounds for the susbstrate metabolites are
re-computed at each time steps, based on the current concentration and availability of
sub-strate in the environment.
A simplified version of this model (i.e. a kinetic model) is built with the following system:
∂tbi = X j Gij bisj K + sj ∂tsj = − X i Dij bisj K + sj ∂tpk= X i,j Pij bisj K + sj
whereG, D and P are static reactions matrix computed with the FBA model and the standard
import and export bounds. The parameterK is a tuning parameter of the Michaelis Menten
functions that was set manually.
Omics data integration
From metatranscriptomic data represented by the tables 3, a pipeline is built to transform those
tables into Pandas22DataFrames. In the TANGO project, two replicates of each experiment is
done. In order to normalize these data, I average replicates and a new metatranscriptomics
table is created. Secondly, I recover all reactions of each solution from the output of menepath
tool for propionate production in P.Freudenreichii. A solution provides a minimal set of
re-actions that enables to produce a propionate. Each solution can be interpreted as a different
metabolic pathway leading to the target metabolite (here propionate). These reactions are
mapped to their genes with the PADMET file of the metabolic network of the corresponding
species. The transcribed genes associated to the reaction of a solution are retrieved for each
time point by considering a gene as transcribed if its value in table is positive. A time point in
one experiment is described as a three-letter word, with each letter providing information:
word = 1M T (1)
22
where 1 = replicate (no exist after step of average). M = timestep that I retrieve, here moulding.
It can be D for demoulding or A for after salting or 4 for four weeks of ripening or 7 for seven
weeks of ripening. The last letter is itinerary of production, here T is the control. It can be B
for BT-, S for ST- or A for MT-.
We define as “activated”, the set of reactions associated to a transcribed gene in a given
pathway, regardless of the cheese production path or the timestep at which the transcriptomic
experiment was performed.
For each target, two kinds of heatmaps are built (the corresponding script that I developed,
calledtranscriptomic.py, can be found in the gitlab 23).
The first one consists in computing activated pathways at each time step (moulding,
de-moulding, salting. . . ) for each experiment (control, ST-, BT-, MT+). One solution represents a
pathway and I compute the proportion of timestep within the pathway, it goes back to count
the number of times that a timestep (the second letter in "word" (equation 1) occurs in one
solution. The number counted is divided by the total number of timestep retrieved in one
solution :
proportionSpecif icT imeStep = 100 ∗ cpt_specif icT imeStep totT imeStepInSolution
where
totT imeStepInSolution = cpt_M + cpt_D + cpt_A + cpt_4 + cpt_7
and cpt_M, cpt_D, cpt_A, cpt_4, cpt_7 represent respectively the number of timestep
(mould-ing, demould(mould-ing, after_salting and after four and seven weeks of ageing) for all reactions in
one solution. This heatmap then indicate the time step at which each pathway is preferentially
activated. In addition, it will identify preferred pathways which are activated in function of
the method of cheese production over time.
The second heatmap consists in counting for each pathway the proportion of activated
reaction (i.e. reactions associated to a transcribed gene) at a given time step among all activated
reactions for this pathway. I check, for each reaction of one solution, if timestep (M,D,A,4 or
7) is associated to any transcribed genes, and then, divide by the total number of activated
proportionActivatedReaction = cptOccurrenceEachReactionSpecif icT imeStep totN umberReactionInSolution
This second heatmap reveals which reactions is activated at a specific time step in function
of the method of cheese production, and thus, identify genes transcribed.
If all reactions of the solution can be associated to transcribed genes, we obtain 100% of
ac-tivation for this solution at the given time step. Moreover, for both heat maps, the proportions
are made depending of the cheese production processes ( control, MT+, ST_...).
species genes moulding unmoulding after salting 4 weeks ripening 7 weeks ripening
lactis_g0 >0 >0 >0 >0 >0 lactis_g1 . . . >0 >0 0 0 0 plantarum_g0 0 0 0 0 0 plantarum_g1 . . . >0 >0 0 0 0 freudenreichii_g0 0 0 0 >0 >0 freudenreichii_g1. . . 0 0 0 >0 >0
Table 3: Simplified representation of metatranscriptomic data table available in the TANGO
project. First column represents genes of each bacterium, the others the kinetic steps at which
RNA was extracted and values represent the number of transcribed genes at each step.
Software availability
Figure 11: Workflow of
recon-struction and modeling used in the
TANGO project.
All scripts used are located in the GitLab23. In Tango
project, a tractability of each main step of reconstruction
can be found in the ’data’ folder. All scripts cited before
are in ’src’ folder. The methodology can be summarized
by the figure 11.
23
Results
First, the construction of the GEMs models for the three bacteria involved in the community
is presented. We specifically focus on the production of the organoleptic compounds and
connect their pathways to the bacterial GEMs, the main difficulty being that these pathways
are not involved in the central metabolism and biomass production. Next, we integrate the
transcriptomic data to the GEMs and check the consistency of the results with the metabolomic
dataset. Finally, we combine the different GEMs to build a community dFBA model and we
approximate it with a kinetic model.
Genome scale metabolic network Model (GEMs) reconstruction
De novo specific GEMs from the three genomes used for the experiments are built follow-ing these steps : genome annotation, draft reconstruction, gap fillfollow-ing and curation, includfollow-ing
specific assessment of the organoleptic production pathways.
Interest of three different annotations tools
The goal is to get the most complete genome annotation possible as raw data for GEMs
con-struction. Thus, three different annotation tools are used : Prokka, Eggnog and Microscope.
The figure 12 illustrates the reason why three annotations tools were chosen. In this Venn
diagram, in complement of a core set of 988 reactions that were consistently annotated by the
3 methods, each tool provides their own reactions that are not identified by the other tools, to
be added to complete the network (126 from prokka, 336 from eggnog, 125 from microscope).
In total, there is about 1600 reactions in the metabolic network ofP. freudenreichii which is the
expected order of magnitude for this kind of bacteria. Similar results are found forL. lactis and
L. plantarum after adding the biomass objective function (figures 13). The biomass objective function for each bacteria is added from VMH database and choosen according to the closest
strain of each bacteria (see material and method for more details).
Draft models
To assess the completeness of the draft model, the topological connectivity of the metabolic
pathways involving milk compounds is systematically checked, and whether the draft model
op-Figure 12: Added value for each annotation tool forP. freudenreichii
draft after biomass function addition
species number of pathways number of Reactions reaction with gene associated number of genes number of compounds freudenreichii 220 1668 1425 (85%) 2675 1881 Lactis 199 1534 1314 (85%) 2689 1848 Plantarum 214 1737 1431 (82%) 3241 1976
Figure 13: Results from draft metabolic networks for each specie after biomass function
draft analysis topology and flux After added exchanges
reactions within the drafts
After added union solution of gap-filling tool Meneco
species ratio of metabolites produced by topology ratio of metabolites produced by flux ratio of metabolites produced by topology ratio of metabolites produced by flux P. freudenreichii 55.8% 61.76% 77.9% 73.5% L. lactis 59.7% 52.17% 77.6% 69.5% L. plantarum 78.4% 82% 86.3% 88.2%
Table 4: Results from analyse topology and flux of all drafts for each species after added
ex-changes reaction and union reactions of Meneco output
timized, in this case the biomass objective function. After this processing, differences between
topology and flux are observed which can be explainable because they do not use the same
mathematical formalism. Indeed, topology is based on logical framework and flux is based
on quantitative reasoning. In the model, metabolites must be evacuated into the extracellular
compartment not to saturate and inhibit the growth of the bacteria. The table 4 illustrates
the results after adding exchange reactions. For each step (draft merging, biomass objective
function selection, exchange reaction definition, gap-filling and curation), a new drafts is built
to ensure traceability.
Gap-filling and curation
Some metabolites are producible in flux when the objective function is designed to maximize
its production, but no growth is observed when the biomass reaction is set as objective
func-tion. To improve the number of metabolites produced by flux, a completion step of metabolic
network with Meneco is performed, and reactions from the union output are added (figure 4).
The union output corresponds to the union of minimal solution, that enables us to produce
desired molecules. Some biomass compounds are still unproducible. It is likely due to the
lack of information into the database MetaCyc for these metabolites or missing annotations in
the genome. After removing them, bacterial growth is achieved for each bacteria FBA model.
Before setting the community model, the production of the metabolites of interest is checked,
i.e. organoleptic compounds as Propionate and 2MB forP. freudenreichii and Butanediol for L.
lactis. After executing this pre-treatment, only 2MB was not produced. To solve it, a curation step is done using Meneco with 2MB as a target. Two reactions are found in the output and
Focus on organoleptic compounds
At genome scale
Using Menepath and FVA, one path of synthesis of organoleptic compounds is computed and
analysed at the genome scale (figures 14, 15, 16). To obtain this result, the expected path of
production of propionic acid is firstly checked from the literature (Wood-Werkman and TCA
cycle). As the biosynthesis of 2MB and butanediol are not well known, we expected (based on
biological experiences and biological knowledge) pyruvate to be a common precursor of these
two compounds. Next step consists in retrieving these paths inside the metabolic network. For
each path of production of an organoleptic compound, the table 5 shows the Menepath outputs,
indicating the number of essential and alternative reactions (see introduction for more details
about this notion). FVA analysis gives exactly the same essential and alternative reactions.
organoleptic compounds number of solutions number of reactions for one solution number of essential number of alternative Propioniuc acid 58 9 4 5 2MB 2 8 7 1 Butanediol 1 4 4 0
Table 5: Summary of Menepath and FVA results for each organoleptic compounds : Propionic
acid and 2MB forP. freudenreichii and Butandiol for L. lactis. One solution found corresponds
to one possible pathway to produce an organoleptic compound, in still refering to the reference
database, metacyc.
A step of annotation is done to link the right EC-number of these essential and alternative
reactions to the corresponding organism and thus build the path of production.
At community scale
MisCoTo aims at characterizing exchanges within a bacterial community. It reveals two results:
one was expected, unlike the other. First, we recovered the well known mechanism that P.
freudenreichii is able to uptake lactate molecules produced by L. lactis or L. plantarum. Second, P. freudenreichii could produce propionate without lactate with an alternative pathway that is not the usually observed pathway : lactate -> pyruvate -> proprionate by the Wood-Werkman
and TCA cycles. We could also say, from the postulate announced in introduction part, that
Figure 14: Synthesis of 2MB
(CPD__45__7076) for P.
freudenreichii from Pyruvate molecule
Figure 15: Synthesis of
Pro-pionate for P. freudenreichii
from Pyruvate molecule.
Wood-Werkman and TCA
cycle can be found.
Figure 16: Synthesis of
bu-tanediol for L. lactis from
Pyruvate molecule
Integration of metatranscriptomics data
After retrieving metatranscriptomic data and averaging among replicates (see materials &
methods part), I can obtain the proportion of reactions activated and the preferred time of
propionate production in P.Freudenreichii. Results are presented in figure 18. There is one
heatmap for each experiment (control, MT+. . . ), with, on the left, the heatmap showing the
proportion of reaction activated in the different pathways of propionate production and on
the right, heatmaps representing the preferential time steps of activation for each propionate
pathway. Rows are Menepath solution, i.e. each metabolic pathway. Time steps are
repre-sented on the bottom and on the right, the scale which represents the proportion of each time
point in a solution at each time step. On the figure 17a, a metabolomics analysis of propionic
acid was made (from TANGO project). Time is represented on the x-axis and the value of
propionic acid on the y-axis. The different experiments are represented by the different colors
(red for MT+, green for BT-, blue for ST- and violet for control). We can see that propionate
appears after brining time step, consistently with the metabolomic data. The figure?? shows
that, after brining, there is no preferential time step to produced propionic acid, indicating that
priopionate production goes on all along ripening, again consistently with the metabolomics.
In average, the moulding and de-moulding steps are less represented (lower than 12%). It can
confirm the trend of the curve between the moulding and after salting steps in the figure 17a.
At the opposite, after brining and ageing four and seven weeks, genes are well represented
(a) Metabolomic analysis of propionic acid for the different experiments
(b) metabolomic analysis of 2MB for the different experiments
(c) metabolomic analysis of lactic acid for the differ-ent experimdiffer-ents
(d) metabolomic analysis of lactose depending dif-ferent way of production modified
(e)L. lactis dynamics for each experiment. (f )P. freudenreichii dynamics for each experiment.
(g)L. plantarum dynamics for each experiment.
Figure 17: Figures 17a represent metabolomic time-series acquired during the tango project
M D A_s weeks4 weeks7 0 3 6 9 12 15 18 21 24 27 30 33 36 39 42 45 48 51 54 57 45 60 75 90
(a) Expressed reactions for control experiment
M D A_s 4weeks 7weeks
0 3 6 9 12 15 18 21 24 27 30 33 36 39 42 45 48 51 54 57 10.0 12.5 15.0 17.5 20.0 22.5
(b) Preferential time steps : control experiment
M D A_s weeks4 weeks7
0 3 6 9 12 15 18 21 24 27 30 33 36 39 42 45 48 51 54 57 0 20 40 60 80 100
(c) Expressed reactions : BT- (MT+ follows the same pattern
M D A_s 4weeks 7weeks
0 3 6 9 12 15 18 21 24 27 30 33 36 39 42 45 48 51 54 57 0 6 12 18 24 30
(d) Preferential time steps: BT- (MT+ follows the same pattern)
M D A_s weeks4 weeks7
0 3 6 9 12 15 18 21 24 27 30 33 36 39 42 45 48 51 54 57 45 60 75 90
(e) Expressed reactions:
ST-M D A_s 4weeks 7weeks
0 3 6 9 12 15 18 21 24 27 30 33 36 39 42 45 48 51 54 57 10.0 12.5 15.0 17.5 20.0 22.5
(f ) Preferential time step:
ST-Figure 18: Heatmaps for control, BT- and ST- experiments. Number on the left represent each
solution of production, time step is represented on the bottom and on the right, the scale which
represents the proportion at each time step. Heatmaps on the left represent the proportion of
reaction activated at each time step, whereas heatmaps on the right shows the preferred time
Community model
MisCoTo (tools based on topology analysis) brings to light a minimal community compounds
of two organisms: P. freudenreichii and L. lactis or L. plantarum. These two groups are
ex-pected. Indeed, L. lactis and L. plantarum are two lactic bacteria, it means that they produce
similar molecules (lactate. . . ). In addition with this two key species, community model can
still produce all organoleptic compounds producible. It reveals two things. Firstly, exchanges
are triggered to perform it. Secondly, an hypothesis of competition between the two lactic
bacteria can exists (the bacteria producing more lactic acid feedsP. freudenreichii. . . ).
The community model based on flux analysis is illustrated in the figure 19 and 20. Both
shows the behavior of the community. The DFBA model re-computes at each time step the
import bounds of the substrate metabolites (depending on the substrate available in the
en-vironment) whereas the kinetic model is based on a kinetic constant, the term of Michaelis
Menten. Both methods enable us to take into account the growth medium. Essentials
infor-mation that we know about the behavior of this community can be found in both analyses :
lactose degradation and production of lactate, which can be confirmed with figures 17c and
17d. Indeed, the production of lactate stops when the value of lactose is 0. In addition, the
offset of the growth ofP. freudenreichii and production of propionic acid, 2MB and butandiol
is well represented. Moreover, limited substrates for each type of bacteria are well identified.
Indeed, lactic bacteria such as L. plantarum and L. lactis stop their growth when lactose is
completly uptaken, and P. freudenreichii does not grow any longer when lactate disappears.
Both technique give good results although DFBA is more time-consuming than kinetics model
(speed up about 70).
We also know thatL. lactis growths before L. plantarum and P. freudenreichii. Concerning
L. lactis and L. plantarum, both models seem to indicate the opposite, indeed, they start to
growth together butL. plantarum has a better growth rate. Regarding the offset of P.
freuden-reichii, a difference of five hours is observed between the DFBA and the kinetic model. The DFBA is a little more accurate than kinetic model to capture fine metabolic differences
be-tween organisms due to its best accordance to the reality.
In both models, bacterial stop their growth if their limited substrate disappeared, whereas
ripening unlike the two others still growth. It could indicate that maybe L. plantarum uses another source of carbon or that a competition between the two lactic bacteria occurs.
0
5
10
15
20
25
30
35
time (hours)
0
20
40
60
80
100
120
Density (g/L)
2-methylbutanoate PROPIONATE BUTANEDIOL lactose (S)-lactate (R)-lactate0
5
10
15
20
25
30
freudenreichii lactis plantarumBacterial growth
Figure 19: DFBA of the bacteria community in the TANGO research project
0
5
10
15
20
25
30
35
time (hours)
0
20
40
60
80
100
120
Density (g/L)
2-methylbutanoate PROPIONATE BUTANEDIOL lactose (S)-lactate (R)-lactate0
10
20
30
40
50
60
freudenreichii lactis plantarumBacterial growth
Figure 20: kinetic model of the bacteria community in the TANGO research
Discussion
I developed a pipeline for the generation of metabolic networks in Padmet file and Sbml file,
using heterogeneous tools were used such as pathway tools wrapper (mpwt), the series padmet
and padmet-utils. It provides a flexible framework to easily build metabolic network drafts,
but at the price of non trivial data formatting and complex user-defined options. I had to
care-fully study the source code of these toolboxes to adapt their use to the project needs.
The GEMs produced during this internship were built upon an annotation of the genomes
of the three bacteria used during experiments. Three different annotation tools were used,
each contributing to the GEM reconstruction. Indeed, each annotation tool does not use the
same reference database and thus, the genomes will be complementary annotated, leading
to more complete metabolic network drafts. There is also a risk of false positive which has
not verified. However, metabolic gaps remain as we observed when testing the producible of
biomass precursors. To build FBA models, a gapfilling method was used based on network
expansion algorithm : Meneco. Even if topology analysis tools provides results that appeared
relevant, it could be interesting to do gapfilling with tools based on flux, such as fastGap[51]
or even gapfill (method implemented in cobraPy[12]). By lack of time, both tools were not
used during this internship, but a further analysis would be to work with these tools and
com-pare selected reactions with the ones of Meneco by identifying common and missing reactions
from each tools. It has to be noted that validation of gapfilling is a difficult task that entails
the identification of associated genes for the selected reactions.
To build the FBA models, we used the biomass function of previously published FBA
mod-els of close bacterial strains. However, some metabolites used by these biomass functions were
not producible in the first version of the draft models. As these missing metabolites were not
involved in the production of the organoleptic compounds we were interested in, instead of
performing a time consuming gap filling to make them producible, we chose to to rather
sim-plify the biomass by removing them from the equation. Some co-factors and macro-molecules
(such as DNA or RNA) were removed from this function because they are not involved in
the production of the metabolites of interest. A deeper research could try to understand how
these metabolites, co-factors and macro-molecules, could be produced by models by
tools as describes above. But the ability of these draft models to produce organoleptic targets
has been assessed, which was not trivial since organoleptic compounds do not belong to the
central metabolism of the bacterial.
The next step consisted in analysing the production pathways of three organoleptic
com-pounds. Topological (Menepath) and flux (FVA) analysis provided similar information which
indicates the relevance of the qualitative network expansion with respect to quantitative
mod-ellings. The two different mathematical formalisms consistently reach the same conclusion,
enhancing the robustness of the results. In order to model metabolite exchanges at the
com-munity scalein silico, two techniques based on topology and flux are still used : MisCoTo and
DFBA.
As a reminder, MisCoTo enables us to characterize cooperation interactions through
metabo-lite exchanges. Results from this tool enables us to say that the three organoleptic compounds
are still producible in community scale but no lactic acid exchanges were brought to light
(expected exchanges in vivo). The reason is the prediction by MisCoTo of P. freudenreichii
capacities to produce propionic acid itself by using others ways of production without lactic
acid. From literature, this is not the normal path of production. Yet, we cannot exclude the
feasibility of this production pathway in specific in vivo condition. One possible improvement
is to force MisCoto to use only lactic acid degradation pathway inP. freudenreichii metabolism.
In contrast, DFBA illustrates interactions, more precisely, cooperation between L. lactis and
P. freudenreichii in terms of lactic acid degradation and production of propionic acid. An in-teresting analysis would be to identify paths of production of all organoleptics compounds,
characterize interactions within the community with both tools (topological and flux-based)
and thus, obtain a more realistic maathematical model of the community.
Results from the integration of metatranscriptomics data could be improved by using a
different threshold. From the metatranscriptomics merged data, I select all genes and time
step which are strictly positive, and considered them as transcribed. This constraint provide
skewed results on heatmap (figure 18f,18d,18b). 100% does not mean that all reactions of a
solution is activated, but at a specific time step, all reactions selected (which they have an
as-sociated transcribed gene) are activated. An approach of normalization of this data is proposed
this data normalized according to integration pipeline of metatranscriptomics data developed
by this team, we would then compare the results with the ones I obtained. The goal of this
method consists in deciphering activated metabolic pathways by identifying transcribed genes
for a given time step with the help of GEM (GPR relation).
Another approach consists in integrating meta-transcriptomics data (thresholded and/or
normalized) within the GEMs using different tools such as GIMME[3], iMAT[56] or RIPTiDe[22].
It will reveal paths activated from the metatranscriptomic data for the production of interesting
metabolites depending of the itinerary of production (MT+, BT-, control and ST-). Moreover,
differences between tools and the type of metatranscriptomics data used (thresholded and
nor-malized) can bring to light common genes used to produced an organoleptic compound. This
methods could be extend to the community modeling and then build a dynamic modeling of
the community depending on the chesse production method.
Competition for the consumption of lactic acid by the two lactic bacteria is set up in
dy-namic models but for the kinetic one, it was manually calibrated. These models could be
improved by adding, in parameters of the model, the dynamic data (control,MT-. . . ), and thus,
discuss of the behavior of the community depending of each itinerary of production.
Parame-ter inference is more complex to implement in dFBA models. Likewise, the kinetic models of
each itinerary could take into account the metatranscriptomic data: we could use RIPTiDe to
obtain a FBA model of each production pathway, then use the FBA model to build the reaction
matrix of the kinetic model, and thus have several kinetic models. Finally, the K parameter
of the Michaelis-Menten functions could be inferred, in a differential way depending of each
Conclusion
The goal of this internship was to study the impact of production parameters on the
organolep-tic quality of the cheese throught the modeling of the metabolic network of a bacterial
com-munity.
Following the workflow presented in materials and methods, we succeeded in building the
metabolic network of the three bacteria genomes using the pipeline developed I developed
by integrating heterogeneous tools. I used automated reconstruction combined with targeted
automated curation and literature analysis to provide a good quality of draft of each genome.
From this point, literature research on metabolic pathways of interest molecules started in
order to reach their producibility in bacteria, link the right gene and enzymes, identify
pos-sible exchanges within the bacteria community and build their production path within the
GEM. This enabled the identification of metabolic mechanisms associated to the production
of organoleptic molecules in cheese. In addition, I made a first step into describing metabolic
pathway of interesting molecules at the community scale (MisCoTo), and then, model their
dy-namics (DFBA and kinetic models). Dynamic models identified limiting substrates and
high-lighted a bacterial competition for a substrate (here lactose). Moreover, we described activated
pathways in the production of interest metabolites thanks to integration of metatranscriptomic
data.
To conclude I, developed an approach for small community of interest in cheese
produc-tion by relying on complex techniques in the reconstrucproduc-tion and analysis of the metabolic
net-works at the genome and community scale, together with multi-omics data. Further analysis
will consist in developing techniques to adapt analyzes of the simplify community model to a
complex model community. All together this work constitutes a first basis into understanding
the impact of production changes on the bacterial community of cheese using mathematicals
References
[1] Méziane Aite et al. “Traceability, reproducibility and wiki-exploration for “à-la-carte”
reconstructions of genome-scale metabolic models”. In: PLOS Computational Biology
14.5 (May 2018), e1006146. url: https : / / doi . org / 10 . 1371 / journal .
pcbi.1006146.
[2] Claudio Angione. “Human Systems Biology and Metabolic Modelling: A Review—From
Disease Metabolism to Precision Medicine”. In:BioMed Research International 2019 (2019).
Ed. by Stanley Brul, p. 8304260. issn: 2314-6133. doi: 10.1155/2019/8304260.
url:https://doi.org/10.1155/2019/8304260.
[3] Scott A. Becker and Bernhard O. Palsson. “Context-specific metabolic networks are
con-sistent with experiments”. In:PLoS Computational Biology (2008). issn: 1553734X. doi:
10.1371/journal.pcbi.1000082.
[4] Edik M Blais, Arvind K Chavali, and Jason A Papin. “Linking genome-scale metabolic
modeling and genome annotation”. eng. In:Methods in molecular biology (Clifton, N.J.)
985 (2013), pp. 61–83. issn: 1940-6029. doi:10.1007/978-1-62703-299-5_4.
url: https : / / pubmed . ncbi . nlm . nih . gov / 23417799 % 20https :
//www.ncbi.nlm.nih.gov/pmc/articles/PMC4079539/.
[5] Anna Blazier and Jason Papin.Integration of expression data in genome-scale metabolic
network reconstructions. 2012. url: https://www.frontiersin.org/article/ 10.3389/fphys.2012.00299.
[6] Eva Boon et al. “Interactions in the microbiome: communities of organisms and
com-munities of genes”. eng. In:FEMS microbiology reviews 38.1 (Jan. 2014), pp. 90–118. issn:
1574-6976. doi: 10 . 1111 / 1574 - 6976 . 12035. url: https : / / pubmed .
ncbi.nlm.nih.gov/23909933%20https://www.ncbi.nlm.nih. gov/pmc/articles/PMC4298764/.
[7] Francesco Carrara et al. “Inferring species interactions in ecological communities: a
comparison of methods at different levels of complexity”. In: Methods in Ecology and
Evolution 6.8 (Aug. 2015), pp. 895–906. issn: 2041210X. doi: 10 . 1111 / 2041 -210X.12363. url: https://doi.org/10.1111/2041--210X.12363.
![Figure 1: process of production of a cheese in standard way (from [38])](https://thumb-eu.123doks.com/thumbv2/123doknet/14424166.706617/9.892.109.789.193.452/figure-process-production-cheese-standard-way.webp)


![Figure 3: Possible bacterial interactions within a bacterial community. The letter α designates the effect of a specie on an another in an interaction matrix, for example in a generalized lotka-voltera model ( figure adapted from [7])](https://thumb-eu.123doks.com/thumbv2/123doknet/14424166.706617/13.892.275.618.152.494/possible-bacterial-interactions-bacterial-community-designates-interaction-generalized.webp)


![Figure 8: Results of DFBA and kinetic model ( modified from Goldford et al, science 2018 [17]) showing variation entities in time, in arbitrary units.](https://thumb-eu.123doks.com/thumbv2/123doknet/14424166.706617/20.892.320.580.823.1116/figure-results-kinetic-modified-goldford-variation-entities-arbitrary.webp)