RESEARCH OUTPUTS / RÉSULTATS DE RECHERCHE
Author(s) - Auteur(s) :
Publication date - Date de publication :
Permanent link - Permalien :
Rights / License - Licence de droit d’auteur :
Bibliothèque Universitaire Moretus Plantin
Institutional Repository - Research Portal
Dépôt Institutionnel - Portail de la Recherche
researchportal.unamur.be
University of Namur
Coupled cluster evaluation of the frequency dispersion of the first and second
hyperpolarizabilities of water, methanol, and dimethyl ether
Beaujean, Pierre; Champagne, Benoît
Published in: J. Chem. Phys. DOI: 10.1063/1.4958736 Publication date: 2016 Document VersionPublisher's PDF, also known as Version of record Link to publication
Citation for pulished version (HARVARD):
Beaujean, P & Champagne, B 2016, 'Coupled cluster evaluation of the frequency dispersion of the first and second hyperpolarizabilities of water, methanol, and dimethyl ether', J. Chem. Phys., vol. 145, no. 4, 044311. https://doi.org/10.1063/1.4958736
General rights
Copyright and moral rights for the publications made accessible in the public portal are retained by the authors and/or other copyright owners and it is a condition of accessing publications that users recognise and abide by the legal requirements associated with these rights. • Users may download and print one copy of any publication from the public portal for the purpose of private study or research. • You may not further distribute the material or use it for any profit-making activity or commercial gain
• You may freely distribute the URL identifying the publication in the public portal ?
Take down policy
If you believe that this document breaches copyright please contact us providing details, and we will remove access to the work immediately and investigate your claim.
Coupled cluster evaluation of the frequency dispersion of the first and second
hyperpolarizabilities of water, methanol, and dimethyl ether
Pierre Beaujean and Benoît Champagne
Citation: The Journal of Chemical Physics 145, 044311 (2016); doi: 10.1063/1.4958736 View online: http://dx.doi.org/10.1063/1.4958736
View Table of Contents: http://scitation.aip.org/content/aip/journal/jcp/145/4?ver=pdfcov Published by the AIP Publishing
Articles you may be interested in
Parallel computation of coupled-cluster hyperpolarizabilities J. Chem. Phys. 130, 194108 (2009); 10.1063/1.3134744
Frequency-dependent hyperpolarizabilities of the Ne, Ar, and Kr atoms using the approximate coupled cluster triples model CC3
J. Chem. Phys. 123, 094303 (2005); 10.1063/1.2008211
Second harmonic generation second hyperpolarizability of water calculated using the combined coupled cluster dielectric continuum or different molecular mechanics methods
J. Chem. Phys. 120, 3787 (2004); 10.1063/1.1642593
Coupled cluster calculations of the frequency-dependent second hyperpolarizabilities of Ne, Ar, N 2 , and CH 4
J. Chem. Phys. 109, 2762 (1998); 10.1063/1.476833
The electronic, vibrational and rotational contributions to the dipole moment, polarizability, and first and second hyperpolarizabilities of the BH molecule
J. Chem. Phys. 109, 1845 (1998); 10.1063/1.476760
THE JOURNAL OF CHEMICAL PHYSICS 145, 044311 (2016)
Coupled cluster evaluation of the frequency dispersion
of the first and second hyperpolarizabilities of water, methanol,
and dimethyl ether
Pierre Beaujean and Benoît Champagnea)
Laboratoire de Chimie Théorique, Unité de Chimie Physique Théorique et Structurale, University of Namur, Rue de Bruxelles 61, B-5000 Namur, Belgium
(Received 19 May 2016; accepted 1 July 2016; published online 27 July 2016)
The static and dynamic first ( β∥) and second (γ∥) hyperpolarizabilities of water, methanol, and dimethyl ether have been evaluated within the response function approach using a hierarchy of coupled cluster levels of approximation and doubly augmented correlation consistent atomic basis sets. For the three compounds, the electronic β∥and γ∥values calculated at the CCSD and CC3 levels are in good agreement with gas phase electric field-induced second harmonic generation (EFISHG) measurements. In addition, for dimethyl ether, the frequency dispersion of both properties follows closely recent experimental values [V. W. Couling and D. P. Shelton, J. Chem. Phys. 143, 224307 (2015)] demonstrating the reliability of these methods and levels of approximation. This also suggests that the vibrational contributions to the EFISHG responses of these molecules are small. Published by AIP Publishing.[http://dx.doi.org/10.1063/1.4958736]
I. INTRODUCTION
The evaluation of the first ( β) and second (γ) hyperpo-larizability tensors remains a challenge for modern quantum chemistry. Besides the electronic contribution, the vibrational counterpart can be non-negligible and the evaluation of both contributions as well as the description of their frequency dispersion requires treatments including electron correlation.1–7 During the last 30 years that have witnessed the elaboration of high-level electron-correlation methods, the comparisons between calculations and experiment have turned out to be profitable for increasing the accuracy and precision of both types of methods as well for understanding the origin of the nonlinear optical (NLO) responses.1,8–15
A recent publication due to Couling and Shelton16reports measurements of both the first and second hyperpolarizabili-ties of dimethyl ether (DME). These measurements have been carried out in gas phase at different frequencies by using the electric field-induced second harmonic generation (ESHG) technique. This new set of data as well as the comparison with water and methanol gives a new opportunity to assess state-of-the-art quantum chemistry methods for predicting the hyperpolarizabilities. Indeed, on the one hand, their small number of atoms allows the use of large basis sets together with high-level post-Hartree-Fock methods. On the other hand, these gas phase data prevent from having to account for solvent or surrounding effects, which might be cumbersome.17–22
Following Couling and Shelton, this article is focusing on the two quantities accessible through ESHG experiment, the projection of the vector part of β on the permanent dipole moment (⃗µ), β∥, and the isotropic second hyperpolarizability,
a)Electronic mail: [email protected]
γ∥, which are defined as β∥=1 5 x, y, z ζ µζ ∥ ⃗µ∥ x, y, z η βζηη+ βηζη+ βηηζ, (1) γ∥= 1 15 x, y, z ζ,η γζζηη+ γζηηζ+ γζηζη, (2)
where ζ , η, . . . are Cartesian coordinates, µζ is the ζ
component of the permanent dipole moment vector, and∥ ⃗µ∥ its norm. βζηξand γζηξ χare elements of the first and second hyperpolarizability tensors, respectively.
In this contribution, only the electronic hyperpolariz-abilities are calculated. They are evaluated by adopting a hierarchy of Coupled Cluster (CC) response function methods, suitable to evaluate the static values as well as their frequency dispersion. The vibrational contributions to β and γ have already been addressed for water23–25and methanol,5(b),26,27at different levels of approximation, showing that, at optical frequencies, the vibrational contributions amount to only a few percents of the electronic SHG values.
This paper is organized in three parts: after describing the theoretical frame and the computational details in SectionII, the main results for water, methanol, and dimethyl ether are presented and discussed in Section III. First, the effects of basis set and electron correlation on the static and dynamic responses are analyzed. This allows selecting “best” values for performing comparisons. Besides comparison with the experimental data of Couling and Shelton,16 Kaatz et al.,18 and Ward and Miller,28comparisons are made with previous theoretical values for water and methanol. To our knowledge, this is the first report on calculated first and second hyperpolarizabilities for DME. The conclusions are drawn in SectionIV.
044311-2 P. Beaujean and B. Champagne J. Chem. Phys. 145, 044311 (2016)
II. THEORETICAL METHODS AND COMPUTATIONAL PROCEDURES
The frequency-dependent first and second hyperpolar-izabilities are the expansion coefficients of the molecular induced dipole moment as a function of external electric fields, ⃗F, applied along the η, ξ, . . . directions and oscillating at frequencies ω1, ω2, . . ., ∆µζ( ⃗F) = x, y, z η αζη(−ωσ; ω1) Fη(ω1) + 1 2! x, y, z η,ξ βζηξ(−ωσ; ω1,ω2) Fη(ω1) Fξ(ω2) + 1 3! x, y, z η,ξ, χ γζηξ χ(−ωσ; ω1,ω2,ω3) Fη(ω1) × Fξ(ω2) Fχ(ω3) + · · ·, (3)
where ωσ= iωiand αζηis an element of the polarizability
tensors. Depending on the experimental setup and the combination of the static and dynamic electric fields, different NLO processes arise. For the first hyperpolarizability, one distinguishes the linear electro-optic effect [dc-Pockels, β(−ω; ω,0)] and the second harmonic generation [SHG, β(−2ω; ω; ω)]. For the second hyperpolarizability, usual processes encompass the Kerr effect [dc-Kerr, γ(−ω; ω,0,0)], the degenerate four wave mixing [DFWM, γ(−ω; ω, −ω,ω)], the electric-field induced second harmonic generation [ESHG, γ(−2ω; ω,ω,0)], and the third harmonic generation [THG, γ(−3ω; ω,ω,ω)].1
According to Eq. (3), the hyperpolarizability tensor elements can be evaluated as the second- and third-order responses of the dipole moment to these fields. Typically, these can be obtained by using response function methods29,30 and/or partial finite field numerical derivative techniques.31 Within perturbation theory, β and γ can also be expressed in the form of summations over excited states,32,33
Pζη...(−ωσ; ω1, . . .) = Pζ η... a1,a2, ... µζ0 a 1µ¯ η a1a2. . . (ωa1−ωσ) (ωa2−ωσ+ ω1) . . . , (4) where P= α, β,γ. ωai= ~ωai= Ei− E0 is the vertical
transition energy between the ground state (0) and the ith excited state, P is the permutation operator over the pairs of coordinates and frequencies, (ωσ, ζ ), (ω1, η), . . . The quantity
¯
µaiajis equal to⟨i| ˆµ| j⟩ − δi j⟨0| ˆµ|0⟩. As a result, the
magni-tude of the hyperpolarizabilities is inversely proportional to the square (cube) of the excitation energies for β (γ).
Following experimental evidences,34 Bishop33,35,36 and, later on, Hättig,37demonstrated that the frequency-dependent hyperpolarizabilities (Eq.(4)) can be rewritten under the form of a product between the static hyperpolarizabilities, P(0), and a ω2Lpolynomial,
P(−ωσ; ω1, . . .) = P(0) [1 + Aω2L+ B ω 4
L+ · · ·], (5)
where A, B, . . . are the expansion coefficients and ω2 L= σ,1,2,... i ω2 i. (6)
They proved that A is the same for all second-order (third-order) NLO processes but it depends on the molecule. Moreover, B is the same for both ESHG and dc-Kerr processes.36,37 Thus, for typical NLO processes with only one optical frequency (ω), ω2Lis an integer (k) multiple of ω2. For instance, for the SHG and the ESHG processes, k is equal to 6, whereas it amounts to 2 for dc-Pockels and dc-Kerr. This allows defining a frequency dispersion factor, D(ω2
L), D(ω2L) = P(ωσ; ω1, . . .) P(0) − 1= Aω 2 L+ B ω 4 L+ · · · (7)
These expressions and relationships are valid for average quantities ( β∥ and γ∥) as well as for the diagonal tensor elements ( βζζζand γζζζζ).
The geometries of the three molecules were optimized at the M06/6-311G(d) level of theory. At first, SHG/ESHG first and second hyperpolarizabilities were evaluated for a range of wavelengths (energies), i.e., ∞ (0), 1064 (9400), 694.3 (14 400), 611.3 (16 360), 590 (16 950), 514.5 (19 440), and 488 (20 500) nm (cm−1). These hyperpolarizabilities were evaluated at the time-dependent Hartree-Fock (TDHF) level,38 as well as with a hierarchy of CC models with quadratic and cubic response functions.29,30,39,40 Unrelaxed orbitals were assumed. The CC hierarchy, given in increasing order of electron correlation treatment, is CCS, CC2, CCSD, and CC3.29,30,39,40 Those calculations were performed with doubly augmented correlation consistent polarized valence basis sets, d-aug-cc-pVXZ41(X= D, T, Q, and 5 for water, X = D and T for methanol and DME). X determines the splitting level of the valence shell atomic orbitals and also the highest angular momentum quantum number (lmax) of the
polarization functions. So, for the O atom, if X = T (3), there are three sets of valence s and p functions and lmax
= 3, corresponding to f polarization functions whereas for X = Q(4), there are 4 valence s and p sets and up to g polarization functions (lmax= 4). This choice of doubly
augmented basis sets is consistent with previous investigations on reference molecules for nonlinear optics.15 In a second step, β and γ values for additional NLO processes were calculated. For the latter, the calculations were performed at the [Q,C]RF-CCSD/d-aug-cc-pVDZ level with ω2L values ranging from 0 to 30 × 108 cm−2 by step of 2 × 108 cm−2. All reported β and γ values are given in a.u. [1 a.u. of β = 3.6212 × 10−42m4V−1= 3.2064 × 10−53C3m3J−2= 8.639
× 10−33 esu; 1 a.u. of γ = 7.423 × 10−54m5V−2 = 6.2354
× 10−65C4m4J−3= 5.0367 × 10−40esu] within the T
conven-tion.1 Geometry optimization and TDHF calculations were carried out with the Gaussian 09 D01 package42while response functions at the different coupled-cluster levels were obtained with Dalton 2016.43
III. RESULTS AND DISCUSSIONS
A. Basis sets and electron correlation effects on β and γ of water
The small water molecule enabled a detailed investigation of electron correlation effects by using basis sets ranging from d-aug-cc-pVDZ to d-aug-cc-pV5Z. The complete data are
044311-3 P. Beaujean and B. Champagne J. Chem. Phys. 145, 044311 (2016)
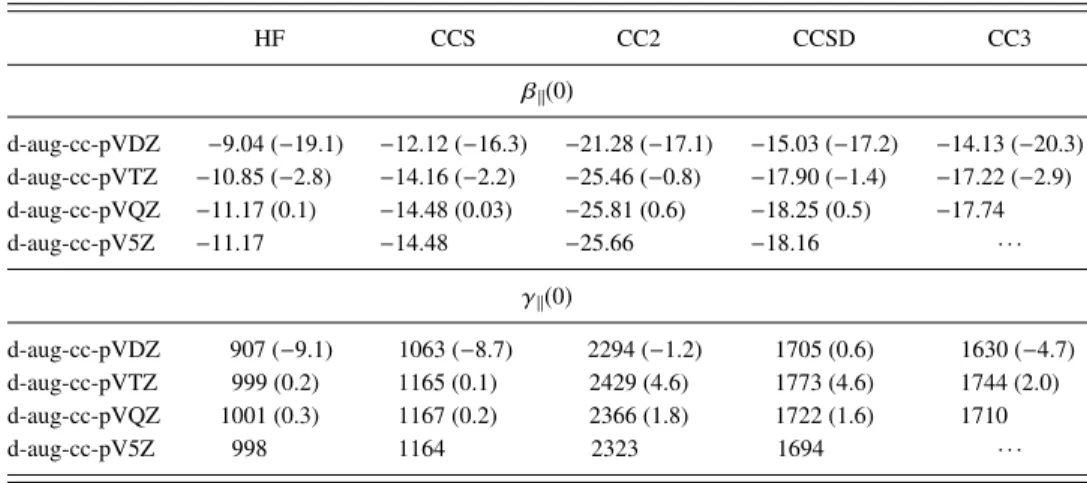
TABLE I. Basis set and electron correlation effects on the static β∥ (a.u.) and γ∥(a.u.) of water. Relative
differences (in %) with respect to d-aug-cc-pV5Z are given in parentheses (except fo CC3 for which the comparison is made with d-aug-cc-pVQZ).
HF CCS CC2 CCSD CC3 β∥(0) d-aug-cc-pVDZ −9.04 (−19.1) −12.12 (−16.3) −21.28 (−17.1) −15.03 (−17.2) −14.13 (−20.3) d-aug-cc-pVTZ −10.85 (−2.8) −14.16 (−2.2) −25.46 (−0.8) −17.90 (−1.4) −17.22 (−2.9) d-aug-cc-pVQZ −11.17 (0.1) −14.48 (0.03) −25.81 (0.6) −18.25 (0.5) −17.74 d-aug-cc-pV5Z −11.17 −14.48 −25.66 −18.16 · · · γ∥(0) d-aug-cc-pVDZ 907 (−9.1) 1063 (−8.7) 2294 (−1.2) 1705 (0.6) 1630 (−4.7) d-aug-cc-pVTZ 999 (0.2) 1165 (0.1) 2429 (4.6) 1773 (4.6) 1744 (2.0) d-aug-cc-pVQZ 1001 (0.3) 1167 (0.2) 2366 (1.8) 1722 (1.6) 1710 d-aug-cc-pV5Z 998 1164 2323 1694 · · ·
listed in TablesIandIIfor the static and dynamic, quadratic and cubic responses (their frequency dispersion factors are given in Table S144), respectively. They are summarized in Fig. 1. For all properties, static and dynamic β and γ, at any level of approximation, the convergence of the responses with respect to X is fast. Still, it is the fastest at the HF and CCS levels so that differences between the X = Q and X= 5 are smaller than or equal to 0.1% (0.3%) for β∥(γ∥). These differences are larger at the CC2 and CCSD levels but they remain smaller than 1% and 2%, respectively. Looking at the X= D, T, Q sequence, the differences between X = Q and X= T are smaller than 3% whereas between X = T and X= D the differences attain 15% for β∥but range between 5% and 9% for γ∥. Similar effects are observed for the frequency dispersion factor, D(ω2
L), evaluated at 694.3 nm. Then, for
any property and basis set, the magnitude of the responses follows the same ordering,
HF < CCS < CC3 ≈ CCSD < CC2. (8) When considering the quasi-converged d-aug-cc-pVQZ results, the CCSD β∥(0) value is overestimated (in magnitude) by less than 3% in comparison with the CC3 results, highlighting the small impact of including triples in the CC expansion. On the other hand, the CC2 level overestimates
β∥(0) by about 45% whereas the HF and CCS methods underestimate the quadratic response by 47% and 18%, respectively. In the case of the cubic γ∥(0) response, the CCSD method overestimates slightly (1%) the CC3 value and, again, CC2 provides overestimated values (by 38%) while the HF and CCS methods underestimate it by 41% and 32%, respectively. At a wavelength of 1064 nm, the above analysis is confirmed whereas the overestimations and under-estimations are typically enhanced by a few percent. Turning to frequency dispersion, the amplitude ordering is CCS < HF < CC3 ≈ CCSD < CC2, highlighting an inversion between the HF and CCS methods with respect to the ordering of the responses as well as between CCSD and CC3, though for the latter the dispersion factors and properties are very similar.
The frequency dispersion factors as well as the amplitudes of the hyperpolarizabilities are determined by the relative values of the lowest excitation energies as well as by the transition dipole moments. Though for molecules like water (and also methanol and DME, vide infra) many excited states contribute to Eq.(4)and the two-state approximation9cannot be invoked, the amplitude ordering of the lowest excitation energies in Table S244is inverse with respect to the magnitude of the hyperpolarizabilities
CCS ≈ HF > CC3 ≈ CCSD > CC2. (9) TABLE II. Basis set and electron correlation effects on the dynamic (at 1064 nm) β∥(a.u.) and γ∥(a.u.) of water.
Relative differences (in %) with respect to d-aug-cc-pV5Z are given in parentheses (except for CC3 for which the comparison is made with d-aug-cc-pVQZ for β∥and d-aug-cc-pVTZ for γ∥).
HF CCS CC2 CCSD CC3 β∥(−2ω;ω, ω) d-aug-cc-pVDZ −9.67 (−18.7) −12.83 (−16.1) −23.61 (−15.8) −16.50 (−16.1) −15.54 (−19.9) d-aug-cc-pVTZ −11.57 (−2.8) −14.96 (−2.2) −27.94 (−0.4) −19.45 (−1.1) −18.77 (−2.6) d-aug-cc-pVQZ −11.91 (0.1) −15.30 (0.0) −28.23 (0.7) −19.77 (0.6) −19.28 d-aug-cc-pV5Z −11.90 −15.30 −28.04 −19.66 · · · γ∥(−2ω;ω, ω, 0) d-aug-cc-pVDZ 985 (−9.0) 1149 (−8.7) 2607 (−0.2) 1906 (1.5) 1821 (−15.1) d-aug-cc-pVTZ 1084 (0.1) 1259 (0.1) 2738 (4.9) 1969 (4.9) 2147 d-aug-cc-pVQZ 1086 (0.3) 1261 (0.3) 2662 (1.9) 1909 (1.7) . . . d-aug-cc-pV5Z 1083 1258 2611 1877 . . .
044311-4 P. Beaujean and B. Champagne J. Chem. Phys. 145, 044311 (2016)
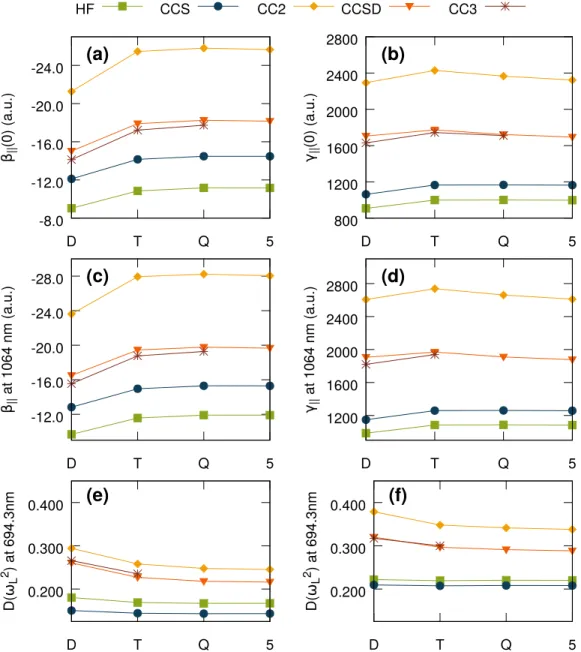
FIG. 1. Effect of the basis set (d-aug-cc-pVXZ) and of the level of approximation on the first (β∥, a.u., left) and second (γ∥, a.u., right) hyperpolarizabilities
of water. Top and middle panels give the static and dynamic (SHG or ESHG at 1064 nm) responses while the bottom panels report the frequency dispersion [D(ω2
L)] for SHG or ESHG at 694.3 nm.
Table S244also demonstrates the good agreement between the theoretical excitation energy values and those obtained from electron impact data, at both the CCSD and CC3 levels but also using the CC2 method.
B. Basis sets and electron correlation effects on β and γ of methanol and DME
The results on the first and second hyperpolarizabilities of MeOH (Table III) and DME (Table IV) confirm to a large extent the analysis made on water. In the case of methanol, the differences between X = T and X = D are much smaller than for water, highlighting cooperation effects between basis functions on different atomic centers. Qualitatively, the differences between the various CC levels are consistent with water: the CC3 and CCSD methods provide similar values (the effect of the triples is small), the HF and
CCS levels underestimate them, while CC2 overestimates them.
In the case of DME, differences between X = T and X = D are slightly larger than for methanol but remain smaller than 10%. The impact of successive improvements of the electron correlation treatment is very similar, qualitatively and quantitatively, to what was observed for water and methanol. Moreover, contrary to water and methanol, enlarging the basis set leads to a decrease of the β∥and γ∥amplitudes rather than an increase as in the case of the former.
C. Comparison with experiment and other theoretical results
Gas phase experimental β∥and γ∥ values for water and MeOH,18,28 as well as for DME,16 are collected in Table V together with our best theoretical estimates. These are defined
044311-5 P. Beaujean and B. Champagne J. Chem. Phys. 145, 044311 (2016)
TABLE III. Basis set (X= D, T) and electron correlation effects on the static and dynamic (at 1064 nm) β∥(a.u.)
and γ∥(a.u.) of methanol as well as on their frequency dispersion factor [D(ω2L)] at 694.3 nm. Relative errors
(in %) with respect to X= T values are given in parentheses.
X HF CCS CC2 CCSD CC3 β∥(0) D −24.86 (−1.1) −30.40 (−0.8) −38.46 (0.5) −31.11 (−0.1) −29.93 T −25.13 −30.63 −38.26 −31.14 . . . β∥(−2ω;ω, ω) D −26.59 (−1.0) −32.29 (−0.7) −42.01 (1.0) −33.73 (0.3) −32.53 T −26.86 −32.54 −41.60 −33.64 . . . D(ω2 L) of β∥(−2ω;ω, ω) D 0.177 (0.9) 0.159 (0.7) 0.242 (5.9) 0.219 (5.3) 0.226 T 0.176 0.158 0.228 0.208 . . . γ∥(0) D 2184 (−4) 2592 (−3.5) 4538 (1.8) 3554 (1.8) 3426 T 2274 2686 4456 3491 . . . γ∥(−2ω;ω, ω, 0) D 2381 2813 5149 3968 . . . D(ω2 L) of γ∥(−2ω;ω, ω, 0) D 0.235 0.221 0.374 0.316 . . .
TABLE IV. Basis set (X= D, T) and electron correlation effects on the static and dynamic (at 1064 nm) β∥(a.u.)
and γ∥(a.u.) of DME as well as on their frequency dispersion factor [D(ω2L)] at 694.3 nm. Relative errors (in %)
with respect to d-aug-cc-pVTZ values are given in parentheses.
X HF CCS CC2 CCSD CC3 β∥(0) D −54.20 (1.1) −66.85 (1.2) −131.32 (7.8) −93.65 (7.2) −90.65 T −53.60 −66.08 −121.77 −87.39 . . . β∥(−2ω;ω, ω) D −58.93 (1.2) −72.20 (1.2) −150.67 (8.6) −105.43 (7.8) −102.18 T −58.26 −71.34 −138.76 −97.83 . . . D(ω2 L) of β∥(−2ω;ω, ω) D 0.227 (0.5) 0.207 (0.5) 0.416 (6.9) 0.344 (6.3) 0.348 T 0.226 0.206 0.389 0.324 . . . γ∥(0) D 4053 (−1.2) 4897 (−0.9) 10 147 (7.4) 7313 (6.2) 7033 T 4101 4941 9450 6886 . . . γ∥(−2ω;ω, ω, 0) D 4480 5386 12 025 8417 . . . D(ω2 L) of γ∥(−2ω;ω, ω, 0) D 0.279 0.263 0.553 0.429 . . .
TABLE V. Experimental β∥(a.u.) and γ∥(a.u.) of water, methanol, and DME in comparison with our “best”
theoretical values.
Water Methanol DME
λ 1064 mma 694.3 nmb 1064 nma,c 694.3 nmb ∞d,e 1064d Experiment β∥ −19.2 ± 0.9 −22.0 ± 0.9 −31.2 ± 1.6 −35.0 ± 2.1 −83.5 −94.0 ± 0.25 γ∥ 1800 ± 150 2310 ± 120 3730 ± 190 4590 ± 130 7624 8591 ± 34 Theory β∥ −19.28 −21.77 −32.53 −36.69 −90.65 −102.19 γ∥ 2147 2266 3968 4677 7033 8417 aReference18. bReference28. cValue forCH 3OD instead of CH3OH.
dReference16, additional frequencies available (see text). eStatic value extrapolated from experimental data using Eq.(5).
044311-6 P. Beaujean and B. Champagne J. Chem. Phys. 145, 044311 (2016)
FIG. 2. Comparison between experimental and calculated frequency disper-sions [D(ω2
L)] of the (a) first and (b) second hyperpolarizabilities of DME.
The calculations were performed at different levels of approximation using the d-aug-cc-pVDZ basis set.
as the values obtained with the highest level of approximation, usually CC3, and then the most extended basis set. Note that previous experimental values have an uncertainty of about 5% while for the recent values due to Couling and Shelton for
DME the uncertainty is improved by one order of magnitude. For the three compounds, a very nice agreement is achieved, in particular for water and methanol. For DME, the deviations attain about 8%, which might be due to the lack of CC3 values with X= T or due to missing vibrational contributions. Then, for DME, the frequency dispersion factors are compared in Fig.2to those of Ref.16. For the whole range of wavenumbers, the agreement between the CCSD and CC3 calculations and experiment is very good and even excellent in the case of γ∥. Of course, as already discussed, consistently with the excitation energies, the optical dispersion is overestimated at the CC2 level while underestimated by the HF and CCS methods (Tables S1–S3).44
Now, comparisons with selected previous calculations are made for β∥ and γ∥ of each compound. For β∥ of water (Table VI), these highlight (i) the consistency between our QRF-CC results and those of Christiansen et al.,40 though slightly different geometries are employed, (ii) the reliability of the QED-MP2 method, (iii) the performance of the modified POL basis set with respect to doubly augmented correlation consistent basis sets, (iv) the underestimation due to using the QRF-CAS approach, and (v) overestimations when employing DFT with conventional exchange-correlation functionals.
The analysis of the γ∥values of water (TableVII) shows a good agreement between our results and the CCSD and CCSD(T) static values of Sekino and Bartlett2 as well as with the static and dynamic QED-MP2 values of Kobayashi et al.51These comparisons confirm also the underestimations of the HF method with a complete basis set and the overes-timations of DFT with a functional missing the long-range behavior.
In the case of methanol (Table VIII), the POL basis set gives RPA27 (i.e., HF) and CCSD5 β∥ and γ∥ values that are consistent with our TDHF and QRF-CCSD results, respectively. Moreover, all the CCSD and CC3 results TABLE VI. Comparison between experimental and calculated static and dynamic (at 694.3 nm) β∥values (a.u.)
of water.
Method Basis set Static Dynamic Reference
Experiment . . . −22.0 ± 0.9 28
QRF-CCSD d-aug-cc-pV5Z −18.16 −22.08 This work
QRF-CC3 d-aug-cc-pVQZ −17.74 −21.77 This work
TDHF modified POLa −10.8 −12.57 2
FFb/HF HF limit −11.07 . . . 45
TDDFT/LDA d-aug-cc-pVTZ −23.78 −32.12 46
TDDFT/BLYP d-aug-cc-pVTZ −23.65 −32.76 46
TDDFT/B3LYP d-aug-cc-pVTZ −18.54 −24.11 46
QED-MP2 modified HyPOLc −17.67 −21.31 47
QRF-CAS P3d −15.68 −19.02 24 QRF-CCSD d-aug-cc-pVTZ −17.73 −21.72 40 QRF-CCSD d-aug-cc-pVQZ −18.07 −21.98 40 QRF-CC3 d-aug-cc-pVTZ −17.04 −21.02 40 FFb/CCSD modified POLa −16.2 . . . 2 FFb/CCSD(T) modified POLa −18.0 . . . 2
aSadlej POL basis set (Ref.48) augmented with a set of d functions on H atoms and two sets of1s1p functions to describe the
lone pairs.
bFinite field numerical derivatives of the energy.
cSadlej HyPOL basis set (Ref.49) with optimized coefficients.
d[8s5p3d1 f /4s2p1d] basis set of Diercksen et al. (Ref.50) with a CAS of 8 active orbitals.
044311-7 P. Beaujean and B. Champagne J. Chem. Phys. 145, 044311 (2016)
TABLE VII. Comparison between experimental and calculated static and dynamic (at 694.3 nm) γ∥values (a.u.) of water.
Method Basis set Static Dynamic Reference Experiment · · · . . . 2310 ± 120 28 CRF-CCSD d-aug-cc-pVTZ 1773 2299 This work CRF-CC3 d-aug-cc-pVTZ 1744 2266 This work
TDHF Modified POL 1010 1216 2
FF/HF HF limit 985 . . . 45
TDDFT/BLYP Extended TZa 3700 4800 52
TDDFT/LB94 Extended TZ 1200 1500 52 QED-MP2 Modified HyPOL 1741.7 2213.8 51 FF/CCSD Modified POL 1650.0 . . . 2 FF/CCSD(T) Modified POL 1800.0 . . . 2
aValence triple-ζ basis set with two polarization functions and2s2p2d2 f diffuse
functions.
agree with experiment, considering the error bars on the measurements. On the other hand, the dynamic γ∥evaluated at the Restricted Active Space (RAS) level underestimates experiment by about 30%.
D. Comparison of the frequency dispersion for different NLO processes
The frequency dispersion of β∥ and γ∥ was then investigated by considering several second- and third-order NLO processes. This is achieved by plotting the D(ω2
L)
functions (Eq. (7)) as a function of ω2L (Figs. 3-5). As shown, for the three compounds, the D(ω2
L) curves of the
different NLO processes (of a given order) are superimposed over a broad range of wavenumbers so that values obtained for a given NLO process can easily be converted into the corresponding values for another NLO process. Though these relationships only apply to the electronic contributions to the first and second hyperpolarizabilities, they open possibilities for comparison with new experimental data. These D(ω2
L)
dispersion functions were evaluated at the CCSD /d-aug-cc-pVDZ level of approximation. Polynomial fits including terms
FIG. 3. CCSD/d-aug-cc-pVDZ frequency dispersion [D(ω2
L)] for β∥(a) and
γ∥(b) of water for different second- and third-order NLO processes. The
dashed line corresponds to Eq.(7)truncated at the second order.
up to 7th order in ω2
L were also performed in order to
compare the A coefficients, describing the dispersion at small wavenumbers. Data included in Figs. 3-5 show that the A coefficients for β∥ behave inversely to the lowest excitation energies (Tables S1–S3).44 On the other hand, for γ
∥ the A
coefficients of water and methanol are similar and smaller than those of DME. Note that the A coefficients are systematically larger for γ∥than for β∥. Finally, the amplitudes of frequency dispersion were compared among the NLO processes of a given order. It is noticed that D(ω2
L) of methanol and DME is
TABLE VIII. Comparison between experimental and calculated static and dynamic (at 694.3 nm) β∥(a.u.) and
γ∥(a.u.) values of methanol.
Method Basis set Static Dynamic Reference
β∥(−2ω;ω, ω)
Experiment . . . −35.0 ± 2.1 28
QRF-CCSD d-aug-cc-pVTZ −31.14 −37.61 This work
QRF-CC3 d-aug-cc-pVDZ −29.93 −36.69 This work
RPA POLa −24.15 −28.55 27
QRF-CCSD POL −33.52 −40.61 5
γ∥(−2ω;ω, ω, 0)
Experiment . . . 4590 ± 130 28
CRF-CCSD d-aug-cc-PVDZ 3554 4677 This work
RPA POL 2137.3 2619.3 27
CRF-CCSD POL 3502 4550 5
CRF-RASb POL . . . 3260 26
aSadlej’s POL basis set (Ref.48).
044311-8 P. Beaujean and B. Champagne J. Chem. Phys. 145, 044311 (2016)
FIG. 4. CCSD/d-aug-cc-pVDZ frequency dispersion [D(ω2
L)] for β∥ (a)
and γ∥ (b) of methanol for different second- and third-order NLO
pro-cesses. The dashed line corresponds to Eq. (7) truncated at the second order.
FIG. 5. CCSD/d-aug-cc-pVDZ frequency dispersion [D(ω2
L)] for β∥ (a)
and γ∥ (b) of DME for different second- and third-order NLO
pro-cesses. The dashed line corresponds to Eq. (7) truncated at the second order.
larger for DFWM γ∥than for the other processes, for which the dispersion functions are a little different over the probed range of wavenumbers. For water, there is no such difference and literature shows that the two situations occur. On the one hand for the hydrogen53 and helium54 atoms as well as for ethylene,55 DFWM dispersion is large compared to sum wave mixing processes such as dc-Kerr, ESHG, and THG with only positive frequency arguments. On the other hand, for all-trans hexatriene,55 the frequency dispersion is larger for ESHG than DFWM. Finally, for p-nitroaniline,56there is hardly any difference.
IV. CONCLUSIONS
The static and dynamic first ( β∥) and second (γ∥)
hyperpolarizabilities of water, methanol, and dimethyl ether have been evaluated within the response function approach using a hierarchy of coupled cluster levels of approximation and doubly augmented correlation consistent atomic basis sets. The first goal was to challenge recent gas phase electric field-induced second harmonic generation (EFISHG) measurements on dimethyl ether and the variations of β∥ and γ∥among the three compounds. For the three compounds, electronic β∥and γ∥values in good agreement with experiment (within the error bars) are obtained at the CCSD and CC3 levels. In addition, for dimethyl ether, the frequency dispersion of both properties follows closely the experimental values, demonstrating the reliability of these methods and levels of approximation. This also suggests that the vibrational contributions to the EFISHG responses of these molecules are small, if not negligible. The variations in dispersion factors among the three compounds have been explained in terms of the smallest excitation energies: the smaller the lowest excitation energies, the larger the frequency dispersion.
ACKNOWLEDGMENTS
This work was supported by funds from the Belgian Government (IUAP No. P7/5, Functional Supramolecular Systems) and the Francqui Foundation. The calculations were performed on the computers of the Consortium des Équipements de Calcul Intensif, including those of the Technological Platform of High-Performance Computing, for which we gratefully acknowledge the financial support of the FNRS-FRFC (Convention Nos. 2.4.617.07.F and 2.5020.11) and of the University of Namur, as well as on zenobe, the Tier-1 facility of the Walloon Region (Convention No. 1117545).
1D. P. Shelton and J. E. Rice,Chem. Rev.94, 3 (1994); J. L. Brédas, C. Adant,
P. Tackx, A. Persoons, and B. M. Pierce,ibid.94, 243 (1994); D. R. Kanis, M. A. Ratner, and T. J. Marks,ibid.94, 195 (1994).
2H. Sekino and R. J. Bartlett,J. Chem. Phys.94, 3665 (1991); 98,3022
(1993).
3G. Maroulis,J. Chem. Phys.94, 1182 (1991); F. Sim, S. Chin, M. Dupuis,
and J. E. Rice,J. Phys. Chem.97, 1158 (1993); G. Maroulis,ibid.113, 1813 (2000).
4C. Hättig, O. Christiansen, H. Koch, and P. Jørgensen,Chem. Phys. Lett.269,
428 (1997); J. R. Hammond and K. Kowalski,J. Chem. Phys.130, 194108 (2009); J. B. Robinson and P. J. Knowles,ibid.137, 054301 (2012); J. P. Coe and M. J. Paterson,ibid.141, 124118 (2014).
044311-9 P. Beaujean and B. Champagne J. Chem. Phys. 145, 044311 (2016)
5(a) D. M. Bishop and P. Norman,J. Chem. Phys.111, 3042 (1999); (b) A. S.
Dutra, M. A. Castro, T. L. Fonseca, E. E. Fileti, and S. Canuto,ibid.132, 034307 (2010); (c) B. Gao, M. Ringholm, R. Bast, K. Ruud, A. J. Thorvald-sen, and M. Jaszu´nski,J. Phys. Chem. A118, 748 (2014).
6D. Jacquemin, B. Champagne, and C. Hättig,Chem. Phys. Lett.319, 327
(2000); P. Norman,Phys. Chem. Chem. Phys.13, 20519 (2011); J. Campo, W. Wenseleers, J. M. Hales, N. S. Makarov, and J. W. Perry,J. Phys. Chem. Lett.3, 2248 (2012).
7M. de Wergifosse, B. Champagne, S. Ito, K. Fukuda, and M. Nakano,Phys.
Chem. Chem. Phys.18, 6420 (2016).
8T. Verbiest, K. Clays, and V. Rodriguez, Second-Order Nonlinear Optical
Characterization Techniques: An Introduction(Taylor & Francis, 2009).
9J. L. Oudar and D. S. Chemla,J. Chem. Phys.66, 2664 (1977).
10C. B. Gorman and S. R. Marder, Proc. Natl. Acad. Sci. U. S. A.90,
11297 (1993); N. A. Murugan, J. Kongsted, Z. Rinkevicius, and H. Ågren, ibid.107, 16453 (2010); X. Hu, D. Xiao, S. Keinan, I. Asselberghs, M. J. Therien, K. Clays, W. Yang, and D. N. Beratan,J. Phys. Chem. C114, 2349 (2010); B. J. Coe and R. A. Pilkington,J. Phys. Chem. A118, 2253 (2014).
11B. Kirtman, J. L. Toto, C. Breneman, C. P. de Melo, and D. M. Bishop,
J. Chem. Phys.108, 4355 (1998).
12K. Y. Suponitsky, Y. Liao, and A. E. Masunov,J. Phys. Chem. A113, 10994
(2009); L. E. Johnson, L. R. Dalton, and B. H. Robinson,Acc. Chem. Res. 47, 3258 (2014).
13F. Mançois, J.-L. Pozzo, J. Pan, F. Adamietz, V. Rodriguez, L. Ducasse, F.
Castet, A. Plaquet, and B. Champagne,Chem. Eur. J.15, 2560 (2009); J. Boixel, V. Guerchais, H. Le Bozec, D. Jacquemin, A. Amar, A. Boucekkine, A. Colombo, C. Dragonetti, D. Marinotto, D. Roberto, S. Righetto, and R. De Angelis,J. Am. Chem. Soc.136, 5367 (2014); E. Cariati, C. Dragonetti, E. Lucenti, F. Nisic, S. Righetto, D. Roberto, and E. Tordin,Chem. Commun. 50, 1608 (2014); P. Beaujean, F. Bondu, A. Plaquet, J. Garcia-Amorós, J. Cusido, F. M. Raymo, F. Castet, V. Rodriguez, and B. Champagne,J. Am. Chem. Soc.138, 5052 (2016).
14U. Hohm,J. Mol. Struct.1054-1055, 282 (2013); A. J. Thakkar and T. Wu,
J. Chem. Phys.143, 144302 (2015).
15F. Castet, E. Bogdan, A. Plaquet, L. Ducasse, B. Champagne, and V.
Ro-driguez,J. Chem. Phys.136, 024506 (2012); M. de Wergifosse, F. Castet, and B. Champagne,ibid.142, 194102 (2015).
16V. W. Couling and D. P. Shelton,J. Chem. Phys.143, 224307 (2015). 17K. V. Mikkelsen, Y. Luo, H. Ågren, and P. Jørgensen,J. Chem. Phys.102,
9362 (1995).
18P. Kaatz, E. A. Donley, and D. P. Shelton,J. Chem. Phys.108, 849 (1998). 19L. Ferrighi, L. Frediani, and K. Ruud,J. Phys. Chem. B111, 8965 (2007). 20Y. Takimoto, C. M. Isborn, B. E. Eichinger, J. J. Rehr, and B. H. Robinson,
J. Phys. Chem. C112, 8016 (2008).
21S.-I. Lu, C.-C. Chiu, and Y.-F. Wang,J. Chem. Phys.135, 134104 (2011). 22J. Quertinmont, B. Champagne, F. Castet, and M. Hidalgo Cardenuto,
J. Phys. Chem. A119, 5496 (2015).
23D. M. Bishop, B. Kirtman, H. A. Kurtz, and J. E. Rice,J. Chem. Phys.98,
8024 (1993).
24Y. Luo, H. Ågren, O. Vahtras, P. Jørgensen, V. Spirko, and H. Hettema,
J. Chem. Phys.98, 7159 (1993).
25O. Quinet, B. Kirtman, and B. Champagne,J. Chem. Phys.118, 505 (2003). 26P. Norman, Y. Luo, and H. Ågren,J. Chem. Phys.109, 3580 (1998). 27Y.-H. Wang, C.-K. Wang, and Y. Luo,J. Mol. Struct.: THEOCHEM717,
223 (2005).
28J. F. Ward and C. K. Miller,Phys. Rev. A19, 826 (1979). 29C. Hättig and P. Jørgensen,Adv. Quantum Chem.35, 111 (1999). 30T. Helgaker, S. Coriani, P. Jørgensen, K. Kristensen, J. Olsen, and K. Ruud,
Chem. Rev.112, 543 (2012).
31M. de Wergifosse, V. Liégeois, and B. Champagne,Int. J. Quantum Chem.
114, 900 (2014).
32B. Orr and J. Ward,Mol. Phys.20, 513 (1971). 33D. M. Bishop,J. Chem. Phys.90, 3192 (1989). 34D. Shelton,J. Chem. Phys.84, 404 (1985). 35D. M. Bishop,Phys. Rev. Lett.61, 322 (1988).
36D. M. Bishop and D. W. De Kee,J. Chem. Phys.105, 8247 (1996). 37C. Hättig,Mol. Phys.94, 455 (1998).
38S. Karna and M. Dupuis,J. Comput. Chem.12, 487 (1991). 39C. Hättig,Chem. Phys. Lett.296, 245 (1998).
40O. Christiansen, J. Gauss, and J. F. Stanton,Chem. Phys. Lett.305, 147
(1999).
41T. H. Dunning,J. Chem. Phys.90, 1007 (1989).
42M. J. Frisch, G. W. Trucks, H. B. Schlegel, G. E. Scuseria, M. A. Robb,
J. R. Cheeseman, G. Scalmani, V. Barone, B. Mennucci, G. A. Petersson, H. Nakatsuji, M. Caricato, X. Li, H. P. Hratchian, A. F. Izmaylov, J. Bloino, G. Zheng, J. L. Sonnenberg, M. Hada, M. Ehara, K. Toyota, R. Fukuda, J. Hasegawa, M. Ishida, T. Nakajima, Y. Honda, O. Kitao, H. Nakai, T. Vreven, J. A. Montgomery, Jr., J. E. Peralta, F. Ogliaro, M. Bearpark, J. J. Heyd, E. Brothers, K. N. Kudin, V. N. Staroverov, R. Kobayashi, J. Normand, K. Raghavachari, A. Rendell, J. C. Burant, S. S. Iyengar, J. Tomasi, M. Cossi, N. Rega, J. M. Millam, M. Klene, J. E. Knox, J. B. Cross, V. Bakken, C. Adamo, J. Jaramillo, R. Gomperts, R. E. Stratmann, O. Yazyev, A. J. Austin, R. Cammi, C. Pomelli, J. W. Ochterski, R. L. Martin, K. Morokuma, V. G. Zakrzewski, G. A. Voth, P. Salvador, J. J. Dannenberg, S. Dapprich, A. D. Daniels, O. Farkas, J. B. Foresman, J. V. Ortiz, J. Cioslowski, and D. J. Fox, 09, Revision D.01, Gaussian, Inc., Wallingford, CT, 2009.
43K. Aidas, C. Angeli, K. L. Bak, V. Bakken, R. Bast, L. Boman, O.
Chris-tiansen, R. Cimiraglia, S. Coriani, P. Dahle, E. K. Dalskov, U. Ekström, T. Enevoldsen, J. J. Eriksen, P. Ettenhuber, B. Fernández, L. Ferrighi, H. Fliegl, L. Frediani, K. Hald, A. Halkier, C. Hättig, H. Heiberg, T. Helgaker, A. C. Hennum, H. Hettema, E. Hjertenæs, S. Høst, I.-M. Høyvik, M. F. Iozzi, B. Jansík, H. J. Aa. Jensen, D. Jonsson, P. Jørgensen, J. Kauczor, S. Kirpekar, T. Kjærgaard, W. Klopper, S. Knecht, R. Kobayashi, H. Koch, J. Kongsted, A. Krapp, K. Kristensen, A. Ligabue, O. B. Lutnæs, J. I. Melo, K. V. Mikkelsen, R. H. Myhre, C. Neiss, C. B. Nielsen, P. Norman, J. Olsen, J. M. H. Olsen, A. Osted, M. J. Packer, F. Pawlowski, T. B. Pedersen, P. F. Provasi, S. Reine, Z. Rinkevicius, T. A. Ruden, K. Ruud, V. V. Rybkin, P. Sałek, C. C. M. Samson, A. S. de Merás, T. Saue, S. P. A. Sauer, B. Schimmelpfennig, K. Sneskov, A. H. Steindal, K. O. Sylvester-Hvid, P. R. Taylor, A. M. Teale, E. I. Tellgren, D. P. Tew, A. J. Thorvaldsen, L. Thøgersen, O. Vahtras, M. A. Watson, D. J. D. Wilson, M. Ziolkowski, and H. Ågren,Wiley Interdiscip. Rev.: Comput. Mol. Sci.4, 269 (2014).
44See supplementary material at http://dx.doi.org/10.1063/1.4958736 for
vertical electronic excitation energies of lowest dipole allowed excitations and dipole moments of water, methanol, and DME.
45G. Maroulis,Chem. Phys. Lett.289, 403 (1998).
46P. Salek, T. Helgaker, O. Vahtras, H. Ågren, D. Jonsson, and J. Gauss,Mol.
Phys.103, 439 (2005).
47T. Kobayashi, K. Sasagane, F. Aiga, and K. Yamaguchi,J. Chem. Phys.110,
11720 (1999).
48A. J. Sadlej,Collect. Czech. Chem. Commun.53, 1995 (1988). 49T. Pluta and A. J. Sadlej,Chem. Phys. Lett.297, 391 (1998). 50G. H. Diercksen and A. J. Sadlej,Chem. Phys.61, 293 (1981).
51T. Kobayashi, K. Sasagane, F. Aiga, and K. Yamaguchi,J. Chem. Phys.111,
842 (1999).
52S. J. Van Gisbergen, J. G. Snijders, and E. J. Baerends,J. Chem. Phys.109,
10657 (1998).
53D. P. Shelton,Phys. Rev. A36, 3032 (1987).
54D. M. Bishop and B. Lam,Phys. Rev. A37, 464 (1988).
55S. P. Karna, G. B. Talapatra, W. M. K. P. Wijekoon, and P. N. Prasad,Phys.
Rev. A45, 2763 (1992).
![FIG. 2. Comparison between experimental and calculated frequency disper- disper-sions [D ( ω 2 L ) ] of the (a) first and (b) second hyperpolarizabilities of DME.](https://thumb-eu.123doks.com/thumbv2/123doknet/14507412.720363/8.891.68.430.80.549/comparison-experimental-calculated-frequency-disper-disper-second-hyperpolarizabilities.webp)

![FIG. 4. CCSD / d-aug-cc-pVDZ frequency dispersion [D ( ω 2 L ) ] for β ∥ (a) and γ ∥ (b) of methanol for di ff erent second- and third-order NLO pro-cesses](https://thumb-eu.123doks.com/thumbv2/123doknet/14507412.720363/10.891.68.429.66.496/ccsd-frequency-dispersion-methanol-erent-second-order-cesses.webp)