HAL Id: tel-01262605
https://tel.archives-ouvertes.fr/tel-01262605
Submitted on 26 Jan 2016
HAL is a multi-disciplinary open access
archive for the deposit and dissemination of
sci-entific research documents, whether they are
pub-lished or not. The documents may come from
teaching and research institutions in France or
abroad, or from public or private research centers.
L’archive ouverte pluridisciplinaire HAL, est
destinée au dépôt et à la diffusion de documents
scientifiques de niveau recherche, publiés ou non,
émanant des établissements d’enseignement et de
recherche français ou étrangers, des laboratoires
publics ou privés.
Distributed under a Creative Commons Attribution - NonCommercial| 4.0 International
License
Risk based surveillance for vector-borne diseases in
horses: combining multiple sources of evidence to
improve decision making
Céline Faverjon
To cite this version:
Céline Faverjon. Risk based surveillance for vector-borne diseases in horses: combining multiple
sources of evidence to improve decision making. Santé publique et épidémiologie. Université Blaise
Pascal 2015. English. �tel-01262605�
Université Blaise Pascal
Université d’Auvergne
N°D.U
. 2604
Année 2015
Ecole Doctorale Sciences De La Vie, Santé, Agronomie, Environnement
N° d’ordre : 674
THÈSE
Présentée à VetAgro Sup, Lyon
Pour l’obtention du grade de
DOCTEUR D’UNIVERSITÉ
(Spécialité : Épidémiologie)
Soutenue le 15 octobre 2015
par
Céline FAVERJON
Risk based surveillance for vector-borne diseases in
horses: combining multiple sources of evidence to
improve decision making
JuryMme STAERK Katharina
Royal Veterinary College, Londre
Rapporteur
Mr BAYLIS Matthew
Université de Liverpool
Rapporteur
Mr BIRON David
CNRS, Université Blaise Pascal
Président
Mr FISCHER Egil
Université d’Utrecht
Membre invité
Mme LEBLOND Agnès
INRA, VetAgro Sup, Lyon
Directrice de thèse
Mme DE KOEIJER Aline
Central Veterinary Institut, Lelystad
Co-directrice de thèse
Mr HENDRIKX Pascal
ANSES
Encadrant
À Marcel et Roger, qui n’auront pas vu la fin de ce travail.
ACKNOWLEDGEMENTS
First of all, I would like to thank the members of the jury, Katharina Stärk, Matthew Baylis and David
Biron, for having accepted the invitation to the defense of my doctoral thesis and for reading and
commenting this document.
Of course I also would like to express my thanks to my supervisors who offered me the opportunity of this PhD and who guided me throughout this work. Thank you to Aline de Koeijer for her advices and valuable comments especially regarding the tricky task of risk assessment. I am especially thankful for her
frankness and her warm welcome in the Netherlands. Merci à Agnès Leblond pour m’avoir toujours accompagnée et encouragée tout au long de ce travail. Merci aussi pour la confiance qu’elle m’a accordée et la liberté de choix qu’elle m’a laissée durant ces 3 années.
I also would like to thank all the members of the EMIDA-VICE project for the constructive and valuable interactions throughout this work. They contributed to my reflection as a Ph.D. student, but I am sure that they will also influence my future work. Particular thanks must be recorded to Egil Fischer for his support, advice and availability during these 3 years. Thank you also for our many discussions from statistics to Dutch and French culture. I also want to express my thanks to Gunnar Andersson for his great help with the Bayesian approach and statistics, for his advice and his kindness. Thank you also to René Bødker for his kind welcome in Denmark. Finally, special thanks to Flavie Vial for her help during this work especially during my “discovery” of the syndromic surveillance world.
In addition, I would like to thank all the institutes who provided the data used in this work and all persons involved in data collection networks. Without this essential contribution, the majority of activities outlined in this work would never have been realized. Particular thanks to the Ministère de l’agriculture français and the Direction Générale de l’Alimentation for having provided data on mortality in horses and on trade in living animals (a thank you to Pascal Hendrikx who was a perfect facilitator), to RESPE for the supply of data on nervous and respiratory symptoms in horses, to SAGIR for having provided data on mortality in wild birds, to MARS-Agri4cast at the Institute for Environment and Sustainability, to the European
Commission for the supply of temperature data, and to CIRAD with the EID-Med, and the IPPTS with the
support of the Directions départementales de la protection des population, who collected and shared entomological data.
This research was carried out as part of the VICE project funded under the FP7 EMIDA ERA-NET initiative. National funding within ERA-Net was provided by the Dutch Ministry of Economic Affairs (Project nr. BO-20-009-009). This work was also partially financially supported by IFCE and VetAgro Sup. I would like to thank all these institutes for having made this work possible.
Je tiens à remercier mes « collègues de couloir » pour nos nombreuses pauses café/gâteaux partagées. Merci notamment à Véronique la maman attentive, et à Luc pour le bureau de ministre. Un merci tout particulier à Alice pour sa sympathie et nos discussions multiples. Ces années n’auraient très
certainement pas été pareil sans toi dans ce bout de couloir. Je remercie également mes « collègues de Kfet », Bernadette et Caroline, pour les litres de café-philo avalés durant ces 3 années.
Un grand merci à la petite troupe des doctorants de VetAgro Sup pour nos espoirs et désespoirs en tout genre. Merci plus particulièrement à Julie ma chère co-bureau, à Sylvain mon co-représentant, et à
Anne-Laure ma co-sushi-ciné.
Je remercie également l’Unité EpiA pour les accueils sympathiques lors de mes passages clermontois et pour l’aide fournit lorsque j’en ai eu besoin. Merci en particulier aux (ex-)doctorants pour nos échanges et à Françoise pour sa disponibilité lors de mes OM multiples.
I would like to thank the team at CVI for the nice four months spent together “in the middle of nowhere”. Special thanks to Jantien for her kindness and her smile (especially when I tested the “weird” Dutch cuisine!).
Pour finir, je voudrais remercier ma famille pour son indéfectible soutien et mes amis pour ces belles années passées à leurs côtés (il y en aura d’autres, je n’en doute pas !). Mes remerciements tout
particuliers à Laure pour son œil aiguisé et attentif tout au long de ce travail (et pour tout le reste bien sûr aussi, surtout !).
Ich danke Malte für seine Geduld, seine Unterstützung und für un peu trop de choses pour pouvoir être exprimées ici et en allemand.
CHAPTER I: INTRODUCTION ... 1
A. CONTEXT AND NEEDS ... 1
1. Vector-borne diseases, a major concern ... 1
2. Equine industry, risk and specificities ... 1
2.1. Population at risk ... 1
2.2. Population not well tracked ... 2
3. Early warning ... 2
3.1. Active surveillance ... 3
3.2. Passive surveillance ... 3
3.3. Early warning in horse population ... 3
4. Risk assessments ... 4
5. Syndromic surveillance ... 5
B. RESEARCH QUESTION ... 7
C. CASES STUDIES ... 9
1. French equine industry ... 9
1.1. Equine population ... 9
1.2. Organization of the equine industry ... 9
1.3. Disease surveillance in French horses ... 10
2. Diseases of interest ... 11
2.1. African horse sickness ... 11
2.2. Equine encephalosis ... 12
2.3. West Nile virus ... 12
D. OUTLINES OF THE WORK ... 15
CHAPTER II: QUANTITATIVE RISK ASSESSMENTS ... 17
A. OVERVIEW... 19
1. General principle of risk assessment ... 19
1.1. Definitions and objectives ... 19
1.2. Method ... 20
2. Probability of entry ... 21
2.1. Definition ... 21
2.2. Estimation for VBDs ... 21
3. Probabilities of transmission and establishment ... 22
3.1. Probability of transmission ... 22
3.2. Probability of establishment... 23
4. Conclusion ... 24
B. PROBABILITIES OF ENTRY AND ESTABLISHMENT ... 25
1. Introduction ... 25
2. Paper 1 ... 26
C. COMPARISON OF DISEASES RISKS ... 41
1. Introduction ... 41
2.1. Model for risk assessment of viruses entry ... 42 2.2. Parameters ... 42 2.3. Input data ... 43 2.4. What-if scenarios ... 44 2.5. Calculations ... 44 3. Results ... 45
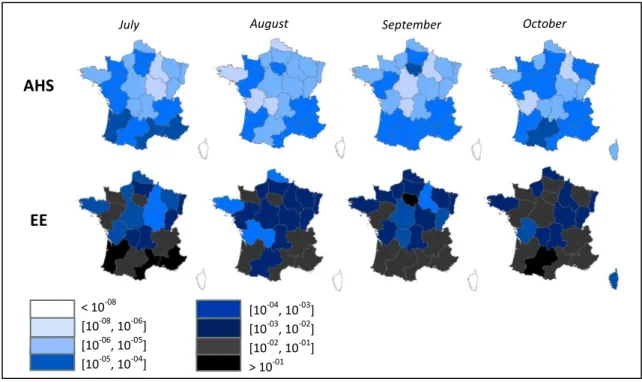
3.1. Spatiotemporal probability of entry ... 45
3.2. Sensitivity analysis ... 47
3.3. What-if scenarios ... 48
4. Discussion ... 49
D. DISCUSSION AND CONCLUSION ... 51
1. Discussion ... 51
2. Conclusion ... 52
CHAPTER III: SYNDROMIC SURVEILLANCE ... 53
A. OVERVIEW ... 55
1. Overall principle of syndromic surveillance ... 55
1.1. History ... 55
1.2. Definition and objectives ... 56
1.3. Overall approach ... 56
2. Preliminary steps ... 57
2.1. Definition of objectives ... 57
2.2. Overview of data available ... 57
2.3. Definition of syndrome ... 58
3. Data description and preprocessing ... 58
3.1. Data description... 58
3.2. Data preprocessing ... 58
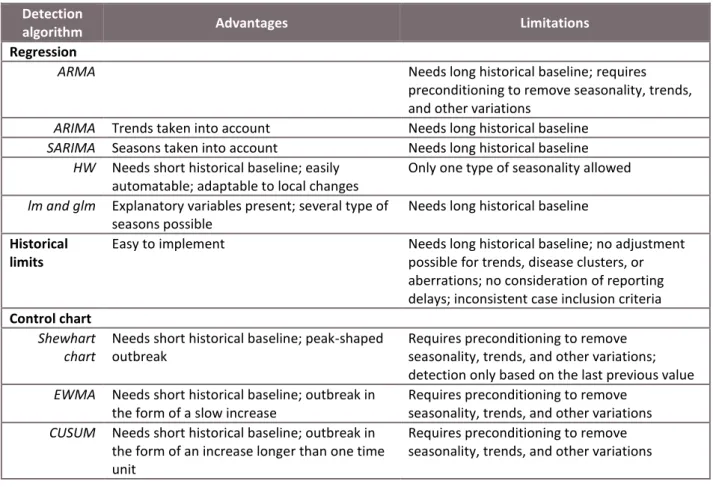
4. Detection algorithms ... 59
4.1. Choice of detection algorithm ... 59
4.2. Historical limits ... 61 4.3. Control charts ... 61 4.4. Regression methods ... 62 5. Assessment of performance ... 64 5.1. Performance metrics ... 64 5.2. Test data ... 65 6. Conclusion ... 66
B. COMPARISON OF PRE-PROCESSING METHODS ... 67
1. Introduction ... 67 2. Methods... 68 2.1. Data characterization... 68 2.2. Data pre-processing ... 68 2.3. Forecasting ... 70 2.4. Detection algorithm ... 70 2.5. Quantitative assessment ... 72 2.6. Implementation ... 72 3. Results ... 72
3.1. Baseline characterization ... 72
3.2. Smoothing and forecasting ... 73
3.3. Outbreak detection ... 76 4. Discussion ... 79 5. Conclusion ... 81 C. VALUE OF EVIDENCE ... 83 1. Introduction ... 83 2. Paper 2 ... 84
D. DISCUSSION AND CONCLUSION ... 93
1. Discussion ... 93
2. Conclusion ... 94
CHAPTER IV: MULTIPLE INDICATORS OF RISK ... 95
A. MULTISTREAM SYNDROMIC SURVEILLANCE ... 97
1. Introduction ... 97
2. Paper 3 ... 98
B. COMBINING QUANTITATIVE RISK ASSESSMENT AND SYNDROMIC SURVEILLANCE ... 111
1. Introduction ... 111
2. Material and Methods ... 112
2.1. Bayesian framework ... 112
2.2. Simulated EE outbreaks ... 113
2.3. Probability of EE introduction ... 115
2.4. Syndromic surveillance of EE ... 115
2.5. Presentation of the concept and first feedback ... 116
3. Results ... 116
3.1. Multivariate syndromic surveillance ... 116
3.2. Combining Risk assessment ... 117
3.3. Workshop output ... 117
4. Discussion and Conclusion ... 119
C. DISCUSSION AND CONCLUSION ... 121
1. Discussion ... 121
2. Conclusion ... 121
CHAPTER V: DISCUSSION... 123
1. Early warning system of VBDs in horses ... 123
1.1. Quantitative risk assessment ... 123
1.2. Syndromic surveillance ... 124
1.3. Combining risk ... 124
2. Support decision-making ... 125
3. Demonstrate freedom of disease ... 126
4. Practical implementation of integrated surveillance systems... 127
5. Conclusion ... 128
APPENDICES ... 131
List of Figures :
Figure 1: Estimated geographical distribution of horses population (ICFE-SIRE) ... 9
Figure 2: Geographic distribution of the French sentinel veterinarians involved in RESPE. ... 11
Figure 3 : National median probability of EE and AHS viruses entry to France. ... 45
Figure 4 : Median probabilities of viruses entry via an infectious host. Example of the year 2012. ... 46
Figure 5 : Median probabilities of viruses entry via an infectious vector. Example of the year 2012. ... 46
Figure 6 : At risk areas for viruses entry when entry via an infectious host and via an infectious vector are considered together. ... 47
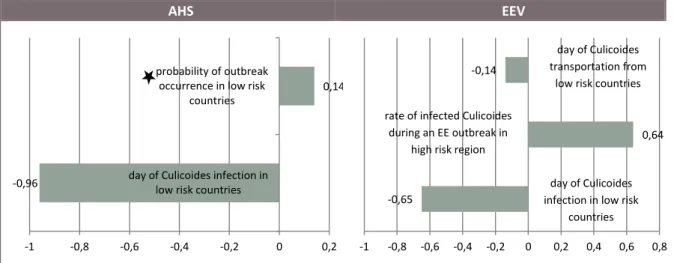
Figure 7 : Correlation of the model input parameters with the probability of entry of AHS and EE via an infectious host ... 47
Figure 8 : Correlation of the model input parameters with the probability of entry of AHS and EE via an infectious vector ... 48
Figure 9 : Overall method to implement syndromic surveillance. ... 57
Figure 10 : Number of nervous symptoms cases declared to RESPE from 2006 to 2013... 68
Figure 11 : Four time series used ... 69
Figure 12 : West Nile virus outbreaks ... 71
Figure 13 : Two examples of simulated outbreaks inserted in TS0. Positions of outbreaks identified with dotted lines above the peak. ... 71
Figure 14 : Decomposition of time series ... 73
Figure 15: Combining syndromic surveillance and probability of disease introduction to obtain a posterior probability that there is an ongoing outbreak. ... 111
Figure 16: EE simulated outbreak in Aquitaine ... 114
Figure 17: Value of evidence in France at week 31 in year 2012 from the simulated outbreak in Aquitaine, using a detection radius of 50 km ... 116
Figure 18: Posterior probability of EE outbreak in France in year 2012 during the simulated outbreak in Aquitaine from week 29 to week 32 ... 118
List of Tables :
Table 1: Main players in the French equine industry ... 10
Table 2: Mandatory notifiable diseases to the French ministry.. ... 10
Table 3 : import procedure for African horse sickness and equine encephalosis ... 42
Table 4 : Parameters specific of diseases and used for African horse sickness and Equine encephalosis in the model of viruses entry. ... 43
Table 5 : Description of scenario tested. Scenarios 1 to 5 changed the existing legislation, scenarios 6 to 7 changes imports from third countries. ... 44
Table 6 : Change (in %) on median probabilities of viruses entry to France compared to the default scenario. ... 49
Table 7 : Summary of the advantages and limitations of the main detection algorithms in the time series analysis. ... 60
Table 8 : Metrics used for evaluation of outbreak detection algorithms ... 65
Table 9 : Advantages and disadvantages of types of test data (Buckeridge et al. 2005) ... 66
Table 10 : Smoothing and forecasting performance of GLMs.. ... 74
Table 11 : Smoothing and forecasting performance of Holt-Winters models.. ... 75
Table 12 : System’s detection performances ... 77
Table 13 : system’s detection performances for time series fitted with generalized linear models... 78
List of Appendices:
Appendix 1: Model calculation for PW-host. Details of calculation regarding the AHSV introduction via the import of an infectious host. ... 133 Appendix 2: Model calculation for PW-vector. Details of calculation regarding the AHSV introduction via the import of an infectious vector. ... 141 Appendix 3: Model parameters. Description of all parameters used in the model calculation for PW-host and PW-vector. ... 143 Appendix 4: Article in a Professional journal published in ‘Bulletin épidémiologique du RESPE’. Juillet 2013. C. Faverjon, S. Lecollinet, S. Zientara, A. Leblond. ‘Peste équine, quel risque pour la France ?’
(http://www.respe.net/node/1604). ... 145 Appendix 5: Article in a Professional journal published in ‘N° spécial de Pratique Vétérinaire Equine’. Octobre 2014, 142-151. S. Zientara, C. Faverjon, A. Leblond, S. Lecollinet. La peste équine : épidémiologie, diagnostic et prévention. ... 147 Appendix 6: Poster presented at the 7th EPIZONE meeting in Brussel, 2013. ... 157 Appendix 7: Poster presentation at the Conference of the Society for Veterinary Epidemiology and
Preventive Medicine (SVEPM) in Ghent, 2015. ... 159 Appendix 8: Poster presentation at the Journées de l’Ecole doctorale SVSAE in Clermont-Ferrand, 2015. ... 161 Appendix 9: Poster presentation at the Conference of the Society for Veterinary Epidemiology and
Preventive Medicine (SVEPM) in Ghent, 2015. ... 163 Appendix 10: Article in a Professional journal published in ‘Bulletin Epidémiologie et Santé Animale’ by AEEMA. 2015. Épidémiol. et santé anim., 2015, 67, 87-95 ... 165 Appendix 11: EEV simulated outbreak in Normandie. ... 175 Appendix 12: Posterior probability of EE outbreak in France in year 2012 during the simulated outbreak in Normandie from week 36 to week 41. Radius for detection is 50 km (Andersson et al. 2015) ... 177
List of abbreviations
ACF: autocorrelation function AIC : Akaike information criterion AHS : African horse sickness
ARIMA : autoregressive integrated moving average
ARMA : Autoregressive moving average models AUC : Area Under the receiver operating characteristic curve
BTV : Bluetongue virus CUSUM : cumulative sums EE : Equine encephalosis EHV : Equine herpes virus EU : European Union
EWMA : exponential weighted moving average FAO : Food and Agriculture Organization of the United Nations
GLMs: generalized linear regression models HW: Holt-Winters generalized exponential smoothing
IFCE : Institut français du cheval et de l’équitation
LMs : Linear models NB : Negative Binomial
OIE : World organization for Animal health PACF : partial autocorrelation function R0 : basic reproductive number
RESPE : French network for the surveillance of equine diseases
RMSE : root-mean-squared error SARIMA : seasonal ARIMA
SIRE : “système d’information relatif aux équidés »
TRACES : Trade Control and Expert System TS : time series
USA : United States of America VBDs : vector-borne diseases WHO: World health organization WNV : West Nile virus
CHAPTER I: INTRODUCTION
1
CHAPTER I: INTRODUCTION
A. CONTEXT AND NEEDS
1. Vector-borne diseases, a major concern
The incidence of emerging infectious diseases has increased during recent decades due to changing socio-economic, environmental, and ecological factors (Jones et al. 2008). This is especially true for vector-borne diseases (VBDs), which represent almost 29% of emerging infectious diseases in the last decade (Jones et al. 2008). The introduction and spread into Europe in the 1979 of Aedes albopictus, an efficient vector for at least 22 arboviruses (Gratz 2004), of bluetongue virus (specifically BTV-8) in 2006 (Zientara and Sánchez-Vizcaíno 2013), and Schmallenberg virus in 2011 (Doceul et al. 2013) are good examples of the problem posed by VBDs. The specific emergence of VBDs is probably due in part to climate anomalies that occurred during the 1990s (Jones et al. 2008), as has been shown for BTV in Europe (Guis et al. 2012; Purse et al. 2005). Indeed, as explained by Massad and colleagues (Massad et al. 2011), “increased spread of insect-borne diseases is likely in a warmer world”. In the context of global warming, emerging VBDs are thus a growing concern, all the more so because of their huge economic and social impact (Marsh et al. 2008). To address this challenge, Lindgren and colleagues (Lindgren et al. 2012) argue in favor of developing novel approaches for risk assessment and surveillance in order to enhance preparedness and to facilitate public-health decision making.
2. Equine industry, risk and specificities
2.1. Population at risk
Horses, unlike livestock, typically travel frequently over short and long distances around the world for competition, training, and/or reproduction. These movements increase the risk of the dissemination of infectious diseases (Robin et al. 2011). This is a concern not just for the equine industry but also for public health. Indeed, numerous equine viruses are zoonotic (e.g., rabies, brucellosis, anthraw, glanders, leptospirosis, Hendra virus). However, controlling diseases spread by equines is not only important from a sanitary point of view but also with regard to the important economic weight of the equine industry, particularly in Europe (Liljenstolpe 2009). As an example, in 2010, the European equine industry encompassed 3.7 million horses, generated 100 billion euros a year, and provided the equivalent of 400,000 full-time jobs (Leadon and Herholzt 2009). Furthermore, the sector is growing, with an increase in the number of horse riders of 5% per annum. The introduction of exotic infectious disease may thus have
2 huge economic consequences, as was seen with the 13-week outbreak of African horse sickness in
Portugal in 1990, whose total cost was estimated around US $2 million (Portas et al. 1999).
2.2. Population not well tracked
Despite the sanitary and economic impacts of equine diseases, effective health regulations and biosecurity systems to ensure safe equine movements are not always in place at the national and international level (Leadon and Herholzt 2009; Murray et al. 2013). This was illustrated by the outbreak of equine influenza in Australia in 2007. Here, the authorities failed to contain the infection in quarantine following the
importation of one or more infected horses (Webster 2011). The horse population is also not well-tracked, which complicates the control and surveillance of diseases. In the EU, the implementation of mandatory passports for horses in 2008 has improved the tracking of horses. However, the database that contains the information on animal movements and deaths is not regularly updated. This has two consequences. Firstly, the exact number of horses and their geographical location is unknown, which is an obstacle for disease surveillance and control. Secondly, the exact number of horses transported between EU member states or within a country is still not available. Indeed, although the EU’s Trade Control and Expert System (TRACES) (Commission Decision 2003) provides information on the number of horses imported to and within the EU, several movements are not recorded in the database due to the absence of mandatory transport notification.
The difficulties of implementing proper health regulations and tracking systems can be explained by the complex reality of the world of horses. The equine industry includes a myriad of activities (e.g., tourism, equestrian sports, breeding and slaughtering of horses) and the various stakeholders engaged in each activity do so with different expectations, ranging from professional to leisure (Castejón-Montijano and Rodríguez-Fernández 2011).
Considering the potential health and financial risks posed by horses, it is especially important to develop novel approaches for the surveillance of exotic infectious diseases, such as VBDs. However, this also constitutes an additional challenge given the structure of the equine industry.
3. Early warning
A key point in controlling emerging or reemerging VBDs is early warning. Indeed, dealing with a disease outbreak in its early stages is easier and more economical than once it has become widespread (FAO-OIE-WHO Collaboration 2013; FAO-OIE-(FAO-OIE-WHO Collaboration 2006). Early warning systems are timely
surveillance systems aimed at predicting the probability that an outbreak is spreading to new areas in order to trigger prompt public health interventions (FAO-OIE-WHO Collaboration 2006). Different strategies such as active and/or passive surveillance are used to ensure the timeliness of detection.
CHAPTER I: INTRODUCTION
3
3.1. Active surveillance
Active surveillance refers to the active role of health authorities in data collection. The advantage is that active sampling may detect a disease without the observation of clinical signs. However, one of the major drawbacks is that, to detect rare diseases like a newly introduced exotic disease, active sampling has to be very large and redundant, which can be very costly (Doherr and Audigé 2001). To mitigate costs, it is possible to implement a specific type of active surveillance, known as risk-based surveillance. Risk-based surveillance is defined by Stärk and colleagues (Stärk et al. 2006) as the allocation of surveillance activities based on the probability of events with or without consideration of the consequences of the event, the management of the event, or the process of communication of the event. The term “targeted
surveillance” is also used (Doherr and Audigé 2001; de Koeijer et al. 2002; Salman 2003). The simple idea behind the concept is to collect samples from the segments of the population that have the highest probabilities of being infected, thus increasing the probability of disease detection (Salman 2003). In this way, this process decreases the required sample size without reducing the probability of detecting the disease. Risk-based surveillance is based on the concept of looking for something where it is most likely to be found; this approach thus requires reliable and thorough prior information on at-risk populations in order to ensure the appropriate representativeness of the sampling (FAO 2014; Oidtmann et al. 2013; Stärk et al. 2006).
3.2. Passive surveillance
In many countries, passive surveillance is one of the most common forms of surveillance for rare and exotic diseases. The term refers to any passive disease reporting systems in which veterinarians, farmers, or any other stakeholders notify authorities when they have sick animals. These surveillance systems are used to identify numerous diseases since they have several significant advantages: they cover a large part of the animal population and the costs associated with data collection and analysis are relatively low (Doherr and Audigé 2001; FAO 2014; Salman 2003). However, the performance of passive surveillance systems suffers from frequent under-reporting due to the lack of stakeholder awareness regarding a disease of interest. This may result in a failure to identify the disease (Hadorn et al. 2008) especially when it manifests in few or unspecific clinical signs (Doherr and Audigé 2001). In addition, potential fears of the disease’s consequences may also incite stakeholders to not report suspected cases (FAO 2014; Salman 2003). Under-reporting is especially problematic regarding the surveillance of exotic diseases, as exotic diseases have a low probability of occurrence, their symptoms usually not well known by practitioners, and the consequences of reporting an exotic disease in a new area may be dramatic.
3.3. Early warning in horse population
For the early detection of exotic VBDs in horses, both active and passive approaches could theoretically be implemented. However, as previously highlighted, one of the major drawbacks of the active approach is
4 that it can be very costly, especially when a disease is rare like exotic VBDs (Doherr and Audigé 2001). Risk-based active sampling could be implemented, but the equine industry suffers from a lack of accurate data regarding the populations at risk (e.g., details of animal movements, population size and location) which might complicate the planning and the implementation of such an active surveillance system. The efficiency of the classical passive surveillance approach in the early detection of an outbreak may also be limited due to the high probability of under-reporting, especially for exotic diseases.
Instead of relying on classical active or passive surveillance to detect new outbreaks, then, new approaches for estimating the probability of outbreak occurrence may constitute a promising way to improve the early detection of VBDs in horses. Different approaches can be considered in estimating this probability: classical risk assessment and syndromic surveillance.
4. Risk assessments
Risk assessments are the component of risk analysis that estimates the risks associated with a hazard, probability of hazard occurrence and its consequences (OIE 2010). Applied to exotic diseases, they are well-known tools for describing the probability of pathogen entry and spread within an area. The probability of entry is defined as the probability that a pathogen enters in a given area, considering all potential pathways of introduction and without considering the later steps of transmission (OIE 2014). The probability of “spread” is a vaguer concept and can include different sub-definitions, as presented by de Vos and colleagues (de Vos et al. 2011): (1) the probability of transmission, which is defined as the
probability that the pathogen is able to spread to susceptible hosts in the area at risk, (2) the probability of establishment, which is the probability that the pathogen is able to spread to susceptible hosts and to susceptible vectors given the conditions of introduction, and (3) the probability of spread, which is the probability that the pathogen is able to spread in time and space, considering both local and long-distance dispersal. Regarding the specific issue of early detection, the probability of spread is irrelevant, as it is related more to the assessment of a disease’s impact when early surveillance has already failed to detect and control an outbreak. Conversely, the probabilities of transmission and establishment are especially interesting for early detection as they indicate the time period and the most suitable area for early spread of a pathogen. In particular, the probability of establishment, which takes into account the place and time of entry, is an interesting parameter with which to evaluate the likelihood of an infection actually leading to local spread.
The above approach gives a probability of outbreak occurrence based on risk factors such as the suitability of an environment and climate for disease transmission, or the presence of risky practices (e.g.,
importation of animals from infected area). It can be used by decision makers for risk mitigation and/or to enhance stake-holders’ awareness of rare or emerging diseases through risk maps, as has already been proposed for some endemic VBDs (e.g., surveillance of West Nile virus in California (Brown 2012)
CHAPTER I: INTRODUCTION
5 (http://www.westnile.ca.gov/) or tick-borne diseases in Europe (Beugnet et al. 2009)
(http://www.fleatickrisk.com/FR/Pages/Home.aspx)).
5. Syndromic surveillance
To enhance traditional passive surveillance systems, methods based on the analysis of pre-diagnostic and unspecific routinely collected data were developed at the beginning of the 21st century. Such approaches, referred to as syndromic surveillance, aim to identify the early, often weak, signal of an outbreak in the absence of an accurate identification of the disease by medical practitioners or laboratories. There is no single and commonly accepted definition for syndromic surveillance but it is commonly accepted that it focuses on data collected prior to clinical diagnosis or laboratory confirmation (Katz et al. 2011; Shmueli and Burkom 2010). First developed in human medicine, it is now also widely used in veterinary medicine (Dórea et al. 2011); indeed, a recent review by Dupuy and colleagues (Dupuy et al. 2013a) identified at least 27 syndromic surveillance systems or initiatives in 12 European countries. However, regarding horses, few syndromic surveillance initiatives are in place and only two have been explicitly identified: one in UK with Equine quarterly surveillance reports (DEFRA/AHS/BEVA 2015) and another another in The Netherlands with the GD monitor system (Rockx et al. 2006).
Syndromic surveillance provides a risk of outbreak occurrence based on the abnormal evolution of a health-related indicator. Such approaches can be used to rapidly detect a well-known disease or new pathogen without a priori consideration and they thus promise to strengthen surveillance of VBDs in horses. However, because they rely on health-related indicators, syndromic surveillance usually has a low specificity (variations in the indicator might be due to disease or to another event) and it is not able to take into account other epidemiological information available for a disease, such as environmental risk factors.
CHAPTER I: INTRODUCTION
7
B. RESEARCH QUESTION
In the present work we explore various sources of information that shed light on the probability of occurrence of a newly introduced epidemic, focusing on exotic VBDs in horses. This is approached from various ends: is there a probability of entry? is there a probability of establishment? and is there a change in clinical signs, or other health-related indicator, that may signal such an epidemic?
The risk assessment for pathogen entry and establishment gives a risk profile of outbreak occurrence based on risk factors. However, an outbreak may also occur (with low probability) in a lower risk area instead of a higher risk area. The value of risk assessment for early detection is therefore more as supporting evidence than as formal evidence of an outbreak.
Similarly, syndromic surveillance gives a risk of outbreak occurrence based on the abnormal evolution of a health indicator. However, an outbreak may also occur without modification of such indicators. Even when significant modification is detected, the signal is often very unspecific and might occasionally be due to random fluctuation or to the effects of another outbreak or similar event. Again, then, the value of syndromic surveillance for early detection is more as supporting evidence than as formal evidence of an outbreak.
Risk assessments and syndromic surveillance can both suggest the possibility of a newly introduced epidemic, but they do not prove the presence of the disease. Using these approaches in concert, however, can increase the amount of evidence available and can be a way to improve confidence in predictions of newly introduced epidemics. In doing so, the interaction between risk assessments and syndromic surveillance must be considered carefully as these techniques are not fully independent. Indeed, for example, increased awareness via risk assessments might change the value of syndromic surveillance, because awareness will lead to increased reporting of data and thus to more numerous false alarms.
All these risk indicators are highly variable over time and space due to the unique nature of VBDs, which have a strong spatiotemporal pattern that is influenced by climatic and environmental factors (Altizer et al. 2006; Gage et al. 2008; Reisen 2010). Variability can also arise as a result of other non-biological fluctuations related to features of international trade, animal production, and so on. Spatial and temporal analyses must thus be performed in order to provide accurate data on the probability of occurrence of a newly introduced VBD.
To address the challenges of establishing early warning systems for VBDs in horses, the present work explores spatiotemporal risk assessments and syndromic surveillance, alone and in concert. In particular, we describe the limits and advantages of both methods in order to arrive at a new and more valuable approach for early warning systems.
CHAPTER I: INTRODUCTION
9
C. CASES STUDIES
As case studies, we focus on three emerging vector-borne diseases found in French horses: African horse sickness, equine encephalosis, and West Nile fever.
1. French equine industry
1.1. Equine population
In France there are between 900,000 and 1,000,000 horses, which are mainly used for sport and leisure. The horse population, as estimated by IFCE-SIRE, is more concentrated in Basse-Normandie (10% of the population) (IFCE - les Haras nationaux 2011) (see Figure 1). However, the exact number of horses and their geographical locations are unknown.
Figure 1: Estimated geographical distribution of horses population (ICFE-SIRE)
1.2. Organization of the equine industry
The equine industry in France is an important sector: it represents 4.3% of the full-time-job-equivalent in the agricultural sector and produces around 12 billion euros of revenue per year, mainly generated by horse-race betting operations (Lebrun 2010). Furthermore, France is the world’s fourth-largest exporter of horses and its equine industry is growing, with an increase in both the number of breeders and the size of the breeding population since the last decade (IFCE - les Haras nationaux 2011).
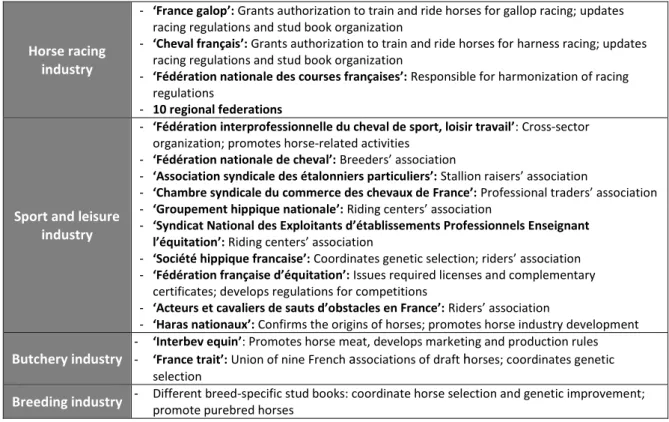
Nonetheless, the French equine industry is fragmented, with different organizations in charge of the various sub-industries: racing, sport and leisure, breeding, and butchery. All of these sub-industries are further subdivided into several sectors, each with its own specific regulations and organizations as presented in Erreur ! Source du renvoi introuvable.. The ‘Institut français du cheval et de l’équitation’
10 (IFCE) is a central institute which manages the SIRE database (‘système d’identification des équidés’) which collects all the data available on French microchipped equids.
Table 1: Main players in the French equine industry
Horse racing industry
- ‘France galop’: Grants authorization to train and ride horses for gallop racing; updates racing regulations and stud book organization
- ‘Cheval français’: Grants authorization to train and ride horses for harness racing; updates racing regulations and stud book organization
- ‘Fédération nationale des courses françaises’: Responsible for harmonization of racing regulations
- 10 regional federations
Sport and leisure industry
- ‘Fédération interprofessionnelle du cheval de sport, loisir travail’: Cross-sector organization; promotes horse-related activities
- ‘Fédération nationale de cheval’: Breeders’ association
- ‘Association syndicale des étalonniers particuliers’: Stallion raisers’ association
- ‘Chambre syndicale du commerce des chevaux de France’: Professional traders’ association - ‘Groupement hippique nationale’: Riding centers’ association
- ‘Syndicat National des Exploitants d’établissements Professionnels Enseignant
l’équitation’: Riding centers’ association
- ‘Société hippique francaise’: Coordinates genetic selection; riders’ association - ‘Fédération française d’équitation’: Issues required licenses and complementary
certificates; develops regulations for competitions
- ‘Acteurs et cavaliers de sauts d’obstacles en France’: Riders’ association
- ‘Haras nationaux’: Confirms the origins of horses; promotes horse industry development
Butchery industry
- ‘Interbev equin’: Promotes horse meat, develops marketing and production rules - ‘France trait’: Union of nine French associations of draft horses; coordinates genetic
selection
Breeding industry - Different breed-specific stud books: coordinate horse selection and genetic improvement;
promote purebred horses
1.3. Disease surveillance in French horses
The French surveillance system for equine diseases is mainly passive. The diseases for which mandatory reporting to the French ministry is in place are reported in Table 2. In addition to this classical passive reporting system, the French network for the surveillance of equine diseases, or ‘RESPE’
(http://www.respe.net/), collects declarations from veterinary practitioners registered as sentinels throughout France. RESPE, which was established in 1999, also issues alerts on equine diseases, such as information on diseases detected in French horses or in neighboring countries. More than 500 sentinel veterinarians are involved and cover 92 out of 96 French regions (see Figure 2). The veterinarians fill out a standardized questionnaire online and send standardized samples for laboratory diagnosis.
Table 2: Mandatory notifiable diseases to the French ministry. Category 1 = diseases of serious concern for public health and/or for the industry and that require preventive and control measures for the general interest, Category 2 = other diseases that also require preventive and control measures for the collective
interest.
Category 1
Horse specific: equine infectious anemia, African horse sickness, western and eastern equine encephalitis viruses, Venezuelan equine encephalitis virus
Non-horse specific: rabies, botulism, brucellosis, anthrax, Aujeszky’s disease, tuberculosis, Japanese encephalitis, West Nile virus, vesicular stomatitis virus Category 2 Equine viral arteritis, contagious equine metritis, glanders, trichinosis
CHAPTER I: INTRODUCTION
11 Active testing of horses is performed by private partners prior to sale and by public partners prior to export for three diseases: equine viral arteritis, equine infectious anemia, and contagious equine metritis. Active surveillance is also performed by private and public partners on breeding stock for certain breeds and on all stallions used for semen collection. No further active surveillance system exists for the surveillance of equine diseases in France.
Figure 2: Geographic distribution of the French sentinel veterinarians involved in RESPE.
2. Diseases of interest
2.1. African horse sickness
Like the Bluetongue and Schmallenberg viruses, African horse sickness (AHS) is a Culicoides-borne disease, and it has recently been highlighted as a potential threat for Europe (Zimmerli et al. 2010)(MacLachlan and Guthrie 2010). The disease is caused by a virus belonging to the Orbivirus genus of the Reoviridae family (Mellor and Hamblin 2004). There are nine different serotypes that confer some degree of cross-protective immunity (Mellor and Hamblin 2004). The virus is considered endemic in sub-Saharan countries, with rare outbreaks in North Africa and western Asia (MacLachlan and Guthrie 2010). The last AHS outbreak in Europe occurred between 1987 and 1990 in the Iberian Peninsula and resulted from the importation of infected zebras (Rodriguez et al. 1992a).
AHS is a non-zoonotic disease that affects all extant Equidae, although morbidity and mortality vary among species: as many as 90% of infected horses die within one week, while infection is largely
subclinical in zebras (Mellor and Hamblin 2004; Wilson et al. 2009). It is considered to be one of the most devastating diseases that affect equids. Four forms of the disease exist: horse sickness fever (moderate
12 fever and no mortality), cardiac form (subcutaneous edema, particularly of the head, neck, chest, and supraorbital fossae, mortality 50%), mixed form (combination of the cardiac and pulmonary forms, mortality 70%) and pulmonary form (sudden death, severe dyspnea, mortality 95%) (Mellor and Hamblin 2004). The incubation time is from 3 to 15 days (Theiler 1910).
2.2. Equine encephalosis
Equine encephalosis (EE) is caused by a virus of the Orbivirus genus of the Reoviridae family, and
encompasses seven different serotypes (Dhama et al. 2014; Viljoen and Huismans 1989). Similarly to AHS, EE has been recently highlighted as a potential threat for Europe (MacLachlan and Guthrie 2010; Zimmerli et al. 2010). Indeed, AHS and EE viruses are similar in many aspects: both are non-zoonotic Culicoides-borne members of genus Orbivirus that share the same vectors (Venter et al. 2002; Venter et al. 2000) and more or less the same geographical distribution. Like AHS, EE is also considered to be endemic in sub-Saharan countries, with rare outbreaks in North Africa and western Asia (Mildenberg et al. 2009; Wescott et al. 2013). The last major outbreak was reported in Israel in 2009 (Mildenberg et al. 2009). EE has never been observed in Europe (Dhama et al. 2014).
The epidemiology of EE is similar to AHS but the pathogenicities of the two viruses are different. The incubation time of EE is shorter (2-6 days (Theiler 1910)) and its transmission rate is higher (Lord et al. 2002). Moreover, despite the fact that EE was initially described as a “fever in horses simulating horse-sickness” (Theiler 1910), the symptoms of the two diseases are different. In particular, the mortality rate of EE is always low. In contrast to AHS, which causes severe cardiac and pulmonary symptoms, EE is characterized by a wide range of symptoms, such as abortions during the first 5-6 months of gestation, respiratory signs (e.g., nasal discharge, cough), and encephalitis (Dhama et al. 2014).
2.3. West Nile virus
West Nile virus (WNV) is a mosquito-borne arbovirus belonging to the genus Flavivirus (family Flaviviridae) and mainly transmitted by mosquitoes from the genus Culex (family Culicidae). Two distinct lineages exist: lineage 1 causes outbreaks throughout the world, while lineage 2 was limited to Africa until 2008, when it was introduced to Europe. Since the discovery of WNV in 1937 in Uganda (Smithburn et al. 1940), the geographic distribution of the virus has expanded and the disease is now considered endemic in Africa, Asia, Europe, Australia, the Caribbean, and the Americas (Campbell et al. 2002; Ozdenerol et al. 2013). In Europe, WNV emerged in the 1960s and several outbreaks have subsequently been documented in many European countries (Calistri et al. 2010). Even if the virus is now endemic in large parts of Europe, the number of reported outbreaks is presently increasing in Southern and Eastern Europe (e.g., Italy, Greece, Bulgaria, Croatia, Serbia, Albania)(Di Sabatino et al. 2014). This increase in the number of outbreaks, combined with the recent introduction and spread of lineage 2 in Europe (which has been associated with
CHAPTER I: INTRODUCTION
13 severe cases in humans, horses, and birds (Bakonyi et al. 2006; Calzolari et al. 2013; Hernández-Triana et al. 2014)), contribute to the growing concern about WNV in Europe.
The enzootic cycle of WNV is driven by its continuous transmission to susceptible bird species through adult mosquitoes. Its main hosts are birds, but the virus also affects more than 30 non-avian species. The susceptibilities of birds to WNV infection differ, with those in the order Passeriformes being most susceptible, followed by birds in the order Charadriiformes and domestic geese (order Anseriformes). Psittacine and gallinaceous birds are less susceptible. WNV in birds is usually asymptomatic, but may cause nonspecific clinical signs, neurological signs, and death (Pérez-Ramírez et al. 2014; Steele et al. 2000). Of non-avian species, the most affected are humans and horses (Kramer and Bernard 2001; Van der Meulen et al. 2005). In horses the clinical signs of WNV are almost exclusively neurological and reflect its pathology in the central nervous system (Cantile et al. 2000; Castillo-Olivares and Wood 2004). In humans two presentations of the disease are reported: uncomplicated WN fever (headache and myalgia, often accompanied by gastrointestinal symptoms) and WN meningoencephalitis (typical meningitis or encephalitis) (Campbell et al. 2002; Colpitts et al. 2012).
CHAPTER I: INTRODUCTION
15
D. OUTLINES OF THE WORK
Chapter 1 presents the context of this work and the associated research question. Chapter 2 gives first a brief presentation of the methods used for spatiotemporal quantitative risk assessments of the entry and establishment of VBDs in France, then presents spatiotemporal risk analyses that were performed to assess the probabilities of AHS and EE entry and establishment. Two routes of viral entry were considered together and two methods were used to assess the probability of viral establishment.
Chapter 3 first provides an overview on current approaches in syndromic surveillance. Then, an application of a classical method is presented which explores the impact of pre-processing methods on surveillance system performance. Finally, we discuss the application of Bayes’ rules to syndromic
surveillance with the goal of generating a quantitative output from syndromic surveillance and combining this with other epidemiological information.
Chapter 4 presents the combination of risk assessments with syndromic surveillance data using a Bayesian approach. We present a combination of various sources of epidemiological information, which originate from different syndromic surveillance systems and/or from syndromic surveillance and risk analysis.
Chapter 5 concludes with a discussion of the reliability and transparency of these complex surveillance systems and their usefulness in supporting decision-making.
CHAPTER II: QUANTITATIVE RISK ASSESSMENTS
17
CHAPTER II: QUANTITATIVE RISK ASSESSMENTS
This chapter explores quantitative risk assessments as a way to assess the risk of potential newly introduced VBDs in horses. Early detection of an exotic vector-borne pathogen can reduce the impact of the disease. It relies on two factors: the probability of pathogen entry and the probability of pathogen transmission and establishment. In fact, the probability of spatial and numeric spread is irrelevant to this process, as it is related more to the assessment of a disease’s impact after early detection has already failed to detect and prevent the outbreak. The parameters needed to assess these probabilities are specific to each VBD, given that a vector’s biology is closely linked to season and environment. A brief overview of the methods used for quantitative risk assessments of a VBD’s entry, transmission, and establishment is presented in Chapter II.A. This review highlighted that combination of probability of entry, probability of transmission and probability of establishment is still rarely implemented in animal health, as is a thorough study of multiple routes of pathogen entry. Building on this review, we thus developed a quantitative model to assess the probability of entry and establishment of AHS, one of the most devastating equine diseases known (Chapter II.B). We implemented spatiotemporal analysis to take into account the close link between VBDs and season/environment, and to consider other non-biological fluctuations related to features of international trade and animal production. Then, we evaluated the feasibility of adapting this model to other VBDs in horses (Chapter II.C). For that purpose, we focused on equine encephalosis (EE), as this disease is similar to AHS. The respective probabilities of entry into France were compared for each disease. Finally, we discuss the advantages and drawbacks of our model in assessing the risks of newly introduced VBDs in horses (Chapter II.D).
CHAPTER II: QUANTITATIVE RISK ASSESSMENTS
19
A. OVERVIEW
This section aims to present the general principle of risk assessment and explain how the probabilities of pathogen entry, transmission, and establishment can be assessed in the specific context of VBDs. We restrict ourselves to quantitative risk assessment and to the most popular methods for risk estimation.
1. General principle of risk assessment
1.1. Definitions and objectives
Risk assessment is the component of risk analysis that estimates the risk associated with a hazard (OIE 2014). The OIE has defined a hazard as a “biological, chemical, or physical agent in, or condition of, an animal or animal product with the potential to cause an adverse health effect” and a risk as “the likelihood of the occurrence and the likely magnitude of the biological and economic consequences of an adverse event or effect to animal or human health”.
The purpose of risk assessment is not so much to predict the introduction of a hazard but rather to help managers to better understand the associated risks (e.g., relative contributions of various factors, current areas of distribution, pathways for introduction, effectiveness of risk prevention actions). Risk assessment is clearly separated from risk management, but actively collaborates to achieve the ultimate goal:
implement measures that ensure the appropriate level of protection (Giovannini et al. 2004; OIE 2014).
Risk assessment may focus on different components, such as assessment of the entry, exposure, or consequences of a VBD, or on an estimation of the total risk by combining the results of these separate components in an overall assessment. To our knowledge, only a few papers in the animal health literature have linked these different probabilities in a quantitative manner: in a literature search, only three papers were found that addressed a combination of the probability of entry of a virus and its probability of establishment (EFSA 2009; Napp et al. 2012; de Vos et al. 2012). Similarly, a comprehensive approach to the routes of entry is rarely used; we found only one paper that analyzed a combination of routes of virus entry (Kilpatrick et al. 2004).
The entry assessment is conducted using the probability that the pathogen of interest enters the area at risk via any possible pathway, without regard to later steps of transmission.
The exposure assessment includes analysis of various factors, as presented by de Vos and colleagues (de Vos et al. 2011): (1) the probability of transmission, which is defined as the probability that the pathogen is able to spread to susceptible hosts in the area at risk, (2) the probability of establishment, which is the probability that the pathogen is able to spread to susceptible hosts and to susceptible vectors (and vice versa) given the conditions of introduction, and (3) the probability of extended spread, which is the
20 probability that the pathogen is able to spread in time and space, considering both local and long-distance dispersal.
The consequence assessment rates the impact of the disease and includes health, economic, social, ethical, and environmental considerations (Vose 2008). Disease persistence to next season won’t be considered in this work.
1.2. Method
The preliminary step of any risk assessment is to identify the hazard of interest. Hazard identification is fundamental in defining the objective of the risk assessment and must be carefully implemented (Vose 2008).
To perform risk assessment, several guidelines are available (see for example (Codex Alimentarius 1999; EFSA 2010; OIE 2014; USDA 2012; de Vos et al. 2011)) and no single method is applicable to all risk assessments. However, the following principles identified by OIE in the International Animal Health Code (OIE 2014) should ensure the quality of risk assessment:
Risk assessment should be flexible enough to deal with the complexity of real-life situations.
The risk assessment should be based on the best available information that is in accord with current scientific thinking. The assessment should be well-documented and supported with references to the scientific literature and other sources, including expert opinion.
Consistency in risk assessment methods should be encouraged and transparency is essential in order to ensure fairness and objectivity, consistency in decision making, and ease of
understanding by all interested parties.
Risk assessments should document the uncertainties, the assumptions made, and the effect of these on the final risk estimate.
The risk assessment should be amenable to updates when additional information becomes available.
Risk assessments can be either qualitative or quantitative, and both approaches are valuable. Qualitative assessments describe the risk in words (e.g., low, moderate, high), whereas quantitative assessments express the risk in numeric terms. Qualitative assessments are performed when no proper evaluation of the order of magnitude of uncertainties is possible while these uncertainties are typically high. Since there is no quantitative evaluation, there is also no proper mathematical model. Qualitative assessments are often used for routine decision making (OIE 2014). However, qualitative assessments do not provide sufficient information to accurately discriminate between small and large risks (Cox et al. 2005). Quantitative assessments provide more detailed information on the risk and can be more useful in distinguishing periods and areas at higher risk. However, the performance of a quantitative risk analysis is limited by the quality of data available. In addition, quantitative risk assessment can be deterministic or
CHAPTER II: QUANTITATIVE RISK ASSESSMENTS
21 stochastic. Deterministic approaches produce a single outcome from a given set of parameters,
uncertainty can be included but stochastic effects are usually ignored or crudely estimated. Stochastic approaches directly calculate the risk while also taking into account uncertainty and/or variability due to stochastic variation in input parameters. They produce a probability distribution of possible outcomes distinguishing impact via uncertainty and stochasticity.
2. Probability of entry
2.1. Definition
The probability of entry was previously referred to as the probability of release (OIE 2010). In 2014, the new version of the OIE’s Terrestrial Animal Health Code (OIE 2014) specified this a bit further and adopted the following definition: “Entry assessment consists of describing the biological pathway(s) necessary for an importation activity to introduce pathogenic agents into a particular environment, and estimating the probability of that complete process occurring”.
2.2. Estimation for VBDs
2.2.1. Routes of entry
The first step of the assessment of pathogen entry is to identify the potential routes available for introduction of the pathogen. Considering the specific case of VBDs, de Vos and colleagues (de Vos et al. 2011) listed the following pathways which should be considered in assessing the probability of VBD entry:
Entry of infected live animals via importation of livestock, zoo animals, pets, wildlife, or migratory birds;
Entry of an infected vector or its eggs or larvae through expansion of the vector’s habitat or transport with wind, tires, plant materials, transport vehicles, animals, humans, manure, or soil;
Import of contaminated biological material, such as semen, ova, embryos, serum, plasma, and modified live vaccines;
Import of contaminated animal products such as meat, milk, eggs, bush meat, and animal by-products (feathers, animal proteins, animal fats);
Entry of infected humans.
The importation of animals and transport of materials or other products can be legal or illegal. Illegal imports could contribute substantially to the probability of entry, but are obviously difficult to estimate and to quantify, and will therefore not be discussed further in this work (Chaber et al. 2010; Hartnett et al. 2007; Smith et al. 2012).
22
2.2.2. Calculation
The scenario tree, or scenario pathway, approach is commonly used to estimate the probability of pathogen entry (Vose 2008). Several examples are available for vector-borne pathogens, in particular for Rift Valley fever (Abdo-Salem et al. 2011), West Nile fever (Bessell et al. 2014; Douglas et al. 2007; Kilpatrick et al. 2004), equine infectious anemia (Asseged et al. 2012), and bluetongue (Hoar et al. 2004). Other examples are also available for non-vector-borne pathogens like classical swine fever (Bronsvoort et al. 2008) and foot-and-mouth disease (Yu et al. 1997).
The principle is first to describe all consecutive steps that result in disease entry. The complexity of these steps can vary according to the routes of entry considered (de Vos et al. 2011). For example, when an infected animal is legally imported, the animal must be viraemic (or latently infected) and the infection not detected during import procedure. However, when an infected wild bird enters the country via migratory routes, the only step to be considered in the probability of pathogen entry is that the animal is viraemic or latently infected. Each step has a conditional probability of occurrence and the probability of entry is calculated by multiplying the probabilities of all steps along the tree.
Model calculations can be used to quantitatively combine all these probabilities. These are especially useful when there is uncertainty and/or variability due to the presence of stochastic parameters, which is often the case in risk analysis.
3. Probabilities of transmission and establishment
3.1. Probability of transmission
3.1.1. Definition
The probability of transmission can be evaluated by calculating the basic reproductive number (R0) (see for
example (de Koeijer et al. 2002) and (Fischer et al. 2013)), which represents the expected number of secondary cases produced, in a completely susceptible population, by a “typical” infected individual during its entire period of infectiousness (Diekmann et al. 1990). The probability of transmission is thus not a probability but the number of new cases generated from one initial infected case.
If R0 > 1, then, on average, each infected animal will generate more than one infected animal, and the
infection will increase exponentially. If R0 < 1, an infected animal is not able to infect more than one other
animal, on average, and the infection should die out.
Due to the ease of interpretation of R0, it is very useful in distinguishing at-risk situations from those not at
CHAPTER II: QUANTITATIVE RISK ASSESSMENTS
23 R0 is often used to assess the transmission of exotic infectious diseases for which, by definition, the only
infected individual in a population is the introduced one.
3.1.2. Estimation for VBDs
Numerous approaches are available to estimate R0, but with vector-borne infection, the estimation of R0 is
slightly more complicated than for diseases with direct transmission. Indeed, with VBDs there is not only one population of infected/susceptible individuals to be considered, but at least two: hosts and vectors. Thus two transmission steps must be assessed: one infectious host with a fully susceptible vector population, and one infectious vector with a fully susceptible host population.
The following parameters must be considered to assess the probability of VBD transmission (de Vos et al. 2011):
Host density;
Vector abundance;
Biting rate;
Transmission probability per bite from host to vector and from vector to host;
Vector biology (e.g., survival rate, extrinsic incubation period).
Moreover, the vector-related data are highly dependent on environmental and climatic factors. Thus the R0 for VBDs also depends on the time period and the geographical location in which the pathogen enters
the area at risk.
Classical models for the assessment of VBD transmission probabilities are based on systems with one host and one vector or with two hosts and one vector. More details can be found, for example, in studies conducted on malaria (Macdonald 1955; Ponçon et al. 2008), African horse sickness (Backer and Nodelijk 2011; Lord et al. 1996), Rift valley fever (Fischer et al. 2013), and bluetongue virus (Brugger and Rubel 2013; Gubbins et al. 2008; Hartemink et al. 2009; de Koeijer et al. 2011). However, other authors have also proposed approaches based on two-host, two-vector models (Turner et al. 2013).
3.2. Probability of establishment
3.2.1. Definition
The probability of establishment represents what happens in terms of pathogen survival and growth during a transition phase between a pathogen’s entry and its actual spread. Establishment can be considered the initial spread of the disease and is expressed as the probability that “the infection has passed from a host via a vector to an indigenous host, while the basic reproduction number, R0, is higher
24 First, the probability of establishment depends on the route of pathogen entry. Beyond this, it depends on environmental and climatic conditions and therefore on the time period and the location in which the pathogen enters the area at risk.
3.2.2. Estimation for VBDs
Methods such as those already presented in the previous section on the probability of entry assessment (i.e. the scenario tree method) can be used to estimate the probability of establishment. As previously presented, the principle is to describe all consecutive steps that result in disease establishment.
For VBDs, the following steps must be taken into particular consideration (de Vos et al. 2011):
Pathway for introduction: route of exposure of indigenous host or vector;
Time of disease entry: temperature, humidity, and other parameters that may influence pathogen transmission;
Geographic location of disease entry: host density, vector abundance;
Vector-host interaction: biting rate, transmission probability per bite from vector to host and from host to vector.
Studies conducted on African horse sickness (de Vos et al. 2012), bluetongue (Napp et al. 2012), and epizootic hemorrhagic disease (EFSA 2009) provide examples of the assessment of the probability of VBD establishment using different routes of pathogen introduction (e.g., infectious host or infectious vector).
4. Conclusion
Quantitative risk assessments are common methods used to assess the risk posed by exotic pathogens. Various methods are available to implement risk assessment. Notably, different components of risk assessment (i.e. probabilities of entry, transmission, and establishment) can be assessed independently or together according to the objective of the risk assessment. Considering the case of VBDs, specific
parameters have to be taken into account to deal with the two steps of virus transmission (from vector to host and from host to vector). In particular, the time and the area of pathogen entry are important in assessments of the probabilities of pathogen transmission and establishment as a vector’s biology is closely linked to season and environment. However, analyses that combine the probabilities of entry, transmission, and establishment are still rarely implemented in animal health; the same is true regarding studies of combinations of different routes of entry. The development of such models could be a way to better understand and manage the risk associated with a disease.
CHAPTER II: QUANTITATIVE RISK ASSESSMENTS
25
B. PROBABILITIES OF ENTRY AND ESTABLISHMENT
1. Introduction
In this section we present a spatiotemporal assessment of the probability of introduction of African horse sickness (AHS) to France. We developed a model that combined the probability of entry with the
probability of establishment and included two routes of virus entry, expecting that such a model would enable a greater understanding of the risk associated with AHS in France compared to risk assessments involving only a single probability parameter or a single route of introduction.
This work was published in BMC Vet Research (see below for the main text and Appendix 1, Appendix 2, and Appendix 3 for the additional files of the paper), two professional publications in French journals (see Appendix and Appendix 5), and one poster presentations at the EPIZONE meeting in 2013 (see Appendix 6).
26
2. Paper 1
CHAPTER II: QUANTITATIVE RISK ASSESSMENTS
CHAPTER II: QUANTITATIVE RISK ASSESSMENTS
CHAPTER II: QUANTITATIVE RISK ASSESSMENTS
CHAPTER II: QUANTITATIVE RISK ASSESSMENTS
CHAPTER II: QUANTITATIVE RISK ASSESSMENTS
CHAPTER II: QUANTITATIVE RISK ASSESSMENTS
CHAPTER II: QUANTITATIVE RISK ASSESSMENTS