Publisher’s version / Version de l'éditeur:
Applied Biochemistry and Biotechnology, 162, 2, pp. 460-475, 2010
READ THESE TERMS AND CONDITIONS CAREFULLY BEFORE USING THIS WEBSITE.
https://nrc-publications.canada.ca/eng/copyright
Vous avez des questions? Nous pouvons vous aider. Pour communiquer directement avec un auteur, consultez la
première page de la revue dans laquelle son article a été publié afin de trouver ses coordonnées. Si vous n’arrivez pas à les repérer, communiquez avec nous à PublicationsArchive-ArchivesPublications@nrc-cnrc.gc.ca.
Questions? Contact the NRC Publications Archive team at
PublicationsArchive-ArchivesPublications@nrc-cnrc.gc.ca. If you wish to email the authors directly, please see the first page of the publication for their contact information.
NRC Publications Archive
Archives des publications du CNRC
This publication could be one of several versions: author’s original, accepted manuscript or the publisher’s version. / La version de cette publication peut être l’une des suivantes : la version prépublication de l’auteur, la version acceptée du manuscrit ou la version de l’éditeur.
For the publisher’s version, please access the DOI link below./ Pour consulter la version de l’éditeur, utilisez le lien DOI ci-dessous.
https://doi.org/10.1007/s12010-009-8709-6
Access and use of this website and the material on it are subject to the Terms and Conditions set forth at
Activation of Nanoparticles by Biosorption for E. coli Detection in Milk
and Apple Juice
Naja, Ghinwa; Bouvrette, Pierre; Champagne, Julie; Brousseau, Roland;
Luong, John H. T.
https://publications-cnrc.canada.ca/fra/droits
L’accès à ce site Web et l’utilisation de son contenu sont assujettis aux conditions présentées dans le site LISEZ CES CONDITIONS ATTENTIVEMENT AVANT D’UTILISER CE SITE WEB.
NRC Publications Record / Notice d'Archives des publications de CNRC:
https://nrc-publications.canada.ca/eng/view/object/?id=4f1d88d0-6565-41cf-9789-184d4de6de95 https://publications-cnrc.canada.ca/fra/voir/objet/?id=4f1d88d0-6565-41cf-9789-184d4de6de95Activation of Nanoparticles by Biosorption for E. coli
Detection in Milk and Apple Juice
Ghinwa Naja&Pierre Bouvrette&Julie Champagne&
Roland Brousseau&John H.T. Luong
Received: 8 June 2009 / Accepted: 5 July 2009 / Published online: 1 August 2009
# Humana Press 2009
Abstract Two types of silver nanoparticles were activated by specific sorption of biomolecules for the detection of Escherichia coli. The capture of this bacterium was performed using polyclonal antibodies (anti-E. coli) biosorbed onto nanospheres or nanorice through a protein-A layer. The bacterial detection was achieved using surface enhancement Raman scattering in order to compare the performance of these two nanoparticles. The activated silver nanospheres showed a better performance mainly due to the dimension of these nanoparticles. The detection limit has been established using the automated Raman mapping system. The technique was capable of detecting 103cells/mL in milk and apple juice without any pre-enrichment. With an overall assay time less than 1 h, the process could be easily adapted to detect other pathogens by selecting the pertinent antibody. Furthermore, PCR was used for the DNA verification to assess whether the selected bacterial strain was identical before and after detection.
Keywords Contaminated milk and apple juice . Escherichia coli . Nanoparticles . Detection limit . Bacterial capture . Biosorption
Introduction
Escherichia coli is one of the main bacterial species of the mammalian intestines. New strains of E. coli arise all the time from the natural biological process of mutation, and some of those strains have characteristics that can be harmful to a host animal. These dangerous
G. Naja
:
P. Bouvrette:
J. Champagne:
R. Brousseau:
J. H. LuongBiotechnology Research Institute, National Research Council Canada, H4P 2R2 Montreal, Quebec, Canada
G. Naja (*)
Everglades Foundation, Science Department, Palmetto Bay, FL 33157, USA e-mail: mnaja@evergladesfoundation.org
J. H. Luong
Department of Chemistry, University College Cork, Cork, Ireland
pathogenic strains can cause human diseases such as traveler’s diarrhea, infant diarrhea, and infections of the urinary tract. The detection of E. coli in food signals the potential presence of pathogens. One of the major concerns for the food industry is to prevent bacterial contamination during the manufacturing process. Albeit the food sanitation regulatory and consumer pressure to ensure better safety of their products, the processing food industries could encounter problems due in the major cases to a cross contamination and inadequate temperature control [1, 2]. As an example, a major contamination source in the dairy industries is the environment and the milk processing equipment. Under optimal hygienic conditions of milking and cooling equipment the number of germs (plate count) should be under 10,000 germs/mL of milk (as specified in the Food and Agriculture Organization of the United Nations). The other type of contamination comes from the consumption of non-pasteurized drink (like raw milk or apple juice) which could nevertheless pose a health risk [3]. The hazard analysis of critical control points (HACCP) system is a proactive strategy that identifies the critical control points at which these hazards can be managed. In a HACCP system, methods are needed for assessing the quality of the products and materials and detecting (among other things) microorganisms in process lines. Fast and accurate measurements should be performed to ensure the safety of the final product.
Classical microbiological tests for the detection and identification of pathogenic elements in samples usually involve a number of analyses of long duration conducted by highly qualified scientific personnel [4, 5]. During the last 10 years, new and faster techniques based on molecular biology principles have emerged to supplement traditional methodology [6,7]. In brief, polymerase chain reaction (PCR) and DNA-hybridization are based on the genetic information involving biochemical and immunological characteristics sensitive to the environmental conditions [8]. Factors that limit the applicability of DNA microarray for detection of pathogens are the time and effort required to isolate DNA from microorganisms, the labeling and hybridization of the DNA to the microarray, and the expensive laboratory equipment required to analyze the hybridization profile. Other rapid bacterial detection techniques have been developed using emerging analytical methods [9,10]. Mathew et al. [11] developed a new method based on a chemiluminescence assay for the detection of E. coli, whereby the light emitted from a chemical reaction involving an E. coli enzyme was measured and data correlated with the E. coli density ranging from 105 to 108cells/mL. Tang et al. [12] studied a new amperometric technique for rapid detection of E. coli using a bi-enzyme biosensor. The amplified response current is linear with the E. coli population ranging from 1.6×10³to 1.0×10⁷cells/mL. Yang et al. [13] developed an impedance immunosensor method for rapid detection of E. coli by immobilizing anti-E. coli antibodies onto an indium tin oxide interdigitated array microelectrode. The electron-transfer resistance is proportional to the E. coli population ranging from 4.36×10⁵to 4.36×
108cells/mL. Gunasekera et al. [14] applied flow cytometry (limited to total bacterial counts) to microbial analysis based on an enzymatic clearing of milk to determine total bacteria in milk. Yang et al. [15] used semiconductor quantum dots as fluorescence labels in immunoassays for simultaneous detection of two species of food-borne pathogenic bacteria. With significant improvements in lasers, spectrometers, and detectors, the application of Raman spectroscopy to complex biological materials has been considered as an emerging analytical tool in medical microbiology because of its real-time diagnostic capabilities [16]. However, the usefulness of Raman spectroscopy is very limited because the resulting weak signal can be easily masked by fluorescence [17]. Enhancement of the biological sample scattering signal could be obtained by applying surface enhancement Raman scattering (SERS) mainly based on the inelastic scattering of photons by molecules within a few angstroms of a structured metal surface (silver, gold, or copper). SERS has been widely
applied to study bioorganic compounds and a Raman database has been established for proteins, amino acids, peptides, and other types of molecules, occurring at concentrations as low as pico- and femto-molar [18–21].
The present paper presents a new method for bacterial capture based on the activation of silver nanoparticles. Two types of activated nanoparticles (nanospheres and nanorice) were used in order to compare their performance. The capture of bacteria was performed using polyclonal antibodies (anti-E. coli) biosorbed onto the nanoparticles through a protein-A layer. These polyclonal antibodies reacting with specific epitopes on the surface of the bacteria ensured the high selectivity of the technique. The bacterial detection has been performed using surface enhancement Raman scattering to detect E. coli in original food samples (milk and apple juice) without any pre-enrichment. The detection limit of the technique has been established using the automated mapping system of the Raman. Furthermore, PCR was used for the DNA verification to assess whether the selected bacterial strain was identical before and after detection.
Materials and Methods Silver Nanosphere Preparation
Silver sol (Aldrich, Milwaukee, WI, nano-powder, 70 nm), 10.8 mg, containing 0.2 mM of Ag were mixed in 50 mL of high-performance liquid chromatography (HPLC) water grade adjusted to pH 6 using 0.1 N HCl with overnight sonication to attain a good suspension. pH 6 was optimal for the protein-A sorption onto the silver nanoparticles (data not shown). Silver Nanorice Preparation
Monodispersed hematite nanorice structures were prepared according to Wang et al. [22] applying a forced hydrolysis of ferric chloride solution by aging 200 mL of aqueous solution containing 2.0×10⁻²M FeCl
3 and 4.0×10⁻⁴M KH2PO4 at 100 °C for 72 h in a
500-mL round bottom flask with a water condenser. The resulting precipitate was centrifuged and washed four times with deionized water and ethanol. The precipitate was redispersed in 50 mL ethanol. No further purification or separation was necessary due to excellent monodispersity of the nanostructures. For producing nanorice with an external silver nanoparticles coating [23, 24], the suspension was washed (pelleted, rinsed with deionized water, and re-pelleted, 30 min at ∼3,400×g), suspended in 0.1 M aqueous sodium borohydride, washed again (with the second spin done for 10 min at ∼2,800×g), and then resuspended in a 0.05 M silver nitrate aqueous solution.
Silver Nanoparticle Activation
Protein-A, 2.5 mg, (Sigma-Aldrich, St. Louis, MO) was added to a 50 mL suspension of silver nanoparticles and gently stirred. After 5 min at room temperature, a 10% bovine serum albumin (BSA) solution, prepared in PBS, pH 7.4, was added to a final concentration of 0.2% (w/v) in order to stabilize the mixture. Protein-A-coated Ag nanoparticles were recovered by centrifugation at 3,000×g for 10 min at 10 °C (Beckman, model J2-21M, Fullerton, CA). The resulting pellet from the centrifuge was washed twice by resuspending it in 30 mL PBS containing 0.2% BSA, each time followed by centrifugation. To check the efficiency of protein-A sorption onto Ag nanoparticles, a new batch of silver nanoparticles
was used, free of BSA. Two hundred micrograms of rabbit anti-E. coli polyclonal purified antibodies (Biodesign, Saco, MI) were added to 5 mL of the silver nanoparticle suspension, pre-coated with protein-A, and gently mixed for 12 h at 4 °C. The mixture was then centrifuged at 3,000×g for 10 min at 10 °C to separate the unbound anti-E. coli from the solids. The resulting immunosilver nanoparticles were washed twice by centrifugation in 10 mL of PBS (pH 7.4) and the pellet obtained was suspended in 1.5 mL of PBS (pH 7.4). An identical procedure was followed for the activation of the immunosilver nanorice. Bacterial Culture
E. coli ATCC 13529 (American Type Culture Collection, Manassas, VA) was cultivated on tryptic soy agar (TSA, Difco, Detroit, MI) at 37 °C. The culture was maintained at 4 °C. Bacterial suspensions, used in the SERS experiments, were prepared by collecting colonies from solid cultures and suspending the cells in PBS at pH 7.4.
Bacterial Capture and Detection Limit
The immunosilver nanoparticle and immunosilver nanorice suspensions (100 µL) were added to an equal volume of the E. coli ATCC 13529 suspension in PBS, pH 7.4. The detection limit was established by changing the bacterial concentration from 109cells/mL to 1 cell/mL. A control was always performed containing the activated solid without the bacteria. The final suspension containing the bacteria and the activated immunosilver nanoparticles was roll-mixed at 25 °C for 20 min. The immuno-captured bacterial cells were collected by centrifugation. The sediment was collected and washed three times in PBS, pH 7.4 to remove any unbound bacteria. Bacterial cells, immuno-captured on silver nanoparticles, were finally suspended in PBS (∼100 µL, pH 7.4) and the specimen was submitted to Raman spectroscopy and to scanning electron microscopy.
Method Application Using Milk and Apple Juice
Milk and apple juice were spiked with E. coli to attain a final concentration of 103cells/mL. The same procedure for the bacterial capture was followed to detect bacteria in these beverages whereby only the activated immunosilver nanospheres were roll-mixed at 25 °C for 20 min in the contaminated liquid sample. A control was always performed containing the activated solid in milk and apple juice without the bacteria. The obtained suspensions were submitted to Raman spectroscopy to detect the presence of the bacteria.
Raman Identification
Visible SERS spectra were recorded using a Raman analyzer LabRAM HR 800 (Horiba/ Jobin Yvon, Longjumeau, France) equipped with a frequency-doubled Nd:YAG 532.1-nm laser, operated at 5 mW. The Raman spectrometric analyzer is integrated with a microscope. A CCD detector (open electrode) was operated at −75 °C and the spectra were recorded with a resolution of 0.3 cm−1/pixel of CCD. The instrument was wavelength calibrated with
a silicon wafer focused and collected as a static spectrum centered at 521 cm−1. The particle
suspension (20 μL) was immobilized by the direct deposition of the sample on a glass slide. The laser beam was focused on a 2 μm area with particles to characterize using the microscope. The microscope was used to localize the bacteria. Each spectrum took ∼5 min to acquire. For assessing the reproducibility of this approach, ten replicate spectra were
obtained from each sample from different points of the matrix, focusing on the immunosilver nanoparticles. The LabSpec software package (Horiba/Jobin Yvon) running under Windows XP was used for the instrument control and data acquisition. ASCII data were exported from the LabSpec software into Microcal™ Origin version 6.5 (Microcal Software). After Raman detection, the bacterial cells immuno-captured onto silver nanospheres were resuspended and used for re-culture and DNA extraction.
Optical Identification
Scanning electron microscopy (SEM) micrographs were obtained using a Hitachi scanning electron microscope (model S-2600 N, Tokyo, Japan) operating in the high-vacuum mode with an acceleration voltage of 20 kV. The different samples were directly immobilized on a microscope glass slide. Transmission electron microscopy (TEM) data were recorded using a Philips CM20 200 kV electron microscope (Hillsboro, OR) equipped with an Oxford Instruments energy-dispersive X-ray diffraction spectrometer (Link exl II) and an Ultrascan 1000 CCD camera. The TEM analysis was performed on samples dropped onto porous carbon films on 300-mesh copper grids and allowed to dry in air.
Bacterial DNA Extraction and PCR Detection
Samples containing E. coli (from contaminated milk and apple juice) attached to activated silver nanospheres after Raman detection were resuspended and recultivated in tryptic soy agar for further identification. Negative (no E. coli) and positive controls were always used. To identify the types of bacteria after re-cultivation, microscope observations (shape), Gram stain coloration tests (Gram positive or Gram negative), and finally DNA extraction for PCR detection were performed. The PCR detection was conducted using E. coli (Biotechnology Research Institute Collection) with a specific gene coding for one protein (GFP). For DNA extraction, 1 mL of the modified E. coli before (control) and after Raman detection (recultivated) was centrifuged at 13,000×g for 3 min. The pellet was washed in HPLC water and then suspended in 0.5 mL HPLC water and boiled for 15 min. The resulting lysate was centrifuged at 13,000×g for 3 min. The collected supernatant was submitted to the PCR procedure.
The presence or absence of E. coli was examined by PCR using primers targeting the GFP gene. The PCR mixture contained 5 μL of 10× PCR buffer (100 mM Tris–HCl, 15 mM MgCl2, and 500 mM KCl at pH 8.3), 5 μL of 2 mM deoxynucleoside triphosphates,
2 μL of each of the forward and reverse primers GFP-F and GFP-R (stock concentration, 25 mM), 0.5 μL (2.5 U) of Taq DNA polymerase (New England Biolabs) and 50 ng of genomic DNA or 2 μL of bacterial lysate. A positive control, containing pure bacteria, was prepared using an overnight culture started from a single colony isolated on a Petri dish. HPLC grade water (J. T. Baker), autoclaved and filtered, was added to give a 50-μL final volume. Amplification was performed in a Mastercycler® Ep gradient (Eppendorf). The PCR sequence began with a denaturation step for 5 min at 94 °C, followed by 35 amplification cycles consisting of 30 s of denaturation at 94 °C, 30 s of annealing at 50 °C, and 45 s of elongation at 72 °C, and ended with a final extension for 7 min at 72 °C. The length of the amplicons generated was ∼850 bp. Vistra Green (GE Healthcare) was added to 10% (5 μL) of each amplification reaction product as well as to the 1 kb Plus DNA ladder (Invitrogen) at a final concentration of 1× prior to electrophoresis on a 1.2% (w/v) agarose gel containing 1× Tris–acetate buffer, pH 8. The DNA bands were visualized using the KODAK Gel Logic 200 Imaging System (Mandel) and the SYBR green filter.
Results and Discussion Microscopic Observation Silver Nanospheres
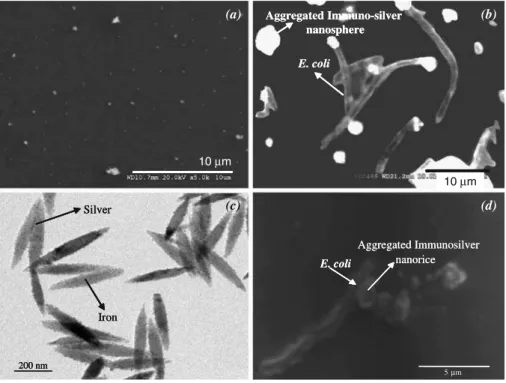
The silver nanospheres were brighter and easily identified under the scanning electron microscope (Fig.1a, b) as they possessed higher secondary electron and backscattered electron yields than the surrounding organic matter. The aggregated particles as well as the bacteria were also clearly distinguished using the confocal microscope of the Raman to facilitate the laser focusing during the SERS analysis. The silver nanospheres formed well-dispersed particles of ∼200 nm (Fig.1a). The minimum size of the initial nanospheres was ∼60 nm, corresponding well with the silver nanoparticle characteristics. The mean particle size was determined to be ∼232 nm, forming a normal distribution. Fig.1bclearly shows the presence of E. coli sorbed onto the immunosilver nanospheres via a surface layer containing proteins including the antibodies. The rod shape of each bacterial cell was generally well preserved being 1.1 to 1.5 µm wide by 2.0 to 6.0 µm long with some bacteria forming a chain. Silver Nanorice
The silver nanoparticle deposition onto the nanorice surface and E. coli sorption were followed by transmission electron microscopy (Fig. 1c) and by scanning electron
200 nm Iron Silver E. coli nanorice Aggregated Immunosilver 5 µm Aggregated Immuno-silver nanosphere E. coli (a) (b) (c) (d) 10 m 200 nm Iron Silver 200 nm Iron Silver E. coli nanorice Aggregated Immunosilver Aggregated Immuno-silver nanosphere E. coli 10 µm 10 µm
Fig. 1 SEM micrographs of the silver nanospheres a before sorption (×5,000) and b after E. coli sorption (×3,000). TEM micrographs of the silver nanorice c before sorption (×5,000) and d after E. coli sorption (×3,000)
microscopy (Fig.1d). The nanorice particles consisted of uniform size particles (472±57 nm in length×76±7 nm in width, n=20) and they were agglomerated because of their magnetic properties, forming compact clusters of about 2 µm. The TEM micrographs (Fig. 1c) of silver nanoparticles show their uniform deposition on the nanorice’s surface. The silver nanoparticles (5 to 10 nm in diameter) were exclusively covering the surface of the nanorice as showed by the TEM images. About 200 silver nanoparticles were sorbed onto each nanorice particle, representing ∼60% coverage ratio. The silver nanorice particles were still aggregated in big clusters due to their magnetic properties. The E. coli cells sorbed onto the immunosilver nanorice were also distinguished by SEM (Fig.1d). The same observations as reported for the silver nanoparticles could be confirmed for the silver nanorice. The rod shape of each bacterial cell was also generally well preserved.
SERS Spectra
The SERS spectra recorded with the silver nanospheres (Fig. 2) after bacterial sorption show an interesting feature indicating the presence of several biomolecules identifying the bacteria. The use of the confocal microscope was essential to focus the laser and obtain an optimal SERS response. The presence of the silver nanospheres enhanced the spectra by several orders of magnitude. The evaluation of this enhancement could be performed by comparing the SERS of E. coli obtained in the present paper (Fig.2) to the normal Raman spectrum [25,26]. The normal Raman spectra of bacteria obtained at 532 nm (not shown) did not yield any conclusive information and the intensity was several orders of magnitude weaker than the corresponding SERS spectrum. The higher intensity of the SERS spectrum of bacteria was attributed to surface enhancement due to the presence of the silver colloid [27]. Such behavior has been reported in the literature for many other molecules and biomolecules [19,20,28,29].
(a)
Raman Shift (cm-1)
200 400 600 800 1000 1200 1400 1600
Raman Intensity (a.u)
40 60 80 100 120 232. 206 0 20 1270 1056 1029 990 945 906 772 672 620 582 457 1354 1462 1487 1525 1593 1690 500 600 700 800 900 1000 1100 (b) 1200 1300 1400 1500 1600 1700 Nucleic acids Lipids Proteins (c) 1270 Carbohydrate Phenylalanine Nucleic acids
Fig. 2 Visible (532 nm) SERS Raman spectra of the immunosilver nanospheres a after bacterial sorption (103cells/mL), b and c the same enlarged spectrum
The enhancement obtained in the case of bacteria attached to immunosilver nanorice (Fig.3) was lower than expected and also when compared to the enhancement seen with bacteria attached to immunosilver nanospheres. The relative intense bands at 222, 290, and 404 cm−1are generally assigned to the silver–oxygen mode (O–Ag) or to the ionic species
sorbed onto the metal surface. The aggregated silver nanorice combines the plasmonic properties of both nanorods and nanoshells in a single structure which was supposed to lead to large enhancements of the local electromagnetic field at the nanoparticle surface, resulting in a larger surface enhanced Raman scattering [22]. Usually, the enhancement factor G depends on the distance separating the sorbate from the metal surface and on the radius of the metal sphere [30,31]. The weak enhancement factor in the present case could be explained by the extremely small size (5 to 10 nm) of the silver nanoparticles deposited onto the nanorice surface (Fig. 1c). This was particularly so as that the optical and vibrational properties of the metallic nanoparticles depend generally on their size [32]. Silver nanoparticles (10 to 100 nm in diameter) have been reported to give the strongest electromagnetic enhancement [33,34] and the size of the silver nanoparticles used here was in the lower range. The weak enhancement could be also explained by the medium (60%) silver nanoparticle coverage ratio of the nanorice surface. One could reason that if only a smaller portion of the biomolecules (protein-A, antibodies as well as bacteria) was sorbed onto the nanorice (Fe2O3), no enhancement at the selected laser wavelength would be
anticipated. The peaks observed in the spectrum of E. coli after sorption onto the immunosilver nanorice were already present (with different intensity) before bacterial sorption. The following discussion of the SERS spectra would be solely based on the results obtained with bacteria attached onto immunosilver nanospheres.
Figure2a–cshow the overall spectra and the enlargement of their most interesting parts. The assignment of the bands shows contribution from nucleic acids, carbohydrates, proteins, and lipids—all of the major building blocks of cells. The same main peaks have been reported for a single bacterial cell [35,36]. Two major regions could be distinguished, one is between 500 cm−1 and 1,100 cm−1 and the second is between 1,200 cm−1 and
1,700 cm−1. The major components of the bacterium could be distinguished in the obtained
spectrum. The peaks between 600 cm−1 and 800 cm−1 and between 1,500 cm−1 and
1,700 cm−1 could be attributed to nucleic acids (DNA or RNA) inside the bacterium,
indicating the presence of adenine, guanine, cytosine, and thymine (or uracil for RNA) molecules. The peak ∼990 cm−1 indicated the presence of phenylalanine molecules, an
important aromatic amino-acid residue. Peaks around 1,029 cm−1 and 721 cm−1 were
600 1000 1400 1800 2200 2600 0 20 40 60 80 100 120 15 86 13 14 11 02 65 7 61 2 49 3 40 4 29 0 22 2
E. colisorbed onto the immuno-silver nanorice 28 90 200 Raman Shift (cm-1) 600 1000 1400 1800 2200 2600
Raman Intensity (a.u)
0 20 40 60 80 100 120 15 86 13 14 11 02 65 7 61 2 49 3 40 4 29 0 22 2
E. colisorbed onto the immuno-silver nanorice
28
90
200 Fig. 3 Visible (532 nm) SERS
Raman spectrum of the immuno-silver nanorice after bacterial sorption
corresponding to the presence of the carbohydrate compounds. These molecules (mono or polysaccharides), considered as reservoirs of energy in bacteria and as parts of cellular structures, will often serve as building blocks for major structures in the cell, such as the cell wall and the genome. Bands between 1,300 cm−1 and 1,400 cm−1 are generally
assigned to the presence of proteins. These proteins and peptides could be enzymes catalyzing almost all biological reactions in the bacterium or could perform a structural role in the cell—either in the cell wall, the cell membrane, or in the cytoplasm. Each E. coli cell contains ∼1,000 different enzymes at any given time. There may be only a few molecules of an enzyme or thousands of copies. Peaks around 1,462 cm−1 are attributed to the lipid
groups. Membranes have these lipid or fat molecules as their major constituent making them impermeable to molecules that dissolve in water, but water itself can move freely through the cytoplasmic membrane. The intense band at 206–232 cm−1 is generally
assigned to the silver–oxygen mode (O–Ag) or to the ionic species sorbed onto the metal surface.
The detail vibrational spectra (Fig.2c) exhibited peaks at 1,605–1,690 cm−1due to the
deformation vibration of N–H or the stretching vibration in C–N of the amide I groups. The peaks at 1,552 and at 1,525 cm−1could correspond to different organic vibrations between
C, N, and H in amide or other groups. The peaks at 1,485, 1,462, 1,355, and 1,271 cm−1
could be attributed to the NH2stretching in adenine and guanine compounds, to the CH2
scissoring deformation in lipid groups, and to the CH deformation vibrations and to amide III components. Other peaks appeared at 1,056 cm−1 and at 1,235 cm−1 and could
respectively be attributed to the stretching vibration of C–C in alkanes and to the vibration of N–H or the stretching vibration. The details of the assignments and attributions are listed in Table1. The bands match features reported in the literature for samples of larger amounts of bacterial biomass or its molecular components [23,35–52].
The SERS spectra of a single bacterium obtained in the present study were repetitive (as demonstrated by the principal component analysis study discussed below) whereby, under the same conditions, identical spectra were obtained except for four peaks which were less or more intense depending on the position of the beam. These peaks were: (772 and 906 cm−1) and (721 and 1,029 cm−1). The spectra in Fig.4highlighted these differences.
Figure 4a had more intense 772 and 906 cm−1 peaks and very weak or practically
nonexistent 721 and 1,029 cm−1peaks. Figure4bshows the opposite scenario and such a
result could be explained by the position of the beam when the spectra were recorded. Indeed, based on Goodacre et al. [40], the 772 and 906 cm−1peaks are attributed to nucleic
acids (cytidine, uracil) mainly located inside the cell. Maquelin et al. [45] attributed the 721 cm−1 and 1,029 cm−1bands to the carbohydrate groups of the cell wall. Apart from
these four peaks, all the obtained spectra were identical. The control containing the immunosilver nanospheres without the presence of bacteria did not show any of these peaks.
Principal component analysis has been used as a statistical approach for manipulating a data set into a form containing a reduced number of characteristic quantities. Ten SERS spectra were collected from each step of the procedure (silver nanospheres, silver nanospheres with antibodies and protein-A attached and with E. coli), obtained from one series of experiments. The principal component analysis ordination plot (PC-1 vs. PC-2) shows how the variables correlate with each other. Three clearly resolved clusters were distinguishable: silver nanospheres, silver nanospheres with protein-A and antibody, and immunonanospheres with attached E. coli (Fig.5). The cumulative percentage variation of the X variables obtained by the model after the second component was between 92% and 96% for all three cases. Unlike other SERS studies documenting and proving the selective
discrimination of the method [53], the present approach has its selectivity built in based on the use of specific antibodies. The selectivity of the proposed method was assessed by attaching a specific anti-E. coli antibody to the surface of nanoparticles, binding exclusively E. coli. The specificity of the antibodies has been evaluated elsewhere [54]. The antibody chosen for the present study was of a polyclonal origin to increase the likelihood of capturing the desired bacteria. Indeed, while monoclonal antibodies recognize only one specific epitope (chemical structure) on the bacterial cell wall, polyclonal antibodies recognize several types of epitopes of the same bacterial cell wall [55].
Detection Limit
As discussed earlier, the SERS technique used in the present study was used to detect a single bacterium. Consequently, the detection limit does not have the conventional meaning of being the smallest concentration measurable by a particular technique but it has to rather be interpreted as the capacity of the laser to detect a bacterium in a small surface area (maximum of 0.05 cm2). This issue has been facilitated using the combination of Raman and microscopy in the confocal Raman microscope instrument allowing individual bacterial cells to be successfully detected in a matter of minutes. The automated mapping device of the Raman could be of great help since it can scan every spot of the sample. Moreover, the
Table 1 Raman bands observed in the spectra of single bacterial cells and their tentative assignment.
Band or band range (cm−1) Assigned to References
206–232 O–Ag vibrations and ionic species adsorbed onto
Ag nanoparticles
[38]
457 Band observed in the SERS spectra of proteins, peptides,
and amino acids
[39,42]
582 Carbohydrates [35,43]
620 Band observed in the SERS spectra of proteins, peptides,
and amino acids; δ (COO−)
[23,44]
672 Adenine from flavin [51]
772 and 906 Nucleic acids (cytidine, uracil) [40,41,46,47]
945 C–N stretch [51]
990 Phenylalanine (in proteins) [36]
1,029 Carbohydrates, mainly –C–C–(skeletal), C–O, δ (C–O–H) [41,45]
1,056 Alkane C–C stretch [23,46,47]
1,235 N–H, C–NUracil, ν NH2in adenine and guanine [48][23,37]
1,270 Amide III [23,48,50]
Alkane CH2twist and rock modes and C–O–C modes of pyranose rings
1,355 Protein (amide III); δ (CH) [48,50]
1,462 δ(CH2) (lipid groups) [41,50]
1,485 Adenine and guanine amino acids [23]
1,525 N–H, C–H bend, C=C stretch [52]
1,552 C=C (lipid); δ (N–H) and ν (C–N) (amide II) [45,52]
1,593–1,690 Nucleic acids [46,47]
0.16 0.20 0.24 0.28 0.32 0.38 -2.0 -1.5 -1.0 -0.5 0.0 0.5 1.0 1.5 2.0 0.16 0.20 0.24 0.28 0.32 0.38 -2.0 -1.5 -1.0 -0.5 0.0 0.5 1.0 1.5 2.0 Principal component 1 Principal component 2
Fig. 5 Principal component analysis ordination plot of the silver nanospheres obtained SERS (filled triangles) before sorption; (unfilled diamonds) with protein-A molecules + antibodies; and (eight-spoked asterisks) bacteria attached to the immunosilver nanospheres
700 750 800 850 900 950 1000 0 10 20 30 40 50 60 1200 1029 945 90 6 793. 664 77 2 99 0 1027 990 945 72 1 Raman Shift (cm-1) 700 750 800 850 900 950 1000 0 10 20 30 40 50 60
Raman Intensity (a.u)
0 10 20 30 40 50 60 1200 1029 945 90 6 793. 664 77 2 99 0 1027 990 945 72 1 (a) (b)
Fig. 4 Highlighted differences in two obtained visible (532 nm) SERS Raman spectra of the immunosilver nanospheres after bacterial sorption (103cells/mL)
novel approach in the present technique is that the bacterial detection is performed in a dried sample that could be concentrated to the maximum before depositing the 20 µL of bacteria attached to the immunosilver nanoparticles on the glass slide. It means that if x cells/mL were added to the immunosilver nanoparticles, one could expect (if the sample was well concentrated) that x bacteria would be in 20 µL of the dried sample on the glass slide. This could increase greatly the resulting detection limit since the number of bacteria would be concentrated in the sample examined. Note that the number of sorbed bacteria x could not be accurately determined because of sorption/desorption equilibrium between the bacteria and the immunosilver nanoparticles as well as the growth of E. coli during the experiment. Indeed, there is an affinity constant between the epitopes of the surface of the bacteria and the antibody binding sites. This affinity constant could be calculated by following the concentration of bacteria before and after sorption. However, the value of this constant could not be determined because of the relative growth of E. coli. Regardless of the affinity constant value and due to thermodynamic equilibrium, the quantity of bacteria sorbed will be lower than the initial value just before the sorption.
In the present study, decreasing initial concentrations of E. coli were used to establish the detection limit. The initial criteria followed were the speed and the accuracy of the detection. While it was easy and fast to detect a bacterium at 108cells/mL, the detection became practically not feasible at 102cells/mL since it took more than 1 h to spot one bacterium under the laser beam. The detection limit of the proposed technique was established at 103cells/mL, whereby the detection was fast enough, without the mapping
device, (less than 1 min) and accurate (Fig.6). Figure6shows the presence of bacteria at 103cells/mL as seen through the Raman microscope. It was easy to locate single cells with confocal Raman microscopy yielding a good spectrum quality.
When compared to other rapid bacterial detection technique, the present one offers fast and accurate detection with a low detection limit. Indeed, Tang et al. [12] studied an amperometric technique for rapid detection of E. coli density using a bi-enzyme biosensor. The amplified response current of the biosensor is linear with the E. coli density ranging
Activated
silver nanoparticles
E. coli
E. coli
Fig. 6 Image obtained usingthe Raman microscope when analyzing 103cells/mL of bacteria sorbed onto immunosilver nanospheres
from 1.6×10³to 1.0×10⁷cells/mL. The bi-enzyme biosensor could detect 9.7×10²cells/mL of E. coli within 3 h. Yang et al. [13] developed an impedance immunosensor method for rapid detection of E. coli by immobilizing anti-E. coli antibodies onto an indium tin oxide interdigitated array microelectrode. The electron-transfer resistance was proportional to the concentration of E. coli cells in the range from 4.36×10⁵ to 4.36×10⁸cells/mL with the
detection limit of 105cells/mL. Gunasekera et al. [14] applied flow cytometry to microbial analysis based on an enzymatic clearing of milk to determine total bacteria in milk. The detection limit of that assay was less than 104cells/mL of milk. Using semiconductor quantum dots as fluorescence labels in immunoassays, Yang et al. [15] reported a detection limit of 104cells/mL with an analysis time of 2 h. Goodridge et al. [56] reported the
fluorescent bacteriophage assay for the detection of E. coli, achieving detection limits of 104cells/mL within 8 h. Ochoa et al. [57] developed an immunomagnetic separation biosensor for the detection of E. coli, which had a detection limit of 2.0×10⁶cells/mL. Boyaci et al. [58] reported electrochemical biosensors for the detection with a limit of 2.0× 10⁶cells/mL. It appears that the detection limit of the present technique has an advantage over some immunoassays, optical, and electrochemical methods.
A number of PCR-based methods have been used for detection of pathogenic bacteria. For example, Bhagwat [59] reported a real-time PCR method that could detect E. coli and
Fig. 7 Expression of the specific gene (GFP) in the E. coli. Lane 1 Escherichia coli strain with GFP gene; lane 2 E. coli strain with GFP gene sorbed onto activated immunosilver nanospheres; lane 3 negative control, Escherichia coli strain O157:H7 EDL933; lane 4 negative control, E. coli without the GFP gene after reac-tion with the activated immuno-silver nanospheres; lane 5 PCR negative control without DNA
Salmonella typhimurium to the predicted level of 1 to 10 cells/mL and Listeria monocytogenes at 103cells/mL. However, these methods are intrinsically much slower because of multiple reaction and purification steps and a long pre-enrichment step (16– 48 h) to achieve low detection limits. PCR-based methods would be used in the present paper as a complementary positive sample confirmation.
Application to Milk and Apple Juice
The same detection limit of 103cells/mL was achieved when applying the present technique to artificially E. coli (with the GFP gene) contaminated milk and apple juice. Note that while it was easy and fast to detect a bacterium at 103cells/mL in buffer using the Raman confocal microscope, the detection was harder at this level in milk or apple juice. It took more than 20 min to spot one bacterium under the laser beam. This bacterial detection limit in raw milk and juice is below the level of detection required to satisfy legislation in many countries and states [60]. However, for the validation of this technique, two complementary issues have been addressed. The first one is the proof that E. coli is the bacterial species detected by Raman and the second one is the extent of the damage to the detected cells caused by the treatment preceding the Raman detection because of the antibacterial property of silver nanoparticles [61]. Indeed, the activation and detection experiments have been conducted in a non-controlled environment. Bacterial contamination could occur during the sample handling and other bacterial species could physisorb on the surface of the silver nanoparticles and be detected by Raman. During the procedure, the bacteria could also be degraded and lyse before the Raman detection. These two issues have been addressed by re-cultivating the bacteria attached to activated silver nanospheres after Raman detection and identifying the grown colonies by the PCR. Positive and negative controls were always used. After re-cultivation, microscope observations indicated that the growing bacteria on the Petri dish have a rod shape. In the Gram stain test, all the colonies grown on the Petri dish were Gram negative. These preliminary tests pointed out that the bacteria detected were E. coli. The growth of E. coli (established by the PCR) on the Petri dish indicated that the bacteria were actively growing before and after the Raman detection. It is a good indication that the silver nanoparticles exhibited little antibacterial effect in the present case.
The nature of the bacterial species (recultivated and isolated) has been identified after the detection using the PCR technique to ascertain the detected bacterial species. Lane 2 of Fig. 7, representing the sample from the modified E. coli immuno-captured by the silver nanospheres, indicates the presence of the GFP gene. The band in Lane 2 is on the same level as the amplified band in Lane 1 corresponding to the positive control containing exclusively E. coli with the GFP gene. Different positive and negative controls were performed to ascertain the reliability of the results. The obtained results using PCR shown in Fig. 7 indicated that E. coli with the GFP gene expressed is the species as actually detected by Raman.
Acknowledgments The authors thank Denis Bourque for providing the E. coli with the GFP gene.
References
1. Stewart, C. M., Cole, M. B., & Schaffner, D. W. (2003). Journal of Food Protection, 66, 1310–1325. 2. Thevenot, D., Dernburg, A., & Vernozy-Rozand, C. (2006). Journal of Applied Microbiology, 101, 7–17.
3. Zeng, H. Y., Zhang, X. F., Sun, Z., & Fang, W. H. (2006). Journal of the Science of Food and Agriculture, 86, 367–371.
4. Bardsley, D. A. (1938). Journal of Hygiene, 38, 309–324. 5. Batty-Smith, C. G. (1942). Journal of Hygiene, 42, 55–98.
6. Liu, R. H., Yang, J. N., Lenigk, R., Bonanno, J., & Grodzinski, P. (2004). Analytical Chemistry, 76, 1824–1831.
7. Bakir, M. A., Kitahara, M., Sakamoto, M., Matsumoto, M., & Benno, Y. (2006). International Journal of Systematic and Evolutionary Microbiology, 56, 931–993.
8. Hartley, H. A., & Baeumner, A. J. (2003). Analytical and Bioanalytical Chemistry, 376, 319–327. 9. Edwards, K. A., Clancy, H. A., & Baeumner, A. J. (2006). Analytical and Bioanalytical Chemistry, 384,
73–84.
10. Vanne, L., Karwoski, M., Karppinen, S., & Sjoberg, A. M. (1996). Food Control, 7, 263–276. 11. Mathew, F. P., Alagesan, D., & Alocilja, E. C. (2004). Luminescence, 19, 193–198.
12. Tang, H., Zhang, W., Geng, P., Wang, Q. J., Jin, L. T., Wu, Z. R., et al. (2006). Analytica Chimica Acta, 562, 190–196.
13. Yang, L. J., Li, Y. B., & Erf, G. F. (2004). Analytical Chemistry, 76, 1107–1113.
14. Gunasekera, T. S., Attfield, P. V., & Veal, D. A. (2000). Applied and Environmental Microbiology, 66, 1228–1232.
15. Yang, L. J., & Li, Y. B. (2006). Analyst, 131, 394–401.
16. Hanlon, E. B., Manoharan, R., Koo, T. W., Shafer, K. E., Motz, J. T., Fitzmaurice, M., et al. (2000). Physics in Medicine and Biology, 45, R1–R59.
17. Williams, A. C., & Edwards, H. G. M. (1994). Journal of Raman Spectroscopy, 25, 673–677. 18. Kerker, M., Siiman, O., Bumm, L. A., & Wang, D. S. (1980). Applied Optics, 19, 3253–3255. 19. Ryder, A. G. (2005). Current Opinion in Chemical Biology, 9, 489–493.
20. Fleischmann, M., Hendra, P. J., & McQuilla, A. (1974). Chemical Physics Letters, 26, 163–166. 21. Podstawka, E., Ozaki, Y., & Proniewicz, L. M. (2004). Applied Spectroscopy, 58, 1147–1156. 22. Wang, H., Brandl, D. W., Le, F., Nordlander, P., & Halas, N. J. (2006). Nano Letters, 6, 827–832. 23. Efrima, S., & Bronk, B. V. (1998). Journal of Physical Chemistry B, 102, 5947–5950.
24. Zeiri, L., Bronk, B. V., Shabtai, Y., Czege, J., & Efrima, S. (2002). Colloids and Surfaces A— Physicochemical and Engineering Aspects, 208, 357–362.
25. Sanda, P. N., Warlaumont, J. M., Demuth, J. E., Tsang, J. C., Christmann, K., & Bradley, J. A. (1980). Physical Review Letters, 45, 1519–1523.
26. Weitz, D. A., Garoff, S., Gersten, J. I., & Nitzan, A. (1983). Journal of Chemical Physics, 78, 5324– 5338.
27. Chew, H., Wang, D. S., & Kerker, M. (1984). Journal of Optical Society of America, 1, 56–66. 28. Nie, S. M., & Emory, S. R. (1997). Abstracts of Papers of the American Chemical Society, 213,
177-PHYS.
29. Olson, L. G., Uibel, R. H., & Harris, J. M. (2004). Applied Spectroscopy, 58, 1394–1400.
30. Hicks, C. J. (2001). SERS, Surface enhanced Raman spectroscopy (p. 9). MI: Michigan State University Chemical Department.
31. Rivas, L., Sanchez-Cortes, S., Garcia-Ramos, J. V., & Morcillo, G. (2001). Langmuir, 17, 574–577. 32. Kerker, M. (1980). Abstracts of Papers of the American Chemical Society, 180, 159-COLL. 33. Blatchford, C. G., Campbell, J. R., & Creighton, J. A. (1982). Surface Science, 120, 435–455. 34. Lee, Y. H., Dai, S., & Young, J. P. (1997). Journal of Raman Spectroscopy, 28, 635–639. 35. Schuster, K. C., Urlaub, E., & Gapes, J. R. (2000). Journal of Microbiological Methods, 42, 29–38. 36. Huang, W. E., Griffiths, R. I., Thompson, I. P., Bailey, M. J., & Whiteley, A. S. (2004). Analytical
Chemistry, 76, 4452–4458.
37. Britton, K. A., Dalterio, R. A., Nelson, W. H., Britt, D., & Sperry, J. F. (1988). Applied Spectroscopy, 42, 782–788.
38. Canamares, M. V., Garcia-Ramos, J. V., Gomez-Varga, J. D., Domingo, C., & Sanchez-Cortes, S. (2005). Langmuir, 21, 8546–8553.
39. Chumanov, G. D., Efremov, R. G., & Nabiev, I. R. (1990). Journal of Raman Spectroscopy, 21, 43–48. 40. Goodacre, R., Timmins, E. M., Burton, R., Kaderbhai, N., Woodward, A. M., Kell, D. B., et al. (1998).
Microbiology-(UK), 144, 1157–1170.
41. Goral, J., & Zichy, V. (1990). Spectrochimica Acta Part A—Molecular and Biomolecular Spectroscopy, 46, 253–275.
42. Grabbe, E. S., & Buck, R. P. (1989). Journal of the American Chemical Society, 111, 8362–8366. 43. Keir, R., Sadler, D., & Smith, W. E. (2002). Applied Spectroscopy, 56, 551–559.
44. Laucks, M. L., Sengupta, A., Junge, K., Davis, E. J., & Swanson, B. D. (2005). Applied Spectroscopy, 59, 1222–1228.
45. Maquelin, K., Choo-Smith, L. P., van Vreeswijk, T., Endtz, H. P., Smith, B., Bennett, R., et al. (2000). Analytical Chemistry, 72, 12–19.
46. Maquelin, K., Kirschner, C., Choo-Smith, L. P., van den Braak, N., Endtz, H. P., Naumann, D., et al. (2002). Journal of Microbiological Methods, 51, 255–271.
47. Naumann, D. (2001). Applied Spectroscopy Reviews, 36, 239–298.
48. Schuster, K. C., Reese, I., Urlaub, E., Gapes, J. R., & Lendl, B. (2000). Analytical Chemistry, 72, 5529– 5534.
49. Sengupta, A., Mujacic, M., & Davis, E. J. (2006). Analytical and Bioanalytical Chemistry, 386, 1379– 1386.
50. Venkatakrishna, K., Kurien, J., Pai, K. M., Valiathan, M., Kumar, N. N., Krishna, C. M., et al. (2001). Current Science, 80, 665–669.
51. Zhao, H. Y., Yuan, B., & Don, X. M. (2004). Journal of Optics A—Pure and Applied Optics, 6, 900–905. 52. Zheng, Y. G., Carey, P. R., & Palfey, B. A. (2004). Journal of Raman Spectroscopy, 35, 521–524. 53. Jarvis, R. M., & Goodacre, R. (2004). Analytical Chemistry, 76, 40–47.
54. Shapira, R., Paster, N., Menasherov, M., Eyal, O., Mett, A., Meiron, T., et al. (1997). Applied and Environmental Microbiology, 63, 990–995.
55. Nelson, D. L., & Cox, M. M. (2000). Lehninger Principles of Biochemistry (3rd ed., p. 1152). New York: Worth.
56. Goodridge, L., Chen, J. R., & Griffiths, M. (1999). Applied and Environmental Microbiology, 65, 1397– 1404.
57. Ochoa, M. L., & Harrington, P. B. (2005). Analytical Chemistry, 77, 5258–5267.
58. Boyaci, I. H., Aguilar, Z. P., Hossain, M., Halsall, H. B., Seliskar, C. J., & Heineman, W. R. (2005). Analytical and Bioanalytical Chemistry, 382, 1234–1241.
59. Bhagwat, A. A. (2003). International Journal of Food Microbiology, 84, 217–224. 60. Hubble, I. B. (1997). Australian Journal of Dairy Technology, 52, 102–108. 61. Lee, D., Cohen, R. E., & Rubner, M. F. (2005). Langmuir, 21, 9651–9659.