Publisher’s version / Version de l'éditeur:
Polymer, 46, 11, pp. 3838-3846, 2005-04-07
READ THESE TERMS AND CONDITIONS CAREFULLY BEFORE USING THIS WEBSITE. https://nrc-publications.canada.ca/eng/copyright
Vous avez des questions? Nous pouvons vous aider. Pour communiquer directement avec un auteur, consultez la première page de la revue dans laquelle son article a été publié afin de trouver ses coordonnées. Si vous n’arrivez pas à les repérer, communiquez avec nous à PublicationsArchive-ArchivesPublications@nrc-cnrc.gc.ca.
Questions? Contact the NRC Publications Archive team at
PublicationsArchive-ArchivesPublications@nrc-cnrc.gc.ca. If you wish to email the authors directly, please see the first page of the publication for their contact information.
NRC Publications Archive
Archives des publications du CNRC
This publication could be one of several versions: author’s original, accepted manuscript or the publisher’s version. / La version de cette publication peut être l’une des suivantes : la version prépublication de l’auteur, la version acceptée du manuscrit ou la version de l’éditeur.
For the publisher’s version, please access the DOI link below./ Pour consulter la version de l’éditeur, utilisez le lien DOI ci-dessous.
https://doi.org/10.1016/j.polymer.2005.03.002
Access and use of this website and the material on it are subject to the Terms and Conditions set forth at
Biaxial orientation in HDPE films : Comparison of infrared
spectroscopy, X-ray pole figures and birefringence techniques
Ajji, A.; Zhang, X.; Elkoun, S.
https://publications-cnrc.canada.ca/fra/droits
L’accès à ce site Web et l’utilisation de son contenu sont assujettis aux conditions présentées dans le site
LISEZ CES CONDITIONS ATTENTIVEMENT AVANT D’UTILISER CE SITE WEB.
NRC Publications Record / Notice d'Archives des publications de CNRC:
https://nrc-publications.canada.ca/eng/view/object/?id=69f71c10-2c0b-4867-ae6f-ad8181b0bbc3 https://publications-cnrc.canada.ca/fra/voir/objet/?id=69f71c10-2c0b-4867-ae6f-ad8181b0bbc3
Biaxial orientation in HDPE films: comparison of infrared spectroscopy,
X-ray pole figures and birefringence techniques
A. Ajji*, X. Zhang, S. Elkoun
Advanced Materials Design, Industrial Materials Institute, NRC, 75 Boul. de Mortagne, Boucherville, Que., Canada, J4B 6Y4
Received 15 December 2004; received in revised form 22 February 2005; accepted 28 February 2005 Available online 7 April 2005
Abstract
In this study, high-density polyethylene films (HDPE) were produced using different processes (film blowing and biaxial orientation) and processing conditions. The orientation of the films was characterized in terms of their biaxial crystalline, amorphous and global orientation factors using birefringence, Fourier transform infrared spectroscopy (FTIR) using a tilted incidence technique and X-ray pole figures. Evaluation of a simplified FTIR procedure without using the tilted method for the determination of crystalline orientation factors proposed in the literature is also evaluated and assessed. The results indicate that FTIR overestimate the crystalline orientation factors, particularly for the crystalline a-axis. Significant discrepancies are also observed for the b-axis orientation, which may be due to an overlap of the amorphous contribution and/or saturation of FTIR bands. Those differences are larger for films with low orientation, such as blown films. Amorphous phase orientation from FTIR depends on the band used and is not necessarily in agreement with that determined from combination of X-ray and birefringence.
Crown Copyright q 2005 Published by Elsevier Ltd. All rights reserved.
Keywords:HDPE crystalline and amorphous phases orientation; FTIR spectroscopy; X-ray diffraction pole figures
1. Introduction
The production of oriented films from thermoplastic materials represents a large segment of the polymer industry. In fact, orientation of polymers enhances many
of their properties [1–5], particularly mechanical, impact,
barrier and optical. Biaxial orientation has the added advantage of allowing this enhancement in both directions. One of the commonly used polymers in biaxial orientation processes is polyethylene (PE). The most widely used biaxial orientation processes for films are the standard film blowing process (such as for PE), tubular film blowing (such as for PP and LLDPE) and cast film biaxial orientation or tentering (PP, PS, PET, etc.).
On the other hand, the structure and orientation developed during these processes have a significant effect on the properties of the films. Different techniques can be used to determine the structure and orientation of the films.
Microscopy gives an overall picture of the crystalline morphology (lamellar, spherulitic, etc.), X-ray pole figures yields details of crystalline phase orientation. Fourier transform infrared spectroscopy (FTIR) allows the determi-nation of specific orientation factors for the crystalline and amorphous phases as well as that of trans and gauche
conformers and combinations [6], provided that their
transition moment angle are known. Finally, birefringence gives the average total orientation. For the particular case of PE, FTIR allows the determination of crystalline axes orientation as well. However, the accuracy and precise significance of the different orientation factors determined from these techniques is to be established, although some studies in the past addressed partially this issue as well as
their correlations to structure and properties[7–16].
In fact, it was in the fifties [7–9] that Stein treated the
comparison of results from FTIR, X-ray diffraction and birefringence theoretically, with a comparison with a simple
hypothetical case[7]. It was until the end of the sixties that
Read and Stein [10]made some quantitative comparisons
for the case of uniaxial orientation, however, the X-ray www.elsevier.com/locate/polymer
0032-3861/$ - see front matter Crown Copyright q 2005 Published by Elsevier Ltd. All rights reserved. doi:10.1016/j.polymer.2005.03.002
* Corresponding author. Tel.: C1 450 641 5244; fax: C1 450 641 5105.
results were not made in the same laboratory. Even with this fact, already significant discrepancies were observed between the FTIR results for the crystalline a-axis and those obtained from X-ray at low orientation levels. Some of the observed discrepancies were attributed to potential
differences in films and experimental errors. Desper[11]on
the other hand studied PE blown films using also X-ray, birefringence and FTIR spectroscopy. However, in his FTIR measurements, he did not use the tilted technique and hence, had not the contribution coming from the thickness direction to compare properly the orientation factors.
More recently, Kissin[17]developed an approach for the
use of FTIR for the determination of biaxial orientation factors for HDPE blown films having a specific structure (row structure) using two FTIR spectra, without the need for
tilting the films in order to determine the third spectrum[6].
He compared the results of this approach with WAXD results of a biaxially oriented HDPE films with a row structure and found an acceptable agreement based on White–Spruiell biaxial orientation factors. However, when Herman’s orientation factors are used to determine the orientation factors, significant differences can be noted between results from FTIR and X-ray diffraction, which may be due to a compensation between the two independent angles that are involved in the White–Spruiell factors.
Krishnaswamy[18]modified slightly Kissin’s approach and
extended it to LLDPE blown films but did not report systematic comparisons with the FTIR tilted technique nor with WAXD results.
In order to clarify the discrepancies observed above in literature and also following our observations from comparing FTIR and X-ray results on orientation factors in blown films, we carried out an extensive and systematic study on different polyethylenes having different mor-phologies and histories. Uniaxially oriented, biaxially oriented and blown films of HDPE, LLDPE and LDPE were characterized using X-ray pole figures, FTIR and birefringence. The results obtained for Herman’s biaxial orientation factors from the different techniques are compared and discussed. A comparison is also made with the approaches of Kissin and Krishnaswamy mentioned above. This first paper addresses the case of HDPE.
2. Experimental
For blown films, high-density polyethylene (HDPE) film resin, with a melt index of 0.34 and density of 0.955, was used. The films were produced using an extrusion blowing line from Brampton engineering. The extrusion temperature profile ranged from 160 to 200 8C. Different draw down ratios (DDR) and blow up ratios (BUR) were used with thicknesses from 12 to 50 mm. The frost line height was about 70 cm.
Initial samples for biaxial stretching were prepared by cast film extrusion of the same HDPE as above for blown
films. The initial thickness was in the range of 0.5–1 mm. The stretching was performed on a Bruckner laboratory biaxial stretcher. The conditions were as follow: stretch rate
10%/s simultaneous, initial sample size 10!10 cm2and a
stretching temperature of 127 8C. Final draw ratios were: uniaxially stretched to a draw ratio of 4 and biaxially stretched to 4!4.
The morphology of the films was determined using a field emission scanning electron microscope (FE-SEM) with and without etching the films and a minimal coating on the surface.
The global biaxial orientation factors were determined using birefringence. The absolute values of birefringence in the machine-normal and transverse-normal planes were measured by an incident multi-wavelength double beam and photodiode array assembly, combined with an in-house developed software. Details of the technique can be found
elsewhere[19,20].
The biaxial orientation factors used in this study are those
of Hermans: fjM, fjTand fjNin the machine, transverse and
normal directions, respectively, for the axis j. Relation can be developed between these orientation functions and other measurable quantities such as birefringence. Assuming D8
ZncKðnaCnbÞ=2 (about 0.058 for PE) and d8ZnaKnb,
(about K0.003 for PE) where na, nband ncare the refractive
indices along the a, b and c axes of the crystalline lattice, the following equations for the crystalline phase can be
obtained[6]:
ðDnMNÞCZ 2D8ðfcMKfcNÞ=3 C d8ðfaMKfaNKfbMCfbNÞ=3
ðDnTNÞCZ 2D8ðfcTKfcNÞ=3 C d8ðfaTKfaNKfbTCfbNÞ=3
The total birefringence is due to the crystalline and amorphous phases in addition to a form birefringence (which is generally negligible), if f is the crystalline content, thus, we can write:
DnMNZ fðDnMNÞCCð1 K fÞðDnMNÞACDnform
The indices A and C stand here for amorphous and crystalline phases. It is then possible to determine the crystalline phase birefringence from crystalline axes orientation, and amorphous phase birefringence by subtrac-tion of the crystalline contribusubtrac-tion from the total birefrin-gence by using the above-mentioned equations.
In general, the contribution of the a and b axes orientation to the crystalline birefringence is low compared to that of the c-axis because of the intrinsic birefringences and it was assumed negligible for the calculations here. Which will lead to the following simplified equations:
ðDnMNÞCZ 2D8ð2fcMCfcTÞ=3
The crystalline axes orientation factors were determined from wide-angle X-ray diffraction pole figures of (110) and (200) reflections using a Bruker AXS X-rays goniometer equipped with a Hi-STAR two-dimensional area detector.
The generator was set up at 40 kV and 40 mA and the cu Ka
radiation (lZ1.542 A˚) was selected using a graphite crystal monochromator. Sample to detector distance was fixed at 8 cm. Film samples were stacked to a thickness of about 3 mm in order to obtain enough accuracy in a reasonable time. They were also determined, in addition to those of the amorphous phase, from Fourier transform infrared spec-troscopy (FTIR) using the tilted film technique to obtain the spectrum of the normal (film thickness) direction. The measurements were carried out on a Nicolet 170SX FTIR at
a resolution of 2 cmK1with an accumulation of 128 scans.
Polarization of the beam was performed using a zinc selenide wire grid polarizer from Spectra-Tech. The details
on this method were reported elsewhere[6,19].
3. Results
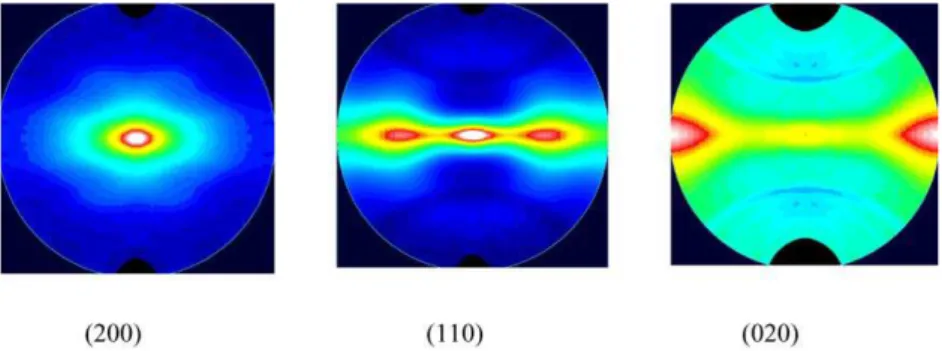
Typical results from X-ray pole figures are shown in
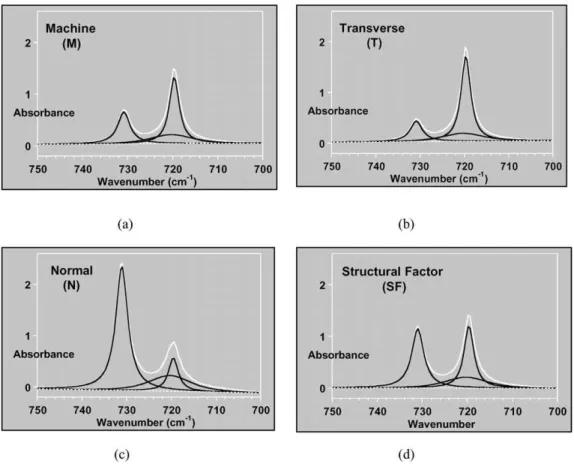
Figs. 1 and 2 or blown and biaxially stretched films, respectively. For the blown films, only the (110) and (200) reflections are reported. In fact, evaluation of the crystalline orientation functions using the (020) reflection are not accurate as will be discussed later for biaxially stretched film. For FTIR, typical results in the spectral region of 700–
750 cmK1are presented onFig. 3for a biaxially oriented
film, with the results of the decomposition procedure. Typical films morphologies obtained from SEM are
illustrated on Figs. 4 and 5 for both blown and biaxially
stretched films. It is clear that a lamellar row nucleated
structure has been obtained in all blown films. The quantitative results obtained on the Herman’s orientation factors of the crystalline axes as well as the amorphous
phase and birefringences are summarized inTables 1–5for
blown and biaxially stretched films and are discussed in details below.
Lets compare first the crystalline axes orientation determined from FTIR and X-ray pole figures for three blown films of different thicknesses (50, 25 and 12 mm),
presented in Table 1. They all agree qualitatively, but in
quantitative terms, significant differences are observed. In fact, for the crystalline a-axis, the values of the orientation factors in the machine direction (MD) from both techniques confirm that it is oriented towards MD direction for all the films, with much higher values from FTIR, particularly from
the 730 and 1471 cmK1 vibrations. The 1894 cmK1
vibration seems to agree with X-ray results. Read and
Stein [10] already reported such differences between the
730 cmK1and X-ray results for low levels of orientation of
uniaxially stretched films long time ago. They attributed it
to potential overlap with the 720 cmK1 band and also to
possible uncertainties of X-ray results as a result of thinner films. We do agree with the first argument as is shown in
Fig. 3, potential overlap with the amorphous phase band is quite possible, particularly if the peaks are not strong, but also to possible saturation for thick films (absorption higher that 1.7–2 in the FTIR spectrum, note that the spectrum of
Fig. 3is for a biaxially oriented film not a blown film, the latter has a stronger peak for a-axis in MD), which may be the case for the MD spectrum of the 50 mm thick film. For the second argument about X-ray results accuracy on thin films, our results were obtained on stacked films with a total thickness of about 3 mm and this error is, we believe, minimal. The argument about peak saturation is in our opinion the most likely for the 50 mm film, and the other argument about potential overlapping of the peaks is valid for all the films. A look on the results on the thinner films shows clearly much smaller differences between FTIR and
X-ray results. The 730 and 1471 cmK1bands being of about
the same intensities[11], but the 1894 cmK1is weaker also
explains the better agreement of the latter with the X-ray results.
For the TD orientation factors of the a-axis, the peak due
Fig. 1. (200) and (110) crystalline reflections pole figures of HDPE blown films (50 mm films).
to the a-axis is weaker than in MD, the values are generally low and the differences with those obtained from X-ray are less important, although still FTIR overestimate the orientation. This is most probably due to the overlap of this peak with the amorphous one and partially with the one
of the a-axis. The results from the 720 and 1464 cmK1
bands are quite different in this case for the 50 microns film probably because of a larger overlap.
For the b-axis, the values obtained for the orientation factors indicate a preferential orientation in the TD-ND plane for all the films, except for the 50 mm film for which FTIR results suggest an orientation along the TD axis only,
in disagreement with X-ray results, as can be seen inTable
1. This latter fact may be due to a possible saturation of
b-axis band in the TD spectrum. The other discrepancies between the FTIR and X-ray results, particularly for the thinner films, although smaller, may be attributed to the overlap between the amorphous phase and/or a-axis peaks. Now that we know the orientation factors of the crystalline axes for the blown films, some additional analysis is possible in combination with birefringence. The results of measured total birefringence and the one calculated from the crystalline axes orientation factors (using an intrinsic birefringence in the c-axis of 0.058) are
shown in Table 2 for two blown films. The calculated
contribution of the crystalline phase to the total birefrin-gence is also presented (by using the crystallinity results) in
Table 2. It is clear from the results that the ones calculated from FTIR orientation factors of the thick film are not acceptable (highly negative birefringences in MD and TD suggest c-axis in the normal directions, which is not observed from X-ray results and morphology consider-ations). This is an additional support of the possible saturation of the peaks in that case. Those obtained for the thinner film or from X-ray results seem reasonable. These results can be used to calculate the amorphous phase orientation and compare the result to the one that can be obtained from various FTIR bands associated with the
amorphous phase[10,11]. Those comparisons are presented
in Table 3, in addition to global orientation from
birefringence and the FTIR 2016 cmK1 band [10]. As
already stated above, the FTIR results for the crystalline factors of the thick film are not reasonable and their combination with birefringence did again confirm it (orientation factors higher than 1 or lower than K0.5).
FTIR bands at 719 cmK1 is associated with CH2 rocking
mode of amorphous trans sequences of four or more
sequences, 1303 cmK1 to CH2 wagging of GTG
confor-mations which is antisymmetrical with respect to the center
of the trans bond, 1352 to CH2wagging mode of amorphous
Fig. 3. Typical FTIR spectra and decomposition results in the spectral region of 700–750 cmK1of biaxially stretched HDPE film. (a) Machine direction
polarization, (b) transverse direction polarization, (c) normal direction spectrum calculated from the tilted technique method and (d) structural factor spectrum (or unoriented film spectrum).
segm ents in the gauche confo rmations (G G) and 1368 lar to 1303 but sym metrica l with resp ect to the cent er of tran s b o n d . T h e 201 6 b and is rep orted for bo th talline and amo rphous phase s, but with a contri bution exte nd ed tra ns seq uence s, thus , o vere stim ate the l ori entation since it does not contain the gauche ribution, gener ally lower than the trans one. Th is can be sil y se en in co mp ar in g th e g lo b al o rie n tat io n fr o m ingence and the 2 016 cm K 1 band in Table 3 . The rphous orientation factor s from the 719 cm K 1 band are 4. FE-SEM micrograph s of HDPE blown films and a film drawn to 4 ! 5. SEM micrograph s of the HDPE blown films used for the evaluation the simplified FTIR approach. Table 1
Crystalline orientation factors determined from the different techniques for a blown HDPE film, DDRZ12 and BURZ2
Film DDR Technique MD orientation factors TD orientation factors ND orientation factors
a-axis b-axis c-axis a-axis b-axis c-axis a-axis b-axis c-axis DDR 12, BUR 2, 50 mm FTIR (720– 730 cmK1) 0.341 K0.208 K0.133 K0.043 0.400 K0.357 K0.298 K0.192 0.490 (1464– 1471 cmK1) 0.563 K0.250 K0.313 0.154 0.361 K0.515 K0.716 K0.111 0.827 a-axis from 1894 cmK1 0.082 0.110 K0.192 X-ray 0.096 K0.209 0.113 K0.011 0.095 K0.084 K0.085 0.130 K0.045 DDR 23, BUR 1.6, 25 mm FTIR (720– 730 cmK1) 0.257 K0.458 0.201 K0.201 0.283 K0.082 K0.056 0.175 K0.119 X-ray 0.232 K0.334 0.102 K0.145 0.246 K0.101 K0.087 0.102 K0.015 DDR 4.5, BUR 1.1, 12 mm FTIR (720– 730 cmK1) 0.166 K0.470 0.304 K0.141 0.386 K0.245 K0.026 0.084 K0.059 X-ray 0.066 K0.357 0.292 K0.097 0.309 K0.212 0.031 0.063 K0.094 X-ray results were background and absorption corrected, b-axis calculated from (200) and (110) and c-axis calculated from a-axis and b-axis.
A. Ajji et al. / Polymer 46 (2005) 3838–38 46
Table 2
Measured total birefringence, calculated crystalline birefringence from FTIR and XRD and crystalline contribution to the total birefringence for two selected blown films Film and crystallinity
(%)
Measured total MD birefringence
Measured total TD birefringence
From Calculated crystalline MD birefringence Calculated crystalline contribution to total MD birefringence Calculated crystalline TD birefringence Calculated crystalline contribution to total TD birefringence DDR 12, BUR 2, 50 mm 2.3 1.1 FTIR (720–730 cmK1) K24.7 K17.3 K32.4 K22.7 70% FTIR (1464–1471 cmK1 ) K44.7 K31.3 K52.3 K36.6 XRD 5.6 3.9 K1.8 K1.3 DDR 4.5, BUR 1.1, 12 mm 18 8 FTIR (720–730 cmK1 ) 13.3 9.1 K6.8 K4.7 68.7% XRD 14.5 10.0 K4.2 K2.9
XRD indicate X-ray diffraction.
Table 3
Amorphous and global orientation factors determined from the different techniques for two selected blown films Film sample and
its crystallinity
Global orientation factors from birefringence and FTIR 2016 cmK1, respectively
Amorphous orientation factors from FTIR 722, 1303, 1352, 1368 cmK1, respectively
Amorphous orientation factors from FTIR or X-ray and birefringence fM fT fN fM fT fN fM fT fN DDR 12, BUR 2, 50 mm 0.030 K0.001 K0.029 K0.441 0.178 0.273 0.410 0.830 K1.24a Crystallinity 70% 0.147 0.075 K0.222 K0.264 0.359 K0.095 0.830 1.198 K2.028b 0.096 0.106 K0.202 K0.164 0.193 K0.029c 0.100 0.094 K0.194 DDR 4.5, BUR 1. 1, 12 mm 0.241 K0.017 K0.224 K0.068 K0.291 0.359 0.103 0.483 K0.586a Crystallinity 68. 7% 0.129 0.411 K0.540c
a Calculated from FTIR (730–719 cmK1region,Table 1) and birefringence. b Calculated from FTIR (1471–1464 cmK1region,Table 1).
c Calculated from X-ray results inTable 1and birefringence. Only c-axis crystalline orientation was taken into account to calculate amorphous orientation.
A. Ajji et al. / Polymer 46 (2005) 3838–38 46 3843
though to be greatly affected by the decomposition procedure and saturation for the 50 mm film. The 1352 and 1368 bands indicate about the same result for the amorphous, which has been reported also by Read and Stein
[10], but different from the one calculated from X-ray and
birefringence. The 1303 cmK1band shows the same trend
as the calculated values but different in magnitude. Literature results showed, however, that the orientation of
this band is the lowest among all the others[10,11]. For the
thinner film, the calculated amorphous orientation using FTIR or X-ray results in combination with birefringence are comparable, but different from the ones determined from
amorphous 719 cmK1 band, which also highlights the
difficulties in decomposition of the bands because of overlapping.
For uniaxially and biaxially oriented films, the results obtained for the different crystalline orientation factors are
presented on Table 4. Generally, the (020) reflection
intensity is weak and for the two films above, the X-ray results were determined using two procedures: (1) a-axis from (200), b-axis from (020) and c-axis from the two; or (2)
a-axis from (200), b-axis from the combination of (110) and
(200) and c-axis from the two. Significant differences can be observed in the table between the two results. A look at the
results presented onTable 5for calculated amorphous phase
orientation from the combination of X-ray results and birefringence indicate that most likely, the results from the first procedure (XR1 in the table) are unreasonable (higher than 1 or below K0.5). It is concluded that the results obtained from the second procedure are more accurate and reliable (this was the procedure used for the blown films above). Now if we compare the FTIR results with those of X-ray for the crystalline axes orientation, particularly the 4!4 film sample, some agreement can be seen, the main difference is in the a-axis orientation in the TD direction, which is probably due to overlapping and lower intensity for this peak. For the uniaxial film, it was too thick to be
analyzed using the 720–730 cmK1region and only the
a-axis orientation from the 1894 cmK1band was obtained and
agreed relatively with the X-ray results.
The crystalline a-axis orientation is basically in the TD-ND plane for the uniaxially oriented film and in the TD-ND direction for the biaxially oriented one. The b-axis is in the TD-ND plane in both cases. For the c-axis, both techniques indicate it is located in the MD-TD plane, which is expected.
The results obtained for the measured total birefringence, FTIR measured amorphous orientation, calculated amor-phous phase orientation results (from combination of
birefringence or 2016 cmK1global orientation with
crystal-line axes orientation from X-ray or FTIR) and global
orientation from birefringence and the 2016 cmK1band are
presented onTable 5. For the amorphous phase orientation,
basically the same comments and discussion as above for blown films can be said. An interesting result to be
mentioned is the agreement on the global orientation from Tabl
e 4 Crys talline orient ation factors determ ined fro m dif ferent techn ique s fo r uniaxial ly and biaxial ly draw n H DPE films Sampl e Techni que MD orientation factor s T D orienta tion fact ors N D orientation factor s a -axis b -ax is c-ax is a -axis b -axis c-axis a -ax is b -axis c-axis 4 ! FTIR K 0.50 0 0.333 0.16 7 X-ray K 0.39 8 K 0.23 6 0.63 4 0.194 0.239 K 0.43 3 0.20 4 K 0.00 3 K 0.201 K 0.44 8 0.84 6 0.311 K 0.50 5 0.15 3 K 0.357 4 ! 4 FTIR K 0.28 3 K 0.12 8 0.41 1 K 0.275 0.106 0.16 9 0.55 8 K 0.05 7 K 0.501 X-ray K 0.24 7 K 0.11 3 0.36 0 K 0.034 0.090 K 0.05 6 0.28 1 0.02 4 K 0.305 K 0.22 4 0.47 1 0.147 K 0.11 3 0.09 3 K 0.374 X-ray res ults w ere backgrou nd and absorpt ion co rrected, first ro w of X-ray res ults ind icate c-ax is calculated from a -axis and b -axis, second row of X-ray results ind icate (020) calcul ated from (200) and (1 10). For FT IR spectro scopy results on the uniaxial ly drawn samp le, the a -ax is orienta tion w as de termin ed fro m the 1894 cm K 1vib ration but the b -ax is orienta tion coul d not be de termin ed bec ause of saturatio n of the dif ferent ba nds associ ated with it and hence, the c-axis or ientation could not be de termin ed.
Table 5
Amorphous and global orientation factors determined from the different techniques for the uniaxially and biaxially drawn HDPE films
Film sample Crystallinity (%)
fM fT fN
Amorphous orientation factors from FTIR bands of: 1303 cmK1
, amorphous trans 1368 cmK1
, amorphous trans 4! 79.2 0.131 0.001 K0.132 0.060 K0.060 0.000 Amorphous orientation factors from FTIR band of: 720 cmK1 4!4 80.6 0.166 K0.420 0.254
Calculated amorphous orientation fM fT fN
XR1 XR2 FTS XR1 XR2 FTS XR1 XR2 FTS
Calculated amorphous orientation from X-ray or FTIR and global orientation (from birefringence or FTIR band at 2016 cmK1) 4! (brief) 0.942 0.135 – 0.033 0.308 – K0.975 K0.443 – 4! (2016) 1.023 0.216 – K0.414 K0.140 – 0.609 K0.076 – 4!4 (brief) 0.747 0.285 0.535 K0.257 K0.020 K1.192 K0.485 K0.199 0.329
Average orientation Crystallinity (%) DnMNand/or fM DnTNand/or fT DnMTand/or fN
Measured total birefringence and global orientation from measured birefringence and from 2016 cmK1
4! (brief) 79.2 41.0, 0.698 1.0, K0.336 40, K0.362
4!2016 cmK1 79.2 0.715 K0.429 K0.286
4!4 (brief) 80.6 30.0, 0.435 9.5, K0.095 20.5, K0.340 D8Z0.058 for HDPE crystalline and amorphous phases. Just c-axis contribution was considered in global orientation.
Table 6
Comparison of the simplified FTIR approach with the full calculations approach and X-ray diffraction results
Technique fa,MD fb,MD fc,MD fa,TD fb,TD fc,TD fa,ND fb,ND fc,ND
25 mm HDPE film
XRD 0.232 K0.334 0.102 K0.145 0.246 K0.101 K0.087 0.102 K0.015
FTIR tilted technique full calculations 0.257 K0.458 0.201 K0.201 0.283 K0.082 K0.056 0.175 K0.119 FTIR simplified approach 0.257 K0.436 0.180 K0.201 0.270 K0.068 K0.056 0.166 K0.110 12 mm HDPE film
XRD 0.066 K0.357 0.292 K0.097 0.309 K0.212 0.031 0.063 K0.094
FTIR tilted technique full calculations 0.166 K0.470 0.304 K0.141 0.386 K0.245 K0.026 0.084 K0.059 FTIR simplified approach 0.166 K0.459 0.293 K0.141 0.377 K0.236 K0.025 0.082 K0.057
A. Ajji et al. / Polymer 46 (2005) 3838–38 46 3845
birefringence and the 2016 cmK1band for the uniaxially oriented film. This is probably because of the highly oriented nature of the film, which makes the gauche orientation also quite higher and yields higher birefringence, in contrast with films with a low orientation.
As mentioned in the introduction, a simplified FTIR procedure without the use of the tilted technique has been
proposed in literature for[17,18]for film possessing the row
structure. Details of the procedure can be found in Refs.17,18.
Our purpose here is to compare this procedure with the full FTIR procedure that uses the tilted technique and compare both results with X-ray diffraction. First, the morphology has to be of the row-nucleated type, which is the case as
illustrated for the blown films inFigs. 4 and 5. We consider
here only the thin blown films of 12 and 25 mm in order to avoid any peak saturation. The results are presented in
Table 6 for the crystalline axes orientation factors. It is clearly seen that the two FTIR procedures give similar results, but both are different from those obtained from X-ray diffraction as discussed above. This is a confirmation of the validity of the simplified procedure in the limits of its validity, but one should be aware that the results are different from those from X-ray diffraction and, if you do not have a row nucleated morphology, the results of the two FTIR procedures are completely different as will be shown in a forth coming paper on linear low density polyethylene (LLDPE).
Finally, in determining the biaxial orientation factors of polyethylenes using different techniques, one should be careful in their interpretation. FTIR may overestimate
significantly a-axis orientation, decomposition of the different contributions may be difficult and peaks may saturate even for quite thin films. Amorphous phase orientation determination may be significantly affected by peaks overlap.
References
[1] Yu TH, Wilkes GL. Polymer 1996;37:4675.
[2] McRae MA, Maddams WF. J Appl Polym Sci 1978;22:2761. [3] Choi KJ, Spruiell JE, White JL. J Polym Sci: Polym Phys Ed 1982;20:
27.
[4] Kanetsuna H. J Appl Polym Sci 1978;22:2707.
[5] Matthews RG, Duckett RA, Ward IM, Jones DP. Polymer 1997;38: 4795.
[6] Cole KC, Ajji A. Characterization of orientation. In: Ward IM, Coates PD, Dumoulin MM, editors. Solid phase processing of polymers. Munich: Carl Hanser Verlag; 2000.
[7] Stein RS, Norris FH. J Polym Sci 1956;21:381. [8] Stein RS. J Polym Sci 1958;31:327.
[9] Stein RS. J Polym Sci 1958;31:335.
[10] Read BE, Stein RS. Macromolecules 1968;116. [11] Desper CR. J Appl Polym Sci 1969;13:169.
[12] Zhang XM, Verilhac JM, Ajji A. Polymer 2001;42:8179. [13] Lindenmeyer PH, Lustig S. J Appl Polym Sci 1965;9:227. [14] Desper CR, Stein RS. J Appl Phys 1966;37:3990. [15] Read BE, Hughes DA. Polymer 1972;13:495.
[16] Maddams WF, Preedy JE. J Appl Polym Sci 1978;22:2721–59. [17] Kissin YV. J Polym Sci, Part B: Polym Phys 1992;30:1165. [18] Krishnaswamy RK. J Polym Sci, Part B: Polym Phys 2000;38:182. [19] Ajji A, Guevremont J, Matthews RG, Dumoulin MM. ANTEC 1998;
2:1588.