Publisher’s version / Version de l'éditeur:
SAE International Journal of Materials and Manufacturing, 4, 1, pp. 138-151,
2011-06-15
READ THESE TERMS AND CONDITIONS CAREFULLY BEFORE USING THIS WEBSITE.
https://nrc-publications.canada.ca/eng/copyright
Vous avez des questions? Nous pouvons vous aider. Pour communiquer directement avec un auteur, consultez la première page de la revue dans laquelle son article a été publié afin de trouver ses coordonnées. Si vous n’arrivez pas à les repérer, communiquez avec nous à PublicationsArchive-ArchivesPublications@nrc-cnrc.gc.ca.
Questions? Contact the NRC Publications Archive team at
PublicationsArchive-ArchivesPublications@nrc-cnrc.gc.ca. If you wish to email the authors directly, please see the first page of the publication for their contact information.
NRC Publications Archive
Archives des publications du CNRC
This publication could be one of several versions: author’s original, accepted manuscript or the publisher’s version. / La version de cette publication peut être l’une des suivantes : la version prépublication de l’auteur, la version acceptée du manuscrit ou la version de l’éditeur.
For the publisher’s version, please access the DOI link below./ Pour consulter la version de l’éditeur, utilisez le lien DOI ci-dessous.
https://doi.org/10.4271/2011-01-0036
Access and use of this website and the material on it are subject to the Terms and Conditions set forth at
Analysis of Residual Stress Profiles in the Cylinder Web Region of an
As-Cast V6 Al Engine Block with Cast-In Fe Liners Using Neutron
Diffraction
Sediako, Dimitry; D'Elia, Fancesco; Lombardi, Anthony; Machin, Alan;
Ravindran, C. (Ravi); Hubbard, Camden; Mackay, Robert
https://publications-cnrc.canada.ca/fra/droits
L’accès à ce site Web et l’utilisation de son contenu sont assujettis aux conditions présentées dans le site LISEZ CES CONDITIONS ATTENTIVEMENT AVANT D’UTILISER CE SITE WEB.
NRC Publications Record / Notice d'Archives des publications de CNRC:
https://nrc-publications.canada.ca/eng/view/object/?id=d0a97605-19ca-4363-b544-2b633f91d041 https://publications-cnrc.canada.ca/fra/voir/objet/?id=d0a97605-19ca-4363-b544-2b633f91d041Page 1 of 15
11M-0362
Analysis of Residual Stress Profiles in the Cylinder Web Region of an
As-Cast V6 Al Engine Block with Cast-In Fe Liners
Using Neutron Diffraction
D. Sediako
1, F. D’Elia
2, A. Lombardi
2, A. Machin
2,
C. Ravindran
2, C. Hubbard
3, and R. Mackay
4 1Canadian Neutron Beam Centre, National Research Council of Canada; Chalk River, ON, Canada
2
Centre for Near-net-shape Processing of Materials, Ryerson University, Toronto, ON, Canada
3
Oak Ridge National Laboratory, Oak Ridge, TN, USA
4
Nemak Canada, Windsor, ON, Canada
Copyright © 2011 SAE International
ABSTRACT
Continuous efforts to develop a lightweight alloy suitable for the most demanding applications in automotive industry resulted in a number of advanced aluminum (Al) and magnesium alloys and manufacturing routes. One example of this is the application of 319 Al alloy for production of 3.6L V6 gasoline engine blocks. Aluminum is sand cast around Fe-liner cylinder inserts, prior to undergoing the T7 heat treatment process. One of the critical factors determining the quality of the final product is the type, level, and profile of residual stresses along the Fe liners (or extent of liner distortion) that are always present in a cast component.
In this study, neutron diffraction was used to characterize residual stresses along the Al and the Fe liners in the web region of the cast engine block. The strains were measured both in Al and Fe in hoop, radial, and axial orientations. The stresses were subsequently determined using generalized Hooke’s law. Further, detailed microscopy and hardness measurements were performed from top to bottom along the interbore region of each cylinder. The microstructure was characterized using an optical and scanning electron microscope (SEM). Further, composition analyses were performed using energy dispersive X-ray spectroscopy (EDX). The results suggest that a variation in cooling rate along the cylinder caused a refinement of Al2Cu, Al15(Mn,Fe)3Si2 and eutectic silicon at the
bottom of the cylinder. Increased cooling rate at the bottom of the cylinder also led to a more globular and uniform distribution of second phase particles, thereby resulting in increased hardness.
This study gives invaluable insight on anticipated service properties of the engine block and demonstrates that neutron strain mapping is an efficient tool for optimization of manufacturing technologies.
INTRODUCTION
Aluminum (Al) alloys are increasingly popular in the automotive and aerospace industries. These alloys boast low density, excellent strength and good castability. One of the most widely used Al alloys is the aluminum-silicon-copper (Al-Si-Cu) system. These alloys benefit from Cu additions, which contribute to strengthening and machinability and Si additions, which improve castability.
Aluminum alloy 319 is the most frequently used Al-Si-Cu alloy. Common applications of this alloy include transmission cases, cylinder heads and engine blocks.
Engine blocks manufactured by 319 require the use of gray iron (Fe) liners to resist wear from sealings mounted in pistons. These liners are often cast-into the block, which allows for high productivity [1]. However, these cast-in iron liners may pose a problem. During casting, molten Al solidifies around the gray iron liners at the interbore regions. As a result, a significant variation in cooling
Page 2 of 15
rate may occur in these regions, leading to a non-uniform microstructure and mechanical properties. This lack of uniformity in microstructure and mechanical properties may lead to further problems when the engine blocks are heat treated and subsequently exposed to in-service conditions. For instance, a non-uniform microstructure along the engine block may result in a more complete dissolution of equilibrium phases in certain sections of the engine block. This non-uniform dissolution of phases can further result in a variation of material strength and lead to dimensional distortion when the engine blocks are exposed to in-service conditions [2]. Therefore, there is a need to characterize the microstructure along the cylinder of the engine block, specifically at the interbore regions. Further, residual stress measurements at these regions will enable a quantification of the severity of distortion.
Investigation of the cause of the distortion in the V6 engine block was the focus of this study. Neutron diffraction was carried out to characterize residual stresses along the Al and the Fe liners in the web region of the cast engine block. The strains were measured both in Al and Fe in hoop, radial, and axial orientations, thereby enabling the stresses to be determined using generalized Hooke’s law. Detailed microstructural characterization was correlated with the hardness measurements for the engine block from the top of the cylinder bridge to the bottom.
NEUTRON DIFFRACTION ANALYSIS
BACKGROUND
Neutrons are electrically neutral and can interact directly with nuclei of the atoms that make up the material. As a result neutrons are highly penetrating. For example, neutrons can penetrate through approximately 1 inch of steel. Neutron diffraction therefore provides a technique for the non-destructive measurement of residual strains and stress at depth of the sample material [3, 4].
Neutrons provided by a nuclear reactor are directed towards the measurement location within the specimen where they are diffracted from the lattice planes of the crystallites that form the material. The angle, 2θ, at which the neutrons are diffracted depends on the wavelength of the incident neutron beam, λ, and the spacing between the lattice planes, d, through Bragg’s law,
( )
λ
= 2d sin
θ
. (1)
The lattice strain, ε, is the fractional change in the lattice spacing with reference to the stress-free lattice spacing, do, viz.,
ε
=
d
−
d
d
o o
. (2)
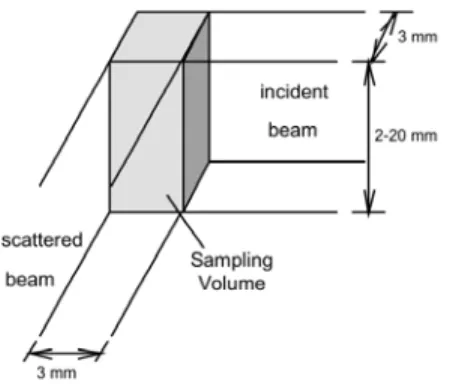
The volume defined by the intersection of incident and diffracted neutron beams is called the sampling volume (Figure 1). The specimen is moved by a computer-controlled translation and rotation system to position the sampling volume at locations of interest within the specimen.
The strain is measured in the specimen direction parallel to the bisector of the incident and diffracted neutron beams (Figure 2). This bisector is known as the scattering vector. By re-orienting the specimen, various components of strain can be determined. For a “classical” cylindrical specimen these strain components are likely to be radial (R), axial (A) and hoop (H).
The three residual stress components, σx, where for a cylinder x = (R, A, or H), are then calculated from the three strain components
using the expression,
(
)
⎥⎦
⎤
⎢⎣
⎡
+
+
−
+
+
=
x R A H xE
ε
ε
ε
ν
ν
ε
ν
σ
2
1
1
, (3)
Page 3 of 15
Figure 1 - Sampling volume defined by the intersection of rectangular cross-section incident and diffracted neutron beams.
⊥ (hkl) planes x y incident beam scattered beam (hkl) planes ε detector
Figure 2 - The component of strain parallel to the bisector of the incident and diffracted neutron beams (the scattering vector) is measured at the intersection of these beams.
HOOP STRAIN MAPPING
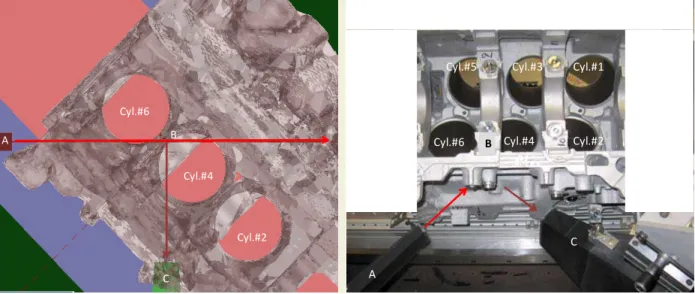
The as-cast engine block was positioned on the sampling table as shown in Figure 3. Figure 3a shows the image generated by the spectrometer’s control system for measurements of strains in Al and also in Fe liners in the cylinders’ web area. The measurements were performed in the web between cylinders 6 and 4 on one side of the V-type engine block. The actual hoop-strain setup is shown in Figure 3b. The sample was positioned on the table with the over-all precision of +/-0.5 mm.
Page 4 of 15 A C B Cyl.#6 Cyl.#4 Cyl.#2
Cyl.#6 Cyl.#4 Cyl.#2
A C B Cyl.#1 Cyl.#3 Cyl.#5 a. b.
Figure 3 - Orientation of incident and scattering beams and the engine block in measurement of hoop component of strain in the cylinder web region; a – control system map; b – actual positioning of the engine block on the spectrometer sample table.
The selected neutron wavelength for the experiment was 1.73 A. According to the Bragg’s law (equation 1) this corresponded to a diffraction angle 2θ of 90.1 degrees for Al (using the 311 planes for Al 319) and 95.4 degrees for Fe (211 reflection for gray iron). The monochromated incident beam from the reactor-side slit system (A, Figure 3) penetrates through the bulk of the sample material (both Al and Fe). The sampling volume (B) is then formed by the intercept of the incident beam A and diffracted beam that reaches the neutron detector through the slit system C.
After collecting the neutron data at a specific location in the cylinder web the engine was translated in XYZ directions so that the next point-of-interest was positioned in the location of the sampling volume B. The neutron scan was then repeated for the new point. Figure 4 depicts the progress in determining the hoop strain in the selected locations in Al in the web region along cylinders #4 and #6. Equations (1) and (2) were used to convert the measured position of the diffracted peak to the interatomic d-spacing and then to the values of strain. The reference value of the d-spacing for stress-free material, d0 in equation (2), was determined from neutron
scans of “match stick” samples cut from a low-stress area of the casting. Special care was taken not to introduce any extra stress into the sample material during the machining operation. It was assumed that any residual stress in the material would be relieved during machining of the tiny (2x2x20 mm) stress-free samples. The d0 value for Al was determined as 0.12 nm (1.22 A) and 0.117 nm (1.17
A) for Fe.
a. b. c.
Figure 4 - Results of neutron scan of the hoop component of strain in aluminum in the web region between the cylinders #4 and #6; a – angular position of the Bragg’s peak for the nine measured locations; b – calculated d-spacing for the measured locations; c – hoop strain for the measured locations.
Page 5 of 15
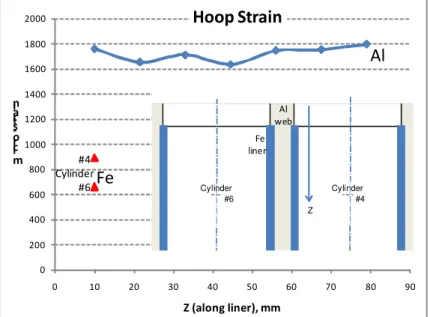
The values of hoop strain for the Al web between the cylinders, and the Fe liners were plotted against Z-coordinate – that is along the cylinder liners – to a depth of 79 mm (Figure 5). The top of the cast-in Fe liners corresponded to the position of 10 mm of Z
coordinate. The hoop strain in Fe was measured at this position in both liners. As follows, all the strains were tensile, ranging from ~650 to 900 microstrain (or strain.106) in the top part of the Fe liners and from ~1600 to 1800 microstrain in Al along the web.
0 200 400 600 800 1000 1200 1400 1600 1800 2000 0 10 20 30 40 50 60 70 80 90 m ic ro ‐s tr a in Z (along liner), mm
Hoop Strain
Al
Fe
Cylinder Cylinder #6 #4 Z Al web Fe liner #4 Cylinder #6Figure 5 - Hoop strains in Al casting and Fe liners along the web region.
RADIAL STRAIN MAPPING
The radial-orientation strains were determined in the casting in a similar fashion as the hoop strains. Figure 6 depicts positioning of the engine block on the sample table.
A B C #6 #4 #2 A C B a. b.
Figure 6 - Orientation of incident and scattering beams and the engine block in measurement of radial component of strain in the cylinder web region; a – control system map; b – actual positioning of the engine block on the spectrometer sample table.
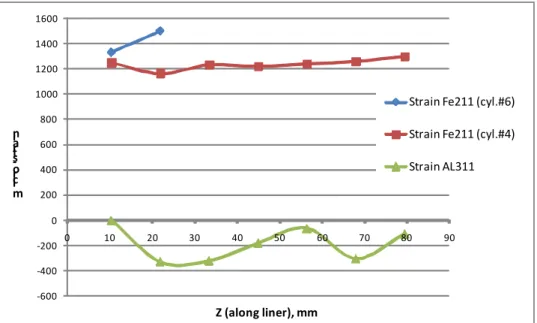
The progress in determining the radial strain in the selected locations of Al is shown in Figure 7. The final results of strain for Al and Fe are presented in Figure 8. It follows that the Fe liners were experiencing tensile strain of 1200~1500 x10-6 (1200~1500
Page 6 of 15
a. b. c.
Figure 7 - Results of neutron scan of the radial component of strain in aluminum in the web region between the cylinders #4 and #6; a – angular position of the Bragg’s peak for the nine measured locations; b – calculated d-spacing for the measured locations; c – hoop strain for the measured locations.
‐600 ‐400 ‐200 0 200 400 600 800 1000 1200 1400 1600 0 10 20 30 40 50 60 70 80 90 m ic ro ‐s tr a in Z (along liner), mm Strain Fe211 (cyl.#6) Strain Fe211 (cyl.#4) Strain AL311
Figure 8 - Radial strains in Al casting and Fe liners along the web region.
AXIAL STRAIN MAPPING
Axial strain mapping completed the 3D characterization of strains in the web region. Figure 9 depicts positioning of the engine block on the sample table.
Page 7 of 15 Cyl.#6 Cyl.#4 Cyl.#2 Web #1 Web #2 Cyl.#5 Cyl.#3 B C a. Cyl.#2 Cyl.#1 b.
Figure 9 - Orientation of incident and scattering beams and the engine block in measurement of axial component of strain in the cylinder web region; a – control system map; b – actual positioning of the engine block on the spectrometer sample table.
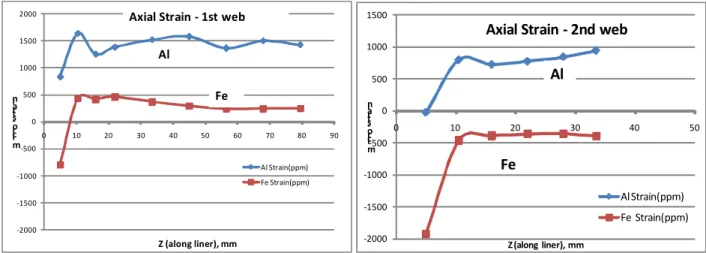
‐2000 ‐1500 ‐1000 ‐500 0 500 1000 1500 2000 0 10 20 30 40 50 60 70 80 90 m ic ro ‐s tr a in Z (along liner), mm Al Strain(ppm) Fe Strain(ppm) Al Fe Axial Strain ‐ 1st web ‐2000 ‐1500 ‐1000 ‐500 0 500 1000 1500 0 10 20 30 40 50 m ic ro ‐s tr a in Z (along liner), mm Al Strain(ppm) Fe Strain(ppm) Al Fe Axial Strain ‐ 2nd web
Figure 10 - Radial strains in Al casting and Fe liners along the web region.
The progress and results of these measurements are presented in Figures 10. Two web regions were examined in this part of the study; namely, between cylinders #4 and #6 (1st Web) and also, between cylinders #2 and #4 (2nd Web). The purpose of the second web scan was to compare the results received for the two web regions and confirm (or deny) whether both were experiencing similar strain conditions.
It follows from Figure 10 that axial strain in Al was similar in both cases. The values were found to be tensile and typically ranging from 750 to 1500 microstrain. The very top of the web was found to have the lowest values ranging from 0 to 800 microstrain. Axial strains for the Fe liners, on the other hand, were lower. These values were under 500 microstrain and were both tensile (1st web) and compressive (2nd web). The very top of the Fe liners was under compressive strain reaching 2000 microstrain.
Page 8 of 15
RESIDUAL STRESS ANALYSIS
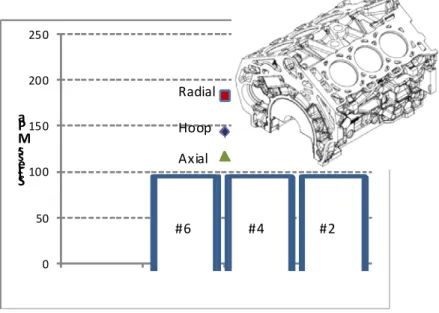
The approach used in this study for determining the three components of strain (hoop, radial, and axial) allows for characterization of residual stress by applying the generalized Hooke’s law (equation 3). Results of these calculations for Fe liners are presented in Figure 11. It follows that residual stresses in Fe liners were ranging from 120 to 180 MPa for all orientations.
0 50 100 150 200 250 0 5 10 15 S tr e ss , M P a Z (along liner), mm Radial Hoop Axial #6 #4 #2
Figure 11 - Components of Stress on the top of iron liner (measurements performed in cylinder #4).
0 50 100 150 200 250 0 20 40 60 80 100 St re ss (M P a ) Z (along liner) (mm) Hoop Radial Axial
Figure 12 - Stress distribution in aluminum along the cylinder web.
The values of residual stress were slightly higher for Al in comparison to Fe (see Figure 12). For instance, hoop stress reached about 190 MPa along the liners to the maximum depth measured of 79 mm, while axial stresses had values near 160 MPa. The values were lower for the radial component of stress, however, as the stress was found to be approximately 100 MPa. All stresses measured in Al and Fe were tensile.
The typical yield stress values for cast iron and 319 Al are in the range of 138 – 414 MPa [5] and 96-124 MPa [5, 6], respectively. As a result, the values of residual stress obtained from neutron scans (see Figures 11 and 12) suggest that distortion of Fe liners and Al
Page 9 of 15
may occur. In particular, the measured stress values for Al exceed the alloy’s yield stress; while the stresses for hoop and axial are at the level of the alloy’s tensile strength (~165 MPa [6]). This suggests that high tensile stresses develop in the Al, which thereby may result in dimensional distortion of the cylinder bores.Furthermore, similar to the axial strain distribution, the distribution of residual stress along the cylinder (Figure 8) illustrates a reduction in hoop, radial and axial stress at ~20 mm along the cylinder liner. In turn, this suggests that the top 20 mm of the cylinder is likely most prone to distortion.
It was reported in [7] that an increase in heat-treating temperature caused bulk strains to go from tensile to slightly tensile or compressive. This gives reason to believe that precipitation of phases (e.g., Cu, Mg) during heat treatment may also play a role in stress development and subsequent engine block distortion. Therefore, it will be beneficial to extend neutron diffraction analysis to heat treated engine blocks.
It is also worthwhile to perform neutron studies to include dyno-tested and service-tested engine blocks as well. This will enable a characterization of residual stresses for these conditions and determine whether distortion of cylinder bores has occurred.
METALLOGRAPHIC ANALYSIS
The composition of the modified 319 alloy is shown in Table 1. The engine block was produced by precision sand casting at Nemak in Windsor, Ontario.
Table 1: Composition of the modified 319 engine block (wt %).
Si Cu Zn Fe Mg Mn Ti Ni Cr Sr Sb B Bi Al
8.5 2.7 0.5 0.4 0.35 0.35 0.15 0.04 0.03 0.005 0.002 0.001 0.001 Balance
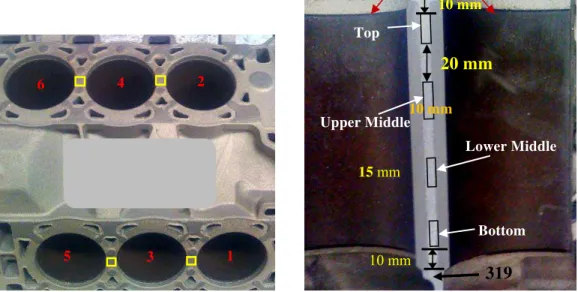
Extensive microscopy was carried out on the modified 319 Al engine block at the bridge between each cylinder bore, as shown in Figure 13(a). The cylinder bridge was selected for analysis since this location was designated as an area prone to high residual stresses [1]. Microstructural analysis was also performed at various sections (top, upper middle, lower middle and bottom) along the cylinder, as shown in Figure 13(b). However, scanning electron microscopy and phase microanalysis was performed only on the top and bottom sections, since optical microscopy revealed the largest variations in microstructure along these sections. All the cylinder sections analyzed were approximately 15 mm in length. The top and bottom sections were taken approximately 10 mm from the top and bottom, respectively, corresponding to the locations where the Al is in contact with the gray cast iron cylinder liner.
Figure 13 - Images of: (a) tope view of engine block, indicating analysed sections, (b) cross-section of the cylinder bridge showing sections analysed along the cylinder depth.
Top Upper Middle Lower Middle Bottom 10 mm
20 mm
15 mm 10 mm319
10 mm Fe Liner 6 4 2 5 3 1Page 10 of 15
Image analysis software was used in conjunction with backscattered electron (BSE) images to quantify the amount of the Al-Cu and Al-Fe-Mn-Si phases present at each section of the cylinder. Phase microanalysis of the intermetallic particles was carried out using energy dispersive X-ray spectroscopy (EDX), while the composition of the α-Al matrix was determined using wavelength dispersive X-ray spectroscopy (WDS). Hardness testing was performed at the top and bottom of each cylinder bridge to relate the mechanical properties to any variation in microstructure.
DENDRITE STRUCTURE
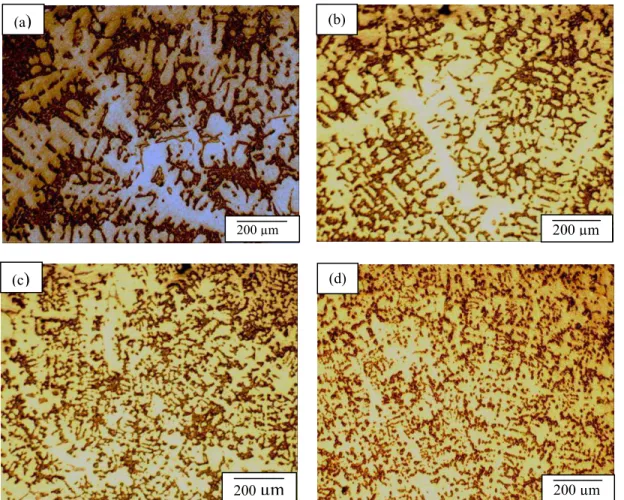
Optical microscopy revealed a significant variation in the dendrite structure of each cylinder bridge when comparing the top and bottom sections of the cylinder. It was observed that the top of the cylinder bridge contained relatively coarse dendrites, while the bottom of the cylinder contained finer dendrites. This is shown in Figure 14.
Figure 14 - Optical micrographs showing the dendrite structure of: (a) Cylinder (2-4) bridge top, (b) Cylinder (2-4) bridge upper middle , (c) Cylinder (2-4) bridge lower middle, (d) Cylinder (2-4) bridge bottom.
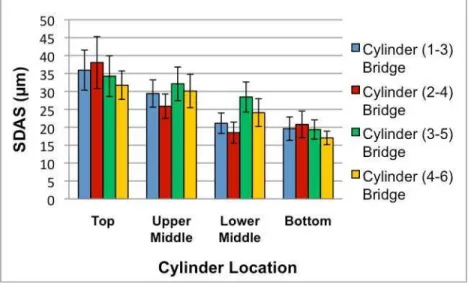
The SDAS was measured at the top, upper middle, lower middle and bottom sections of the cylinder bridge. The results are shown in Figure 15. The measurements confirm the observations in Figure 14, as the SDAS was found to continuously decrease from the top to the bottom of the cylinder.
200 µm (d) 200
µm
(c)
(b) 200 µm (a)
200 µmPage 11 of 15
Figure 15 - Results from the measurement of the SDAS in the as-cast 319 engine block.
The refinement of dendrites in the bottom section of the cylinder bridge indicated that this section may have experienced a shorter local solidification time and faster cooling rate than the top section [8, 9]. The cooling rates (R) were estimated from the SDAS measurements using an empirical relationship developed by Vazquez-Lopez et al. [10] for Al-Si alloys. This relation is shown in Equation 4. 34 . 0
1
.
36
−=
R
SDAS
(4)
The cooling rate was estimated to be approximately 1 °C/s at the top of the cylinder and 7 °C/s at the bottom. This result was expected however, based on the design of the sand mould. The bottom section of the cylinder had chills inserted into the sand mould prior to pouring, resulting in an increased solidification rate. Conversely, the top section of the cylinder was the section nearest to the riser and this section is required to solidify last in order to reduce shrinkage porosity [9]. Therefore, the top section of the cylinder likely had a longer local solidification time, resulting in significantly larger dendrites as compared to the bottom cylinder section.
MORPHOLOGY OF INTERMETALLIC PHASES
Energy dispersive X-ray spectroscopy was performed on the 319 engine block. The results suggest that the microstructure of the cylinder bridge was composed of an α-Al matrix, eutectic silicon particles, as well as Al-Cu, Al-Fe-Mn-Si and Al-Mg-Si-Cu intermetallic phases. Based on the results obtained by Lasa and Rodriguez-Ibabe [11], the intermetallic phases correspond to Al2Cu,
Al15(Fe,Mn)3Si2 and Al5Mg8Cu2Si6, respectively. While it was observed that both the top and bottom of the cylinder bridge contained
the same phases, the variation in cooling rate and dendrite structure from the top to the bottom of the cylinder led to a significant modification in the morphology of the intermetallic. As shown in Figure 16(a), the microstructure of the top of the cylinder bridge was characterized by coarse clusters of eutectic silicon particles, coarse Al2Cu particles of mostly blocky morphology in clusters with the
Al5Mg8Cu2Si6 phase and Chinese script Al15(Fe,Mn)3Si2. The morphology of the eutectic silicon particles shows that the eutectic
silicon was partially modified by the addition of Sr as indicated by regions where there are clusters of small silicon particles [12]. The presence of Sr in the alloy may have also influenced the morphology of the Al2Cu phase since it has been observed that Sr promotes
the formation of blocky Al2Cu as opposed to eutectic Al2Cu [13].
The bottom of the cylinder bridge was characterized by a significant refinement of the secondary phases, as shown in Figure 16(b), in contrast the top of the cylinder bridge which had coarse secondary phases. Accompanying this refinement in particle size was a modification in the morphology of eutectic silicon and the intermetallic particles. Eutectic silicon, Al5Mg8Cu2Si6 and Al2Cu became
finer and more globular, while Al15(Fe,Mn)3Si2 changed from coarse Chinese script to a finer particulate morphology. From the
observations of the dendrite structure and measurement of the SDAS, it can be deduced that the modification of the phase morphology was likely due to the reduction of the local solidification time at the bottom relative to the top.
Page 12 of 15
Figure 16 - Backscattered electron images of: (a) Cylinder (4-6) bridge top (200x), (b) Cylinder (4-6) bridge bottom (300x).
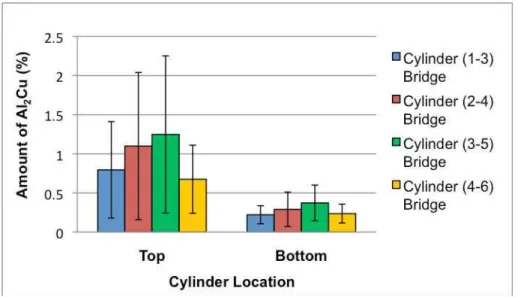
Scanning electron microscopy in conjunction with image analysis software revealed that the increased cooling rate at the bottom of the cylinder influenced the amount and distribution of second phase particles. Quantitative phase analysis, shown in Figure 17, revealed a reduction in the amount of Al2Cu at the bottom section of the cylinder relative to the top. This result confirms the observations of Li et
al. [2], which show that the amount of Al2Cu that forms during solidification is dependent on the local solidification time. The results
obtained using image analysis also revealed significant clustering of the Al2Cu intermetallic particles at the top section of the cylinder,
as illustrated by the large error bars in Figure 17. Conversely, the bottom section of the cylinder had a more uniform distribution of Al2Cu, as shown by the error bars for the bottom section, in Figure 17.
Figure 17 - Amount of Al2Cu at the top and bottom section of the cylinder bridge for the engine block.
Image analysis revealed a slight reduction in the amount of the Al15(Fe,Mn)3Si2 phase from top to bottom of the cylinder bridge, as
shown in Figure 18. However, as in the case of the Al2Cu phase, the Al15(Fe,Mn)3Si2 particles were more evenly distributed at the
bottom of the cylinder bridge.
Al15(Fe,Mn)3Si2 Si Al2Cu Al5Mg8Cu2Si6 100 µm Al2Cu Si Al15(Fe,Mn)3Si2 Al5Mg8Cu2Si6 100 µm 100 µm
Page 13 of 15
Figure 18 - Amount of Al5(Fe,Mn)3Si2 at the top and bottom section of the cylinder bridge for the engine block.
The refinement of intermetallic particles at the bottom of the cylinder was likely due to the refinement of dendrites. Intermetallic particles segregate to inter-dendritic regions during solidification, therefore, finer dendrites, with a smaller SDAS, provide smaller areas for which the intermetallic particles can grow. Furthermore, a reduction in the local solidification time at the bottom of the cylinder relative to the top also likely caused a refinement of second phase particles as less time was provided for the growth of these particles prior to solidification.
HARDNESS TESTING
Hardness measurements were performed at the top and bottom locations of the cylinder bridge. The results in Figure 19 show that there was a small increase in hardness at the bottom of the cylinder.
Figure 19 - Hardness measurements of the cylinder bridge region of the engine block.
The hardness likely increased due to the refinement of the dendrites and the morphological modification of the intermetallics, since microhardness measurements showed a negligible change in hardness of the α-Al matrix. The results are shown in Figure 20.
Page 14 of 15
Figure 20 - Microhardness measurements of the Al-matrix for the cylinder bridge region of the engine block.
The increase in hardness indicates increased alloy strength at the bottom of the cylinder compared to the top. Since tensile residual stresses are formed at the Al-Fe interface during solidification, the weaker section of the cylinder would be more prone to dimensional distortion when exposed to the in-service conditions of the engine. The results obtained from neutron diffraction analysis support this claim as a drop in hoop, radial and axial residual stress was observed at the top section of the cylinder bridge. The residual stress distribution was not measured at the bottom section due to clearance issues. Nevertheless, the stress measurements show a gradually increasing trend towards the bottom of the cylinder. The increasing stress indicated that dimensional changes, due to the residual stresses generated at the Al-Fe interface, would likely not occur at the bottom of the cylinder. While dimensional distortion may occur if the residual stresses surpass the yield point of the material, the residual stresses are partially relieved at locations where permanent deformation has occurred, thus revealing the locations which are prone to distortion [14]. Therefore, it can be deduced that the increased alloy strength at the bottom reduces the likelihood of dimensional distortion at this section of the cylinder.
SUMMARY/CONCLUSIONS
1. Neutron diffraction was applied for strain and stress measurements on an as-cast aluminum V6 engine block in hoop, radial, and axial orientations. Studies were performed for the cylinder web region for iron liners and aluminum to the depth of 79 mm. It was confirmed that all residual stresses in the specified location of the casting are tensile. Stress values are about 180 MPa for iron and typically under 200 MPa for aluminum.
2. Values of stress in Al were found to exceed the alloy’s yield stress and approach its ultimate tensile strength. This suggested that a high build up of stress in the Fe liners and Al occurs, which thereby may lead to dimensional distortion. Further investigation is warranted to characterize the residual stresses in the engine block following the T7 heat treatment process. The impact of variations in casting practice (eg. cooling/solidification rate) on grain size and stress level is envisaged for future studies. 3. Microstructural analysis revealed finer dendrites and a subsequent smaller SDAS for the bottom section of the cylinder bridge in
comparison to the top. This was attributed to a variation in cooling rate from top to bottom. Slower cooling rates at the top of the cylinder caused grains’ coarsening and modification in morphology of the second phase particles.
4. Rockwell hardness was found to increase by a small amount at the bottom of the cylinder due to the finer-grain and increased uniformity of the microstructure. This was in correlation to the results obtained from neutron diffraction analysis, as the increased hardness suggested increased alloy strength at the bottom of the cylinder relative to the top, and therefore, a reduced likelihood of distortion for the bottom of the cylinder.
Page 15 of 15
REFERENCES
1. Carrera, E., Rodríguez, A., Talamantes, J., Valtierra, S. and Colás, R., “Measurement of Residual Stresses in Cast Aluminum Engine Blocks”, Journal of Materials Processing Technology. 189: 206-210, 2007.
2. Li, M., Vijayaraghavan, R., Wolverton, C., Allison, J., “Simulation of Local Microstructures and Thermal Growth of a Cast 319 Aluminum Alloy Component”, presented at 1st International Symposium on Metallurgical Modelling for Aluminum Alloys, USA, October 13-15, 2003.
3. Noyan, I. C. and Cohen J. B., “Residual Stress: Measurement by Diffraction and Interpretation”, Springer-Verlag, New York, ISBN 0-387-96378-2, 1987.
4. Society for Experimental Mechanics, “Handbook of Measurement of Residual Stresses” Fairmont Press, Upper Saddle River, NJ, ISBN 0-881-73229-X, 1996.
5. Avallone, E. A., Baumeister III, T. and Sadegh, A. M., “Marks’ Standard Handbook for Mechanical Engineers 11th Edition”, McGraw-Hill Companies, Inc., New York, ISBN 0-07-142867-4, 2007.
6. Davis, J. R., “ASM Specialty Handbook: Aluminum and Aluminum Alloys”, ASM International, Materials Park, Ohio, ISBN 0-87170-496-X, 1993.
7. Wiesner, D. J., Watkins, T. R., Ely, T. M., Spooner, S., Hubbard and Williams, J. C., “Residual Stress Measurements of Cast Aluminum Engine Blocks using Diffraction”, JCPDS – International Centre for Diffraction Data, Advances in Analysis. 48: 136-142, 2005.
8. Flemings, M., “Solidification Processing”, McGraw-Hill Companies, Inc., New York, ISBN 0-07-021283-1, 1974. 9. Campbell, J., “Castings”, Elsevier Butterworth-Heinemann, Oxford, ISBN 0-7506-4790-6, 2003.
10. Vazquez-Lopez, C., Calderone, A., Rodriguez, M. E., Velasco, E., Cano, S., Colas, R., Valtierra, S., “Influence of dendrite arm spacing on the thermal conductivity of an aluminum-silicon casting alloy”, Journal of Materials Research. 15: 85-91, 2000. 11. Lasa, L., Rodriguez-Ibabe, J., “Evolution of the Main Intermetallic Phases in Al-Si-Cu-Mg Casting Alloys during Solution Heat
Treatment”, Journal of Materials Science. 39: 1343-1355, 2004.
12. Apelian, D., Sigworth, G., Whaler, K., “Assessment of Grain Refinement and Modification of Al-Si Foundry Alloys by Thermal Analysis”, AFS Transactions. 92: 297-307, 1984.
13. Li, Z., Samuel, A., Samuel, F., Ravindran, C., Valtierra, S., “Effect of alloying elements on the segregation and dissolution of CuAl2 phase in Al-Si-Cu 319 alloys”, Journal of Materials Science. 38: 1203-1218, 2003.
14. Totten, G., “Handbook of Residual Stress and Deformation of Steel”, ASM International, Materials Park, Ohio, ISBN 0871707292, 2002.
CONTACT INFORMATION
Dimitry Sediako
Canadian Neutron Beam Centre – National Research Council of Canada Chalk River Laboratories
Chalk River, ON K0J1J0
Email: Dimitry.Sediako@nrc-cnrc.gc.ca
Phone: 613-584-8811 Ext.44614
ACKNOWLEDGMENTS
The authors are grateful to AUTO21 Network of Centres of Excellence and the Natural Sciences and Research Council of Canada (NSERC) for their financial support. Neutron diffraction experiments at the 2nd Generation Neutron Residual Stress Mapping Facility at the High Flux Isotope Reactor were sponsored by the Department of Energy, Office of Energy Efficiency and Renewable Energy, Vehicle Technologies Program, through the Oak Ridge National Laboratory’s High Temperature Materials Laboratory User Program and by the Scientific User Facilities Division, Office of Basic Energy Sciences, U.S. Department of Energy. ORNL is operated by UT-Battelle, LLC for the U.S. DOE under Contract No. DE-AC05-00OR22725. Neutron stress analysis was completed at CNBC, NRC Canada, under the grant of NSERC. Further, the authors are thankful to Nemak Canada and the members of the Centre for Near-Net-Shape Processing of Materials at Ryerson University.