Publisher’s version / Version de l'éditeur:
Journal of Thermal Analysis and Calorimetry, 90, December 3, pp. 639-643, 2007-12-01
READ THESE TERMS AND CONDITIONS CAREFULLY BEFORE USING THIS WEBSITE.
https://nrc-publications.canada.ca/eng/copyright
Vous avez des questions? Nous pouvons vous aider. Pour communiquer directement avec un auteur, consultez la
première page de la revue dans laquelle son article a été publié afin de trouver ses coordonnées. Si vous n’arrivez pas à les repérer, communiquez avec nous à PublicationsArchive-ArchivesPublications@nrc-cnrc.gc.ca.
Questions? Contact the NRC Publications Archive team at
PublicationsArchive-ArchivesPublications@nrc-cnrc.gc.ca. If you wish to email the authors directly, please see the first page of the publication for their contact information.
NRC Publications Archive
Archives des publications du CNRC
This publication could be one of several versions: author’s original, accepted manuscript or the publisher’s version. / La version de cette publication peut être l’une des suivantes : la version prépublication de l’auteur, la version acceptée du manuscrit ou la version de l’éditeur.
For the publisher’s version, please access the DOI link below./ Pour consulter la version de l’éditeur, utilisez le lien DOI ci-dessous.
https://doi.org/10.1007/s10973-007-8516-7
Access and use of this website and the material on it are subject to the Terms and Conditions set forth at Calculation of smoothing factors for the comparison of DSC results
Masson, J-F.; Bundalo-Perc, S.
https://publications-cnrc.canada.ca/fra/droits
L’accès à ce site Web et l’utilisation de son contenu sont assujettis aux conditions présentées dans le site LISEZ CES CONDITIONS ATTENTIVEMENT AVANT D’UTILISER CE SITE WEB.
NRC Publications Record / Notice d'Archives des publications de CNRC: https://nrc-publications.canada.ca/eng/view/object/?id=0f22eefd-609c-4c76-a8d1-e2645edceb1c https://publications-cnrc.canada.ca/fra/voir/objet/?id=0f22eefd-609c-4c76-a8d1-e2645edceb1c
http://irc.nrc-cnrc.gc.ca
C a l c u l a t i o n o f s m o o t h i n g f a c t o r s f o r t h e
c o m p a r i s o n o f D S C r e s u l t s
N R C C - 4 5 5 8 8
M a s s o n , J - F . ; B u n d a l o - P e r c , S .
A version of this document is published in / Une version de ce document se trouve dans: Journal of Thermal Analysis and Calorimetry, v. 90, no. 3, Dec. 2007, pp. 639-643 doi: 10.1007/s10973-007-8516-7
The material in this document is covered by the provisions of the Copyright Act, by Canadian laws, policies, regulations and international agreements. Such provisions serve to identify the information source and, in specific instances, to prohibit reproduction of materials without written permission. For more information visit http://laws.justice.gc.ca/en/showtdm/cs/C-42
Les renseignements dans ce document sont protégés par la Loi sur le droit d'auteur, par les lois, les politiques et les règlements du Canada et des accords internationaux. Ces dispositions permettent d'identifier la source de l'information et, dans certains cas, d'interdire la copie de documents sans permission écrite. Pour obtenir de plus amples renseignements : http://lois.justice.gc.ca/fr/showtdm/cs/C-42
Calculation of smoothing factors for the comparison of DSC results
J-F. Masson*, S. Bundalo-Perc
Institute for Research in Construction, National Research Council of Canada, Ottawa, Ontario, Canada, K1A OR6.
*To whom correspondence should be addressed. Phone: (613) 993-2144. Fax (613) 952-8102. e-mail: jean-francois.masson@nrc.gc.ca
Abstract
The subjective selection of smoothing factors for the analysis and comparison of DSC results is addressed. Four key equations are shown to relate the heating rate and the smoothing factor. The equations allow a comparison of data acquired i) at different heating rates and plotted against temperature, ii) at a single heating rate and plotted against both time and temperature, iii) at different heating rates and plotted against both time and temperature, and iv) at different heating rates, and shown exclusively in the time domain. The equations apply equally well to DSC and modulated DSC results, including derivative curves.
Keywords: differential scanning calorimetry (DSC); modulated differential scanning
1. Introduction
Differential scanning calorimetry (DSC) is used to measure the enthalpy of transitions and the heating capacity of materials [1, 2]. The method has a long history [3, 4], with its foundation in thermodynamics firmly established by the turn of the 20th century [5]. Despite this long history and the widespread use of the method, it can be difficult to acquire the knowledge for proper DSC. Formal training is possible at less than 4% of science and engineering departments in the USA [4], and day- or week-long courses are often limited to basic techniques and analysis. The identification of artefacts is seldom discussed in the literature [6], and the issue of smoothing is absent from textbooks [2, 3].
In DSC, the heating flow from the sample is superimposed with a random signal, best described as noise. Figure 1 shows, for instance, data acquired at 1, 3 and 5 °C/min, where the slower the heating rate, the greater the noise. The problem of noise is especially acute in modulated DSC [7] when the derivative of the heating capacity is used to identify multiple glass transitions [8]. The unsmoothed derivative is very noisy
(Figure 2).
Generally, the removal of noise (smoothing) requires filtering, or digital processing, of the signal either in the time or the frequency domain [9]. In the frequency domain, smoothing is applied to the Fourier transform of the signal, a common method to filter spectroscopic data [10]. In DSC, heating flow is monitored against time and temperature, but smoothing is done in the time domain on data acquired at regular time intervals, where the most common methods of smoothing are the n-point moving average and the method of least squares [11, 12].
In this paper, the issue of smoothing DSC data is addressed, particularly the choice of smoothing factors such that data acquired under different conditions or displayed in different domains (time or temperature) can be compared on an equal basis to avoid possible misinterpretation. In this respect, the choice of appropriate smoothing factors for three scenarios is presented: a) data acquired at different heating rates; b) data compared across time and temperature domains; and c) combinations of a) and b). It was found that four key equations exist for the calculation of smoothing factors.
2. Experimental Section
The data were acquired with a DSC-2910 from TA Instruments. The data collection rate was 5 points/second, and the heating rates were 1°C/min, 3°C/min, and 5°C/min. The results were those for a bitumen after a second heating run between – 100°C and 150°C, where the signal is a complex superimposition of transitions [8, 13] and where the degree of smoothing may affect the interpretation of the results.
The DSC signals were smoothed with software from TA Instruments, Universal Analysis 2000, version 4.1d, for which smoothing is based on the method of least-squares and a minimum of five data points are used for calculations. The input for smoothing was the width of the region to be smoothed, either in min or in °C.
3. Results and Discussion
Fig. 1 shows the heating flow in the temperature domain for heating rate of 1, 3
and 5 °C/min. The faster the heating rate, the smoother the data. In such a comparison, it is difficult to determine the effect of heating rate on a transition that may be of interest, and to avoid interpreting noise. For an identical level of noise, the unsmoothed data must be in the time domain (Fig. 3), but such representation is not conducive to an easy comparison of the results because of the differences in scale.
With results such as those in Fig. 1, various smoothing factors can be applied to the curves by trial and error until they appear to have a uniform smoothness. This subjective approach can be problematic because the results are often inconsistent and depend on the operator and/or the time of analysis.
3.1 Smoothing for different heating rates
To compare data in the temperature domain acquired at different heating rates
(Fig. 1), there must be an equal basis for comparison. In a manner analogous to n-point
averaging, a possible basis of comparison might be to select an equal number of data points (NT) for each curve, as calculated from
I/H = G (Eq. 1).
G·S(T) = NT (Eq. 2).
where I is the fixed instrument sampling rate in points (pt)/min, H is the heating rate in °C/min, G is the experimental sampling rate in pt/°C, and S(T) is the smoothing interval
in the temperature domain in °C. On the basis of Eq. 2, the number of data points is equal for two different conditions (i, j) if
Gi·S(T)i = Gj·S(T)j = NT (Eq. 3)
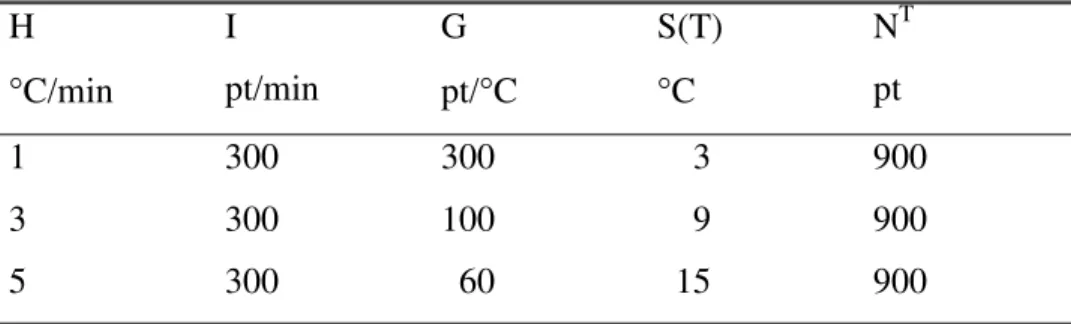
Table 1 shows the results obtained from the application of Eq. 3 on the three heating rates
illustrated in Figure 1. These results show that an increase in heating rate would require greater smoothing, which is contrary to experience.
The roughness of the curves in Fig. 1 suggest that less smoothing would be required with an increase in heating rate. The DSC curve obtained at the highest heating rate appears smoother because there are fewer data points. With the instrument sampling rate, I = 300 pt/min, Table 1 shows that the number of data points in the temperature domain (G) was 300, 100, and 60 after one minute at the respective rates of 1, 3 and 5°C/min.
To provide for a proper normalization of the data sets with the application of smoothing in accordance with the experiment, G must be divided by S such that
Gi/S(T)i = Gj/S(T)j = ν (Eq. 4)
where ν is the normalized number of data points per °C, with units of pt/°C2. With a substitution for G from Eq. 1, Eq. 4 is conveniently written in terms of heating rate as
Hi·S(T)i = Hj·S(T)j (units of °C2/min) (Eq. 5)
This equation can be used to calculate the smoothing factors for the proper comparison of data in the temperature domain and obtained at different heating rates (Table 2). Fig. 4 shows data acquired at different heating rates and plotted with equal smoothness based on Eq. 5.
3.2 Smoothing across the time and temperature domains
It is sometimes necessary to compare two DSC curves, one represented in the time domain and the other in the temperature domain. Most often the tendency is to use the same smoothing factor for each curve, but then the smoothness of the curves are such that the comparison of data is difficult, if not completely inadequate. To compare data from one heating rate across time and temperature domains, the number of data points in both domains must be equal, NT = Nt, or
G·S(T) = I·S(t) (Eq. 6)
With a substitution for G from Eq. 1, Eq. 6 can be written
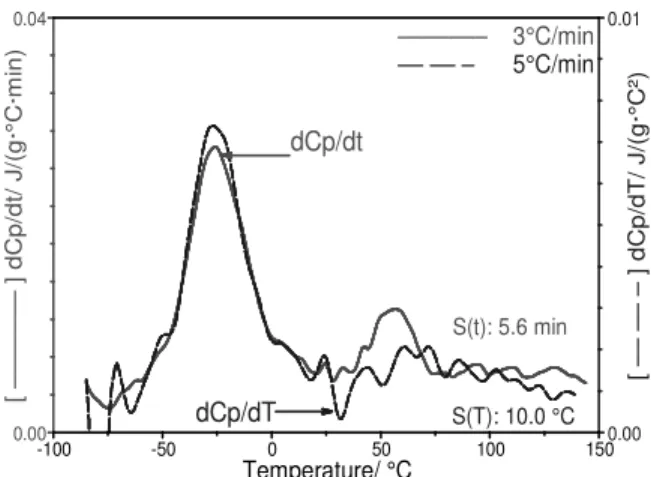
Eq. 7 allows for the selection of proper smoothing factors to compare data from a single heating rate across the time and temperature domains. The equation is most useful, however, for the comparison of time and temperature derivative curves from modulated DSC. For examples, Figure 5 shows dCp/dt and dCp/dT curves with respective S(t) and S(T) factors calculated based on Eq. 7.
To further compare data from different heating rates across the time and temperature domains, one smoothing factor in Eq. 5 is substituted for its equivalent in Eq. 7 to give
Hi·S(T)i = (Hj)2·S(t)j (Eq. 8)
Eq. 8 is most useful to compare dCp/dt and dCp/dT curves, but unlike Eq. 7, it allows for the comparison of data acquired at different heating rates (Figure 6).
3.3 Smoothing of derivative curves in the time domain
Given Eq. 5 for the temperature domain, one might assume that it could apply equally well to the time domain, but this is not the case. The substitution of the remaining S(T)i
in Eq. 8 for its equivalent in Eq. 7, leads to an equation expressed exclusively in the time domain
(Hi)2·S(t)i = (Hj)2·S(t)j (Eq. 9)
This equation is analogous to Eq. 5 except that the heating rates are squared. Although Eq. 9 may be used to compare in the time domain the total heating flow acquired at different heating rates, it is most useful to compare the dCp/dt derivatives of data acquired at different heating rates.
As shown above, there are four key equations to select appropriate smoothing factors. With the factors in Table 3, for instance, Eq. 5 and 9 are used to move vertically in the temperature and time domains, respectively. Equation 7 is used to move horizontally from S(T) to S(t) and vice-versa, whereas Eq. 8 is used to move diagonally from one column to the next.
4. Summary and Conclusion
DSC results acquired at different heating rates and represented in the time or the temperature domains are generally compared after a trial and error selection of smoothing factors. To circumvent the subjectivity of this process, four equations that relate the heating rate and the smoothing factor were developed. These equations allow an easy
conversion of the results from the temperature to the time domain, and vice-versa, and an equal basis to compare data acquired at different heating rates. They apply equally well to DSC and modulated DSC data, including dCp/dT and dCp/dt derivatives.
References
[1] T. Hatakeyama and Z. Liu (Eds), Handbook of Thermal Analysis, Wiley, New York, 1998.
[2] T. Hatekeyama, F. X. Quinn, Thermal Analysis: Fundamentals and Applications to Polymer Science, John Wiley & Sons, New York 1994.
[3] B. Wunderlich, Themal Analysis, Academic Press, Boston, 1990. [4] B. Wunderlich, Thermochim. Acta 355 (2000) 43.
[5] W. R. Longley, R. G. van Name, The Collected Works of J. Williard Gibbs, I, Thermodynamics, Yale University Press, New Haven, 1928.
[6] L. C. Thomas, Interpreting Unexpected Events and Transitions in DSC Results, Technical publication TA-039, TA Instruments.
[7] M. Reading, Trends Polym. Sci. 8 (1993) 248.
[8] J-F. Masson, G.M. Polomark, Thermochim. Acta 374 (2001) 105; J-F. Masson, G.M. Polomark, Thermochim. Acta 413 (2004) 273, Erratum.
[9] H. V. Malmstadt, C. G. Enke, S. R. Crouch, Microcomputers and Electronic Instrumentations: Making the Right Connections. American Chemical Society, Washington, D.C., 1994.
[10] P. G. Griffiths, J. A. de Haseth, Fourier Transform Infrared Spectrometry, John Wiley & Sons, New York, 1986.
[11] A. Savitsky and M. J. E. Golay, Anal. Chem. 36 (1964) 1627.
[12] G. B. Thomas, Calculus and Analytical Geometry, Addition-Wesley Publishing Company, Inc., London, 3rd ed., 1961.
Table 1. Calculation of the smoothing factor based on Eq. 3.
Table 2. Calculation of smoothing factors based on equations 4 and 5. Table 3. Representative sets of smoothing factors for various heating rates.
Fig. 1. Unsmoothed heating flows from DSC experiments at 1, 3, and 5 °C/min.
Fig. 2. Unsmoothed heating capacity and its derivative from a modulated DSC
experiment at 1°C/min, a modulation of ±0.16°C and a period of 60 s.
Fig.3. Unsmoothed heating flows in the time domain after acquisitions at 1, 3, and 5
°C/min.
Fig.4. Heating flows in the temperature domain. The smoothing factors were calculated
based on Eq. 5.
Fig. 5. Time and temperature derivatives of the heating capacity acquired at 5°C/min.
The smoothing factors were calculated with Eq. 7.
Fig. 6. Time and temperature derivatives of heat capacity acquired at 3°C/min and
Table 1. Calculation of the smoothing factor based on equation 3. H I G S(T) NT °C/min pt/min pt/°C °C pt 1 300 300 3 900 3 300 100 9 900 5 300 60 15 900
Table 2. Calculation of smoothing factors based on equations 4 and 5.
H G S(T) ν
°C/min pt/°C °C pt/°C2
1 300 5.0 60
3 100 1.6 60
5 60 1.0 60
Table 3. A set of smoothing factors for various heating rates.
H S(T) S(t) °C/min °C min 1 10 10 2 5 2.5 3 3.3 1.1 4 2.5 0.7 5 2 0.4
1°C/min 3°C/min 5°C/min 0.00 0.08 H e a t Fl ow / W/ g -100 -50 0 50 100 150 Temperature/ °C
Fig. 1. Unsmoothed heating flows from DSC experiments at 1, 3, and 5 °C/min.
Cp 0.0 0.1 [ ] dC p/ dT / J /( g ·° C ²) –– – – – 0 2 [ ] C p / J /( g ·° C ) –––––– – -100 -50 0 50 100 150 Temperature/ °C
Fig. 2. Unsmoothed heating capacity and its derivative from a modulated DSC
experiment at 1°C/min, a modulation of ±0.16°C and a period of 60 s.
1°C/min 3°C/min 5°C/min 0.00 0.08 H e a t Fl ow / W/ g 0 50 100 150 200 Time/ min
Fig.3. Unsmoothed heating flows in the time domain after acquisitions at 1, 3, and 5
1 5.0 3 1.6 5 1.0 H/ °C/min S(T)/ °C 0.00 0.08 H e a t Fl ow / W/ g -100 -50 0 50 100 150 Temperature/ °C
Fig.4. Heating flows in the temperature domain. The smoothing factors were calculated
based on Eq. 5. S(t): 2.0 min dCp/dt S(T): 10.0°C dCp/dT 0.00 0.01 [ ] dC p/ dT / J /( g ·° C ²) –– – – – 0.00 0.05 [ ] d C p /d t/ J /(g ·° C·m in ) ––– –––– -100 -50 0 50 100 150 Temperature/ °C
Fig. 5. Time and temperature derivatives of the heating capacity acquired at 5°C/min.
S(t): 5.6 min dCp/dt S(T): 10.0 °C dCp/dT 0.00 0.01 [ ] dC p/ dT / J /( g ·° C ²) –– – – – 0.00 0.04 [ ] d C p /d t/ J /(g ·° C·m in ) ––– –––– -100 -50 0 50 100 150 Temperature/ °C 3°C/min ––––––– 5°C/min –– –– –
Fig. 6. Time and temperature derivatives of heat capacity acquired at 3°C/min and