Publisher’s version / Version de l'éditeur:
Vous avez des questions? Nous pouvons vous aider. Pour communiquer directement avec un auteur, consultez la première page de la revue dans laquelle son article a été publié afin de trouver ses coordonnées. Si vous n’arrivez pas à les repérer, communiquez avec nous à PublicationsArchive-ArchivesPublications@nrc-cnrc.gc.ca.
Questions? Contact the NRC Publications Archive team at
PublicationsArchive-ArchivesPublications@nrc-cnrc.gc.ca. If you wish to email the authors directly, please see the first page of the publication for their contact information.
https://publications-cnrc.canada.ca/fra/droits
L’accès à ce site Web et l’utilisation de son contenu sont assujettis aux conditions présentées dans le site LISEZ CES CONDITIONS ATTENTIVEMENT AVANT D’UTILISER CE SITE WEB.
BMC Plant Biology, 13, 1, 2013-10-29
READ THESE TERMS AND CONDITIONS CAREFULLY BEFORE USING THIS WEBSITE.
https://nrc-publications.canada.ca/eng/copyright
NRC Publications Archive Record / Notice des Archives des publications du CNRC :
https://nrc-publications.canada.ca/eng/view/object/?id=4150d6a3-a62c-4b5d-b057-5d92d58d1be1
https://publications-cnrc.canada.ca/fra/voir/objet/?id=4150d6a3-a62c-4b5d-b057-5d92d58d1be1
This publication could be one of several versions: author’s original, accepted manuscript or the publisher’s version. / La version de cette publication peut être l’une des suivantes : la version prépublication de l’auteur, la version acceptée du manuscrit ou la version de l’éditeur.For the publisher’s version, please access the DOI link below./ Pour consulter la version de l’éditeur, utilisez le lien DOI ci-dessous.
https://doi.org/10.1186/1471-2229-13-170
Access and use of this website and the material on it are subject to the Terms and Conditions set forth at
High-level expression of sugar inducible gene2 (HSI2) is a negative
regulator of drought stress tolerance in Arabidopsis
R E S E A R C H A R T I C L E
Open Access
High-level expression of sugar inducible gene2
(HSI2) is a negative regulator of drought stress
tolerance in Arabidopsis
Nirmala Sharma, Yarnel Bender, Kerry Boyle and Pierre R Fobert
*Abstract
Background: HIGH-LEVEL EXPRESSION OF SUGAR INDUCIBLE GENE2 (HSI2), also known as VAL1, is a B3 domain transcriptional repressor that acts redundantly with its closest relative, HSI2-LIKE1 (HSL1), to suppress the seed maturation program following germination. Mutant hsi2 hsl1 seedlings are arrested early in development and differentially express a number of abiotic stress-related genes. To test the potential requirement for HSI2 during abiotic stress, hsi2 single mutants and plants overexpressing HSI2 were subjected to simulated drought stress by withholding watering, and characterized through physiological, metabolic and gene expression studies.
Results: The hsi2 mutants demonstrated reduced wilting and maintained higher relative water content than wild-type after withholding watering, while the overexpressing lines displayed the opposite phenotype. The hsi2 mutant displayed lower constitutive and ABA-induced stomatal conductance than wild-type and accumulated lower levels of ABA metabolites and several osmolytes and osmoprotectants following water withdrawal. Microarray comparisons between wild-type and the hsi2 mutant revealed that steady-state levels of numerous stress-induced genes were up-regulated in the mutant in the absence of stress but down-regulated at visible wilting. Plants with altered levels of HSI2 responded to exogenous application of ABA and a long-lived ABA analog, but the hsi2 mutant did not show altered expression of several ABA-responsive or ABA signalling genes 4 hr after application.
Conclusions: These results implicate HSI2 as a negative regulator of drought stress response in Arabidopsis, acting, at least in part, by regulating transpirational water loss. Metabolic and global transcript profiling comparisons of the hsi2 mutant and wild-type plants do not support a model whereby the greater drought tolerance observed in the hsi2 mutant is conferred by the accumulation of known osmolytes and osmoprotectants. Instead, data are consistent with mutants experiencing a relatively milder dehydration stress following water withdrawal. Keywords: Abiotic stress, Abscisic acid, Gene expression, Microarray, Transcriptome, Water stress Background
Water deficit is a major environmental factor limiting plant fitness and productivity [1]. With patterns of global climate change likely to increase the severity of drought stresses in the future [2], the development of crop plants better adapted to water-limited environments is a prior-ity for sustainable agriculture.
Plants have evolved unique mechanisms to monitor water availability in their environment and adapt to it [3,4]. In response to mild water deficits, low cellular water
potential can be avoided by balancing water uptake and loss through stomatal closure, increased cuticle thickness and enhanced root growth. Should these adaptations be insufficient to restore physiological water potential within the cell, more dramatic measures may be deployed. These are generally distinguished as dehydration avoidance, de-hydration tolerance and drought escape [3], although all three responses are highly integrated [5]. A key aspect of dehydration avoidance is the accumulation of compatible solutes (osmolytes), including sugars, sugar alcohols, amino acids and organic acids, that increase cellular os-motic potential, prevent water loss and maintain turgor [6]. Dehydration tolerance consists of measures to protect cell constituents from damage and entails the production
* Correspondence:Pierre.Fobert@nrc-cnrc.gc.ca
National Research Council Canada, 110 Gymnasium Place, Saskatoon, SK S7N 0W9, Canada
© 2013 Crown copyright; licensee BioMed Central Ltd. This is an open access article distributed under the terms of the Creative Commons Attribution License (http://creativecommons.org/licenses/by/2.0), which permits unrestricted use, distribution, and reproduction in any medium, provided the original work is properly cited.
of antioxidants and chaperones, such as dehydrins and late-embryogenesis abundant (LEA) proteins [7].
The plant hormone abscisic acid (ABA) plays a pivotal role in coordinating multiple aspects of adaptation to drought stress [8]. Stomatal closure, the accumula-tion of osmolytes and the synthesis of protective pro-teins are all correlated with drought-induced increases in endogenous ABA levels. Mutants defective in ABA synthesis or perception are more susceptible to drought, while treatment with exogenous ABA enhances drought tolerance and induces the expression of numerous dehydration-stress responsive genes and proteins. How-ever, several dehydration stress-induced genes do not respond to exogenous application of ABA in Arabidop-sis thaliana (L.) [9,10], suggesting the existence of both ABA-dependent and -independent signal trans-duction pathways.
Physiological and biochemical aspects of drought adaptation are underpinned by extensive transcriptional re-programming [9]. Drought-induced transcriptomes from several plant species have been reported (reviewed in [11]) and reveal profound changes in numerous pro-cesses, including growth, amino acid and carbohydrate metabolism, photosynthesis, protection against oxida-tive stress, phosphorylation, membrane transport, se-cretion, cell wall expansion, and hormone homeostasis [10,12-15]. Functional characterization efforts have identified the role of a number of drought-induced transcripts, including many transcription factors, in driving adaptive responses [10,16-18]. Differential gene expression in response to abiotic stress is likely associ-ated with changes in chromatin conformation, such as those mediated by histone tail modifications and chro-matin remodeling complexes [19,20]. Identification and characterization of the factors and mechanisms in-volved is only now being elucidated and an active area of research.
One group of proteins that may be implicated in regu-lating plant chromatin conformation is the HIGH-LEVEL EXPRESSION OF SUGAR-INDUCIBLE GENE2 (HSI2) clade of B3 domain proteins. The B3 domain is a plant-specific basic DNA-binding domain originally identified as the third and C-terminus proximal basic domain of the transcription factor ABSICIC ACID IN-SENSITIVE3 (ABI3) (reviewed in [21]). There are three members of the HSI2 clade in Arabidopsis; HSI2, also known as the VIVIPAROUS ABI3-LIKE1 (VAL1), HSI2-LIKE1 (HSL1, also known as VAL2) and HSI2-LIKE2 (HSL2, also known as VAL3) [22-24]. Additional features shared by HSI2 clade proteins include the CW domain and EAR motif. HSI2 and HSL1 also contain a putative plant homeodomain (PHD)-like zinc finger domain absent from HSL2. The CW and PHD-like domains are associated with chromatin remodelling factors, while
the EAR motif is a transcriptional repression domain. Functional analysis of HSI2 has demonstrated that the protein is a potent EAR-dependent transcriptional repressor [23] and can repress ABI3-mediated transacti-vation from the Sph/RY element, the cognate DNA binding site of B3 domain factors [25]. Loss-of-function mutations in HSI2 result in the expression of seed storage proteins in vegetative tissues [23,24]. The deregulation of embryonic and seed maturation programs in vegetative tissues is more dramatic in hsi2 hsl1 (val1 val2) double mutants, which produce callus and ectopic embryo-like structures when seedlings are cultured in the presence of sucrose. Among genes highly expressed in the double mu-tant seedlings are ABI3, FUSCA3 (FUS3) and LEAFY COTYLEDON2 (LEC2), which encode key regulators of seed maturation and constitute the AFL (ABI3/FUS3/ LEC2) clade of B3 domain proteins. It has been proposed that HSI2 clade proteins suppress the seed maturation program following germination by repressing the tran-scription of AFL clade genes and/or competing with the encoded transcription factors for Sph/RY sites in the pro-moter of target genes [22,24,25].
The recent analysis of the hsi2-4 allele, which creates a cysteine to tyrosine substitution in the PHD domain, vealed a potential role for this HSI2 domain in the re-pression of a subset of seed-specific genes during seedling development and in the deposition of the re-pressive chromatin mark H3K27m3 on target genes [26]. Interestingly, hsi2-4 hsl double mutants were morpho-logically normal, indicating a unique function for the HSI2 PHD domain.
Molecular genetic analysis of the HSI2 clade has fo-cused on hsi2 hsl1 double mutants at the seedling stage. The potential role of these factors at other times in the plant life cycle remains largely unexplored, despite the fact that HSI2 and HSL1 are expressed in many tissues [23]. A cursory analysis of gene ontology (GO) annota-tion terms enriched in the list of genes differentially expressed in hsi2 and hsi2 hsl1 mutants [24,26] identi-fied response to abiotic stimulus as highly significant (data not shown). This prompted us to test whether HSI2 might regulate drought tolerance during the vege-tative stage of the plant life cycle. Through loss- and gain-of-function analyses, HSI2 is shown to act as a negative regulator of drought tolerance in Arabidopsis, possibly through a mechanism involving reduced tran-spirational water loss.
Results
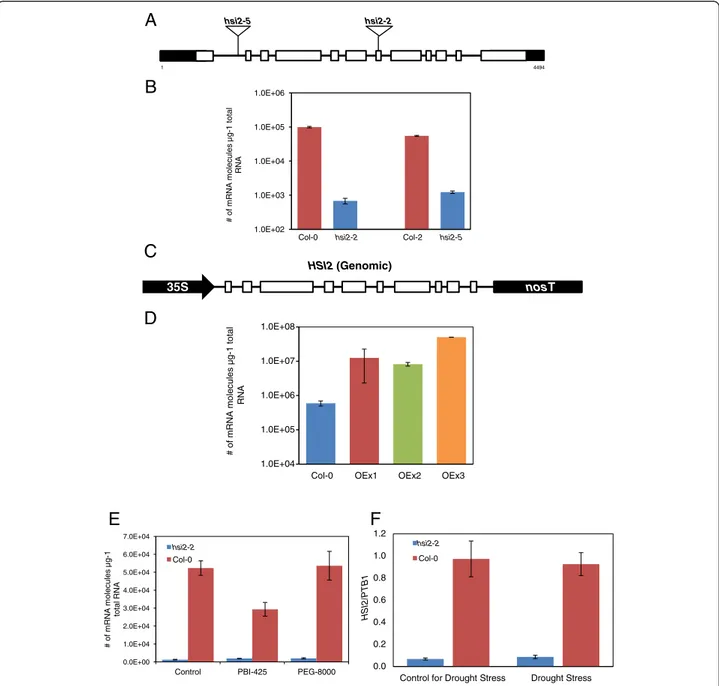
To investigate the role of HSI2 in modulating drought responses, the levels and/or integrity of the gene were stably altered in transgenic Arabidopsis plants. For loss-of-function analysis, two T-DNA insertion alleles were identified (Figure 1A). Both mutant alleles show
minimal expression of HSI2 when compared to corre-sponding wild-types, Col-0 for hsi2-2 and Col-2 for hsi2-5 (Figure 1B). For gain-of-function analysis, the HSI2 coding region was placed under the control of the Cauliflower
mosaic virus 35S promoter (35S:HSI2) and used to gener-ate transgenic plants in Col-0 (Figure 1C). Three inde-pendent lines showing increased levels of HSI2 transcripts (Figure 1D, OEx lines) were further studied.
A
B
C
D
1.0E+02 1.0E+03 1.0E+04 1.0E+05 1.0E+06 # of m R N A m o lecules µ g -1 to ta l RNACol-0 hsi2-2 Col-2 hsi2-5
0.0E+00 1.0E+04 2.0E+04 3.0E+04 4.0E+04 5.0E+04 6.0E+04 7.0E+04
Control PBI-425 PEG-8000
# of m R NA m o lec u les µ g -1 to ta l R N A hsi2-2 Col-0
E
F
0.0 0.2 0.4 0.6 0.8 1.0 1.2Control for Drought Stress Drought Stress
HSI2/PTB1 Col-0 hsi2-2 hsi2-2 hsi2-5 1 4494 35S nosT HSI2(Genomic) 1.0E+04 1.0E+05 1.0E+06 1.0E+07 1.0E+08
Col-0 OEx1 OEx2 OEx3
#
of mRNA mo
lecules µg-1 total
RN
A
Figure 1 HSI2 insertional mutants and overexpressing lines. (A) Diagram of the structure of the HSI2 gene (At2g30470) showing the position of T-DNA insertions (triangles). Open boxes indicate exons, while black boxes indicate untranslated regions. The transcriptional start site is indicated by the number 1. With the exception of T-DNA sizes, the diagram is drawn to scale. (B) Kinetic RT-PCR analysis of HSI2 mRNA
abundance in the mutants and corresponding wild-types (hsi2-2/Col-0 and hsi2-5/Col-2). (C) Diagram of the structure of the HSI2 transgene. Open boxes indicate exons; 35S, Cauliflower mosaic virus 35S promoter; nosT, terminator region from the Agrobacterium tumefaciens nopaline synthase gene. (D) Kinetic RT-PCR analysis of HSI2 mRNA abundance in transgenic plants and untransformed Col-0. (E) Kinetic RT-PCR analysis of HSI2 mRNA abundance in 14 day old seedlings of hsi2-2 and Col-0, 4 h following treatment with 25 μM PBI425 or 20% PEG 8000. (F) Kinetic RT-PCR analysis of HSI2 mRNA abundance in 3-week-old leaves of hsi2-2 and Col-0 grown in soil saturated to field capacity or following watering withdrawal and development of visible wilting symptoms. For (F), amplification of the housekeeping gene encoding polypyrimidine tract-binding protein1 (PTB1, AT3G01150) was used as control to normalize expression data. All values represent the averages of three biological replicates, each analyzed three times (technical replicates) ± standard error.
Disruption of HSI2 by T-DNA insertions confers better drought tolerance
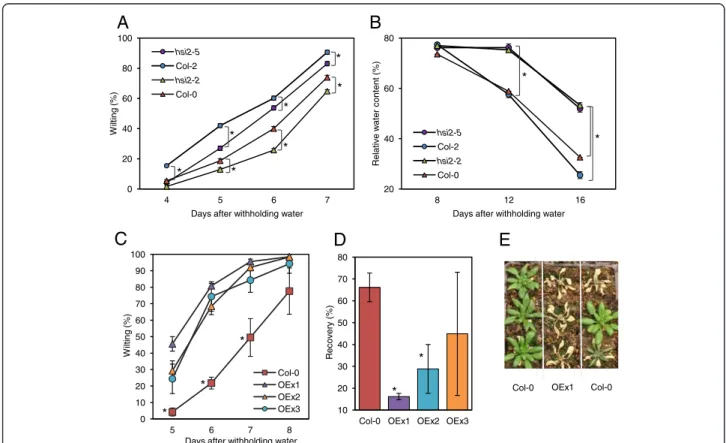
The response of hsi2 mutants to drought was exam-ined by subjecting plants to a simulated drought stress regime in environmentally controlled growth cham-bers. To minimize sources of variation attributed to the amount, and the initial moisture content, of the soil in pots, wild-type and corresponding mutant plants were grown side-by-side in the same containers. Both hsi2 mutants displayed reduced rates of wilting after withholding water, by as much as 9%, compared to their wild-type counterparts (Figure 2A). The hsi2 mutants also maintained higher cellular water levels, by as much as 30%, measured as leaf relative water content (RWC; Figure 2B). Additional experiments using different pot sizes and potting mixes yielded similar findings (data not shown). These results indi-cate that hsi2 mutants have increased tolerance to drought, due at least in part to a reduced rate of water loss from leaves.
HSI2overexpression enhances drought sensitivity
The three independent OEx lines evaluated showed an early onset and greater severity of visual wilting, and poorer recovery from a drought stress compared to un-transformed controls (Figure 2C-E). Differences in visible wilting were most pronounced at 6 and 7 days after with-holding water, with OEx lines displaying between 48-60% and 35-45% higher wilting rates, respectively (Figure 2C). When plants were re-watered at the end of the drought period and allowed to recover for 24 h, 66% of the wild-type plants recovered compared to 16, 24, and 44% in the OEx lines (Figure 2D, 2E). Together with data obtained from loss-of-function mutants, the results implicate HSI2 as a negative regulator of drought tolerance.
HSI2altered plants respond to an exogenously applied ABA
To study the possible interaction between HSI2 and ABA during drought stress, we assessed the drought response of the hsi2-2 mutant and line OEx1 pre-treated with
0 10 20 30 40 50 60 70 80 90 100 5 6 7 8 W ilt ing (% )
Days after withholding water Col-0 OEx1 OEx2 OEx3 10 20 30 40 50 60 70 80
Col-0 OEx1 OEx2 OEx3
Rec o very (% ) 0 20 40 60 80 100 4 5 6 7 Wi lt in g ( % )
Days after withholding water
hsi2-5 Col-2 hsi2-2 Col-0 20 40 60 80 8 12 16 Relat ive w at er c ont ent (% )
Days after withholding water
hsi2-5 Col-2 hsi2-2 Col-0
A
B
C
D
E
Col-0 OEx1 Col-0
* * * * * * * * * * * * * *
Figure 2 Response of hsi2 mutants and 35S:HSI2 overexpressing lines to simulated drought stress. (A) Wilting rates of hsi2 mutants and corresponding wild-types. (B) Leaf relative water content of the hsi2 mutants and corresponding wild-types. (C) Rate of wilting of three independent
35S:HSI2 lines and untransformed wild-type (Col-0). (D) Recovery from drought 24 h upon re-watering. (E) A representative photograph showing
the recovery phenotype of Col-0 and 35S:HSI2 line OEx1. For (A) and (B), the hsi2-2 mutant compares with Col-0 and hsi2-5 compares with Col-2; each wild-type and mutant combination were planted in the same sets of containers. Statistical significance, indicated by an asterisk(*), was determined by a paired Student’s t-test (p ≤ 0.05). Data are presented as means of three replicates containing 12 plants each ± standard error of means. In some cases where the standard errors are very small, the graph symbols may obscure the bars. Experiments were repeated at least three times with similar results.
(+)-ABA and (+)-8’-acetylene ABA, also known as PBI425 [27]. This synthetic analog is resistant to 8’hydroxylation, the principal ABA catabolic pathway in Arabidopsis [12,28]. Consequently, PBI425 is more persistent in planta and has stronger hormonal activity [29,30]. The ability of PBI425 to enhance drought tolerance in Arabidopsis has been shown to be mediated through ABA signalling [29]. Whether PBI425 and ABA act through the same signaling pathway can be tested by binding to the family of PYL re-ceptors. Nevertheless, available information indicate that PBI425 offers several advantages over natural ABA when the sustained presence of hormonal activity is required, as is the case in this study.
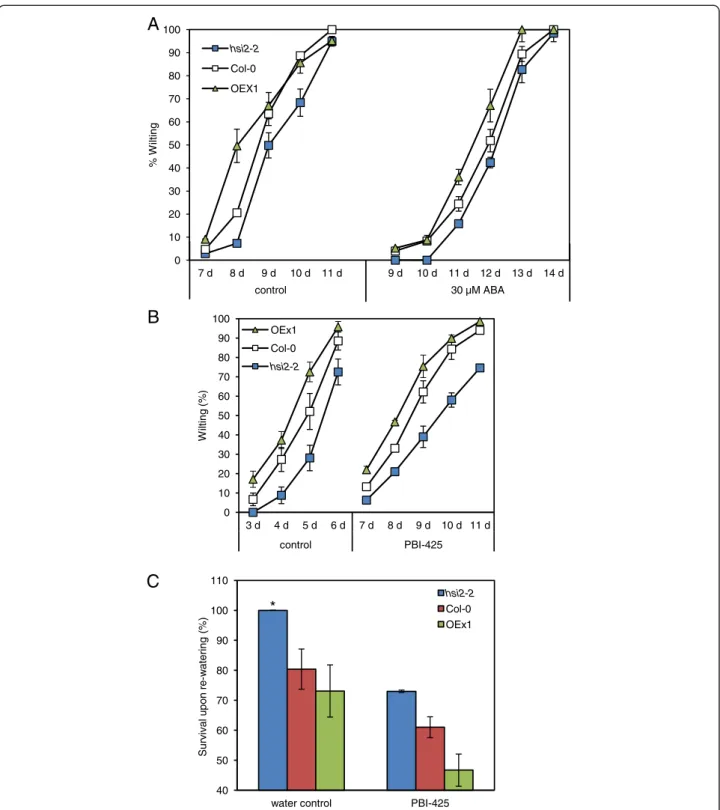
In control treatments where plants were root-drenched with water prior to water withdrawal, hsi2-2 plants dis-played less wilting, and OEx1 plants more wilting, than the wild-type at all observation times (Figure 3A and 3B). When plants were given a root-drench treatment with ABA (30 μM) or PBI425 (20 μM) before withholding water, the onset of visible wilting was delayed in all geno-types by three to four days (until 7 – 10 days after treat-ment), after which the mutant continued to display less wilting, and OEx1 more wilting, than the wild-type at all observation times (Figure 3A and 3B). Recovery from wilt-ing upon re-waterwilt-ing was evaluated under control and ABA analog treatments, where the hsi2-2 mutant recov-ered the best upon re-watering, followed by the wild-type and OEx1 plants (Figure 3C). However, the overall recov-ery upon re-watering was lower in all genotypes pre-treated with PBI425.
Hsi2-2mutants display lower stomatal conductance
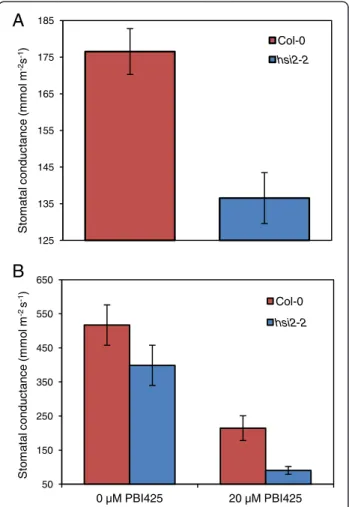
Lower stomatal conductance has been associated with higher drought tolerance in many plant species includ-ing Arabidopsis [31,32]. Accordinclud-ingly, stomatal conduct-ance was measured to investigate possible mechanisms underpinning the increased drought tolerance in the hsi2 mutant. Leaf stomatal conductance in well-watered hsi2-2 plants was 77% of wild-type values (Figure 4A), suggesting lower constitutive stomatal conductance. Pre-treatment with PBI425 resulted in a 2.4-fold reduction in stomatal conductance in the wild-type and a 4.4-fold reduction in hsi2-2 (Figure 4B), with the hsi2-2 mutant displaying 42% of wild-type stomatal conductance fol-lowing ptreatment with PBI425 (Figure 4B). These re-sults suggest that the mutant is able to better maintain water status through regulation of stomatal properties and that loss of HSI2 does not substantially affect associ-ated ABA signaling.
The hsi2-2 mutant accumulates less ABA metabolites during drought stress
To examine the involvement of HSI2 in ABA metabolism during the drought response, levels of endogenous ABA
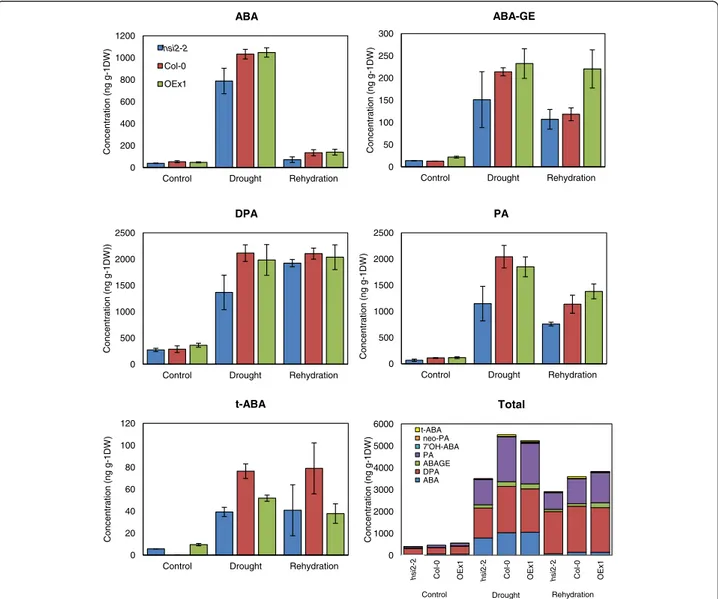
and its metabolites were measured in leaves of hsi2-2, OEx1, and Col-0 before drought stress, at visible wilting, and upon rehydration. In the absence of drought, levels of all metabolites were similar in the three genotypes (Figure 5). Endogenous ABA content increased dramatic-ally under drought stress in all three genotypes, and reverted to near pre-stress levels upon re-watering. How-ever, hsi2-2 accumulated relatively lower levels of ABA dur-ing drought and was better able to recover to original levels after re-watering compared to OEx1 or Col-0. Levels of ABA metabolites, namely ABA-glucose ester (ABA-GE), dihydrophaseic acid (DPA), phaseic acid (PA), and trans-ABA (t-trans-ABA) also increased substantially under drought stress in all genotypes (Figure 5). The hsi2-2 mutant accu-mulated less of these metabolites than Col-0, while OEx1 contained levels comparable to Col-0, with the exception of t-ABA, which was lower in 35S:HSI2. Consistent with the reports that the 8’-hydroxylation pathway is the most important ABA catabolic pathway in Arabidopsis [12,28], the products of this pathway (PA and DPA), were the most abundant during drought stress and after rehydration (Figure 5). Unlike ABA, the levels of most metabolites remained much higher after rehydration than they were pre-drought, with DPA levels remaining as high as during drought stress. These results indicate that drought-induced ABA biosynthesis and catabolism is of smaller amplitude in the mutant line, resulting in a more modest increase in both ABA and ABA metabolites, while rehydration re-versed the effect of drought on ABA biosynthesis but not ABA catabolism.
The hsi2-2 mutant accumulates lower levels of stress-induced metabolites during drought stress
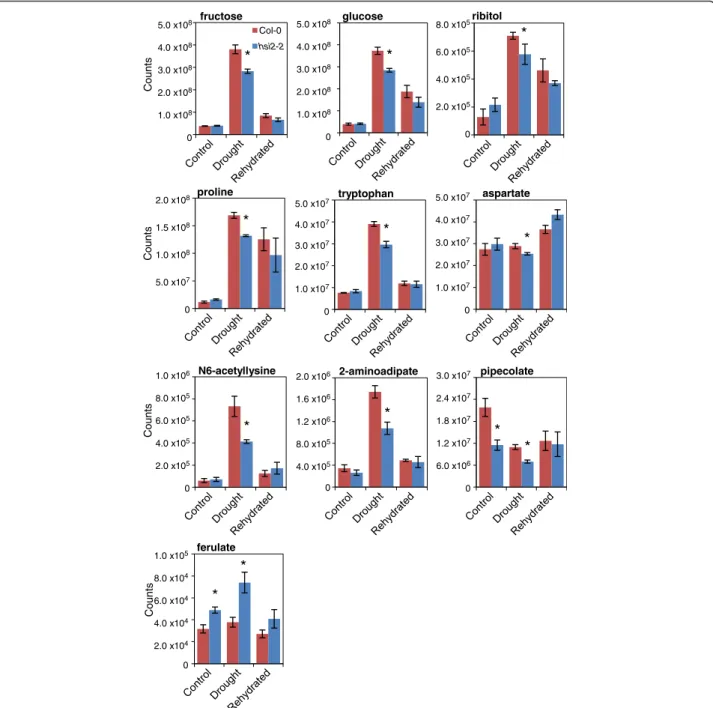
To ascertain the role of HSI2 during stress-induced meta-bolic reprogramming, levels of several compounds were measured by undirected metabolic profiling and compared between hsi2-2 and Col-0 before drought stress, at visible wilting, and upon rehydration. Overall, drought treatment increased levels of numerous metabolites previously re-ported to be drought-inducible [33], including soluble sugars, sugar alcohols, amino acids, organic acids and anti-oxidants (Figure 6; Additional file 1). Levels of several me-tabolites were also depleted under drought conditions. With some exceptions, most metabolites reverted closer to non-stress levels upon rehydration.
Relatively few of the stress-regulated metabolites were found to accumulate differentially in the two genotypes tested (Figure 6; Additional file 1). These included sugars (fructose and glucose), amino acids (proline, tryptophan and aspartate), and the sugar alcohol ribitol, levels of which were lower in the mutant than the wild-type under drought stress. Similarly, the products of the lysine deg-radation pathway, N6-acetyllysine, 2-aminoadipate and pipecolate, which have been shown to accumulate under
0 10 20 30 40 50 60 70 80 90 100 3 d 4 d 5 d 6 d 7 d 8 d 9 d 10 d 11 d control PBI-425 W ilt ing (%) OEx1 Col-0 hsi2-2 40 50 60 70 80 90 100 110
water control PBI-425
S
u
rvival upon
re-w a te ring ( % ) hsi2-2 Col-0 OEx1
A
B
C
* 0 10 20 30 40 50 60 70 80 90 100 7 d 8 d 9 d 10 d 11 d 9 d 10 d 11 d 12 d 13 d 14 d % W ilting control 30 µM ABA hsi2-2 Col-0 OEX1Figure 3 Response of hsi2 mutants and 35S:HSI2 overexpressing lines to simulated drought stress. (A-B) Rate of wilting of wild-type (Col-0), mutant (hsi2-2), and 35S:HSI2 line (OEx1) treated with (+)-ABA (A) or the ABA analog PBI425 (B). (C) Recovery from drought upon re-watering (at 24 h after re-watering under control and PBI425 treatments). Three-week-old plants were root drenched with 0.05% ethanol as control treatment (left side), 30 μM ABA or 20 μM PBI425, dissolved in 0.05% ethanol (right side) to field capacity and watering was stopped thereafter. Data are presented as means of three replicates of 18 plants each ± standard error of means. In some cases where the standard errors are very small, the graph symbols may obscure the bars. These experiments were repeated at least twice with similar results.
osmotic stress in Brassica napus [34] and suggested to have osmoprotectant properties in bacteria (pipecolate [35]) were also lower in the mutant compared to wild-type under drought conditions. In contrast, hsi2-2 had signifi-cantly higher levels of ferulate, an intermediate of the phenylpropanoid pathway, before and during drought (Figure 6). Lower levels of known stress-induced osmo-lytes and osmoprotectants in the hsi2 mutant at wilting are consistent with plants experiencing relatively milder dehydration stress than the wild-type.
Analysis of drought transcriptomes indicates that drought-induced genes are down-regulated in the hsi2 mutant
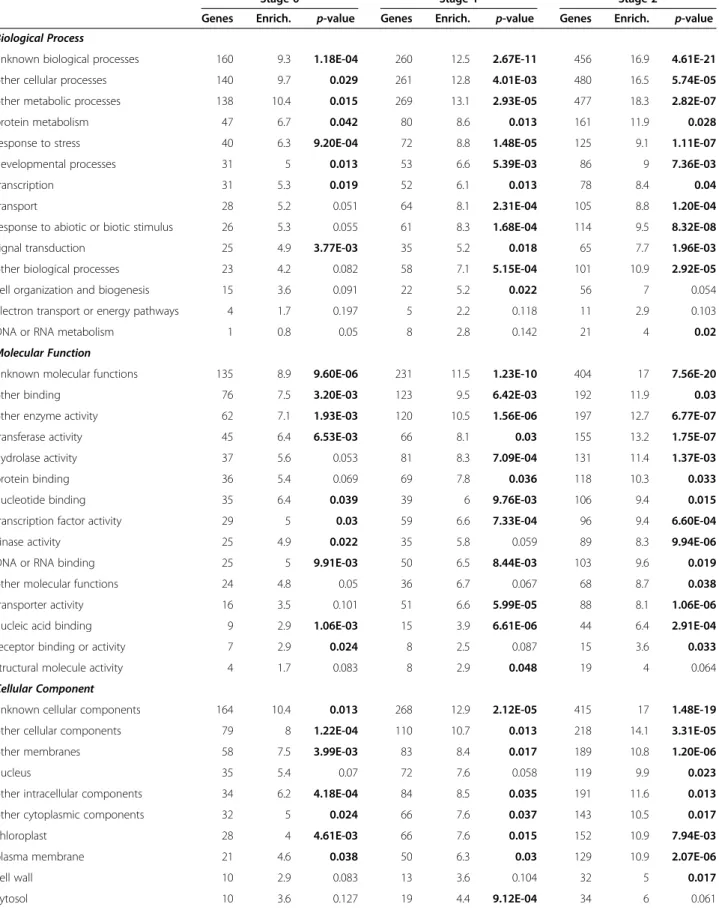
To characterize the consequences of loss of HSI2 function on gene expression relevant to drought stress, genome-wide expression analysis was undertaken with the hsi2-2 mutant under a normal watering regime (no stress; stage 0) and after withholding watering, before the onset of visible wilting (stage 1) and at visible wilting (stage 2). Gene ex-pression in the mutant was compared with its wild-type (Col-0) under each watering regime by co-hybridization using dual color microarrays. Genes corresponding to 441 unique AGIs were identified as being differentially expressed (p ≤ 0.05, 1.5-fold cut-off) at stage 0, and the numbers of differentially expressed unique AGIs increased with the severity of drought to 785 (stage 1) and 1400 (stage 2) (Additional files 2 and 3). Consistent with differences in drought responses observed between the mutant and wild-type (Figures 2, 3, 4), the most significant GO enriched terms for biological process identified in lists of differen-tially expressed genes were response to stress and response to biotic or abiotic stimulus (Table 1). The relative p-values for these terms decreased with the severity of the drought treatment. The identity of genes differentially regulated under the three watering regimes changed considerably. Of the 441 genes differentially expressed at stage 0, 335 (76%) are specific to this stage and only 48 genes were differen-tially regulated under all watering regimes. For representa-tive genes, microarray results were validated by kinetic reverse-transcriptase PCR (k-RT-PCR) (Figure 7).
Genes differentially expressed in the hsi2 mutant were compared with those regulated in response to drought stress. Given the poor overlap of genes reported as being differentially expressed during drought stress in different studies (see [11,12,36]), genes regulated by drought in our datasets were identified by comparing probe inten-sity values from individual channels between stage 2 and stage 0 in Col-0. The direction of change for these genes in our datasets was overwhelmingly the same as those from published studies employing whole genome micro-arrays and similar drought regimes (Additional file 3).
Genes found to be induced in response to drought stress in our dataset (>2.5-fold) were predominantly
down-regulated when differentially expressed in the hsi2 mutant (vs. Col-0) at stage 2 (>92%), while genes repressed by drought were mostly up-regulated (93%) when differen-tially expressed in the hsi2 mutant at this drought stage (Additional file 3). Similar patterns were observed when genes differentially expressed in hsi2 vs. Col-0 at stage 2 were compared to published lists of drought-regulated transcripts of Huang et al. [12] or the progressive drought (pDr) and ABA-induced genes of Harb et al. [14] (Additional file 3). Analysis of GO terms enriched in genes induced by drought and down-regulated in hsi2 vs. Col-0 at stage 2 identified predominantly drought-associated processes, including response to abiotic stimu-lus, ABA, and water deprivation (Table 2). These terms were not enriched in the gene list induced by drought and up-regulated in hsi2. 125 135 145 155 165 175 185 S tom at al c o nduc ta nc e ( m m o lm -2s -1) Col-0 hsi2-2
A
B
50 150 250 350 450 550 650 0 µM PBI425 20 µM PBI425 S tom at al c o nduc ta nc e (m m o l m -2s -1) Col-0 hsi2-2Figure 4 Stomatal conductance in the hsi2-2 mutant and corresponding wild-type (Col-0). Stomatal conductance was measured in fully developed young leaves (A) 1 d after watering or (B) 72 h after root drench treatment with 0 or 20 μM PBI425 (in 0.05% ethanol). Data presented as means of three replicates ± standard error of means, each containing 4–6 plants and measurements from two leaves per plant. The experiments were repeated twice with similar results.
Comparisons of gene lists differentially expressed in hsi2 vs. Col-0 at stage 2 to lists from Wilkins et al. [36] or the moderate drought (mDr) treatments of Harb et al. [14] failed to identify a clear trend between the direction of change in hsi2 vs. Col-0 relative to drought inducibility/repression (Additional file 3). However, drought-induced genes from these moderate drought treatments, the pDr of Harb et al. [14], and the present study were predominantly up-regulated when differen-tially expressed in hsi2 vs. Col-0 at stage 1, reaching over 80% for genes induced in mDr1 and mDr10 of Harb et al. [14] and up-regulated in hsi2 vs. Col-0 at stage 1
(Additional file 3). Genes repressed by drought or ABA did not show the complimentary trend and no clear trends were identified in the stage 0 data. Notable GO terms enriched in drought-regulated genes differentially expressed in hsi2 vs. Col-0 at stage 0 or stage 1 include response to abiotic, temperature and chemical stimuli, and oxidoreductase activity (Table 2). Taken together, these results indicate that the hsi2 mutant constitutively expresses a number of drought- and ABA-responsive genes but under wilting conditions, the induction or re-pression of drought- and ABA-regulated genes is attenu-ated relative to the wild-type.
0 20 40 60 80 100 120
Control Drought Rehydration
Conc ent rat ion (ng g -1 DW ) t-ABA 0 500 1000 1500 2000 2500
Control Drought Rehydration
Conc ent rat ion (ng g -1DW ) PA 0 500 1000 1500 2000 2500
Control Drought Rehydration
Conc ent rat ion (ng g -1 DW )) DPA 0 50 100 150 200 250 300
Control Drought Rehydration
Conc ent rat ion (ng g -1DW ) ABA-GE 0 1000 2000 3000 4000 5000 6000 Col -0 OEx 1 Col-0 OEx 1 Col -0 OEx 1 Conc ent rat ion (ng g -1DW ) t-ABAneo-PA 7'OH-ABA PA ABAGE DPA ABA
Control Drought Rehydration
h si2 -2 hsi2-2 0 200 400 600 800 1000 1200
Control Drought Rehydration
Conc ent rat ion (ng g -1 DW ) ABA Col-0 hsi2-2 OEx1 Total hsi2 -2
Figure 5 Levels of ABA and its metabolites in leaves of HSI2 altered Arabidopsis plants. Levels were quantified by UPLC-ESI-MS/MS using deuterium-labeled internal standards. Each sample consisted of a pool of 6 plants grown under well-watered (to near field capacity) or drought-stressed (visible wilting) conditions, and 24 h after re-watering to soil saturation following drought stress. Values represent averages of three bio-logical replicates ± standard error of means. No error bars are provided in the Total ABA panel. DPA, dihydrophaseic acid; ABAGE, ABA glucose ester; 7’-OH ABA; PA, phaseic acid; t-ABA, trans-ABA, OEx1, 35S:HSI2 line.
Accumulation of ABA-responsive transcripts in response to the ABA analog PBI425 is not compromised in the hsi2 mutant
To ascertain the possible involvement of HSI2 during the early responses to ABA and osmotic stress, RNA was ex-tracted from two-week-old seedlings of Col-0 and hsi2-2, 4 h after treatment with PBI425 or PEG 8000, and the ex-pression of selected genes was analyzed by k-RT-PCR.
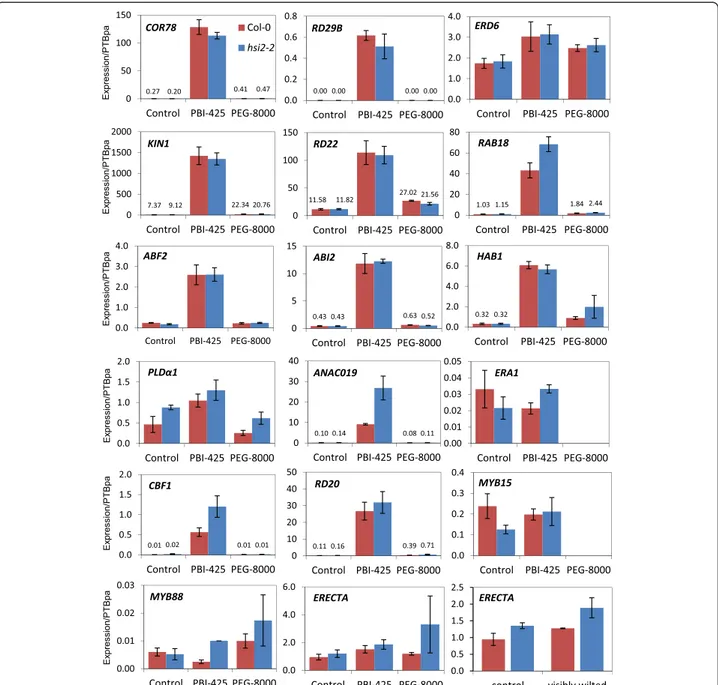
Steady-state mRNA levels of five well-known ABA re-sponsive marker genes (COR78/RD29A, RD29B, ERD6, KIN1, and RD22 [14,15]) continued to show wild-type in-duction to PBI425 and PEG 8000 in the hsi2-2 mutant, while RAB18 mRNA levels were higher in hsi2 than Col-0 following exposure to the ABA analog (Figure 8).
Of 6 genes tested that have been implicated in ABA sig-naling, mRNA levels for three (ABF2, ABI2 and HAB1)
0.E+00 1.E+07 2.E+07 3.E+07 4.E+07 5.E+07 aspartate 5.0 x10⁷ 4.0 x10⁷ 3.0 x10⁷ 2.0 x10⁷ 1.0 x10⁷ 0
*
*
*
ferulate 1.0 x10⁵ 8.0 x10⁴ 6.0 x10⁴ 4.0 x10⁴ 2.0 x10⁴ 0*
0.0E+00 1.0E+07 2.0E+07 3.0E+07 4.0E+07 5.0E+075.0 x10⁷ tryptophan 4.0 x10⁷ 3.0 x10⁷ 2.0 x10⁷ 1.0 x10⁷ 0*
0.0E+00 5.0E+07 1.0E+08 1.5E+08 2.0E+082.0 x10⁸ proline 1.5 x10⁸ 1.0 x10⁸ 5.0 x10⁷ 0*
2-aminoadipate 2.0 x10⁶ 1.6 x10⁶ 1.2 x10⁶ 8.0 x10⁵ 4.0 x10⁵ 0*
0.00E+00 1.00E+08 2.00E+08 3.00E+08 4.00E+08 5.00E+085.0 x10⁸ glucose 4.0 x10⁸ 3.0 x10⁸ 2.0 x10⁸ 1.0 x10⁸ 0*
0.0E+00 1.0E+08 2.0E+08 3.0E+08 4.0E+08 5.0E+08 fructose Col-0 hsi2-2 5.0 x10⁸ 4.0 x10⁸ 3.0 x10⁸ 2.0 x10⁸ 1.0 x10⁸ 0 0.0E+00 2.0E+05 4.0E+05 6.0E+05 8.0E+058.0 x10⁵ribitol 6.0 x10⁵ 4.0 x10⁵ 2.0 x10⁵ 0*
Count s Count s*
*
0.0E+00 6.0E+06 1.2E+07 1.8E+07 2.4E+07 3.0E+073.0 x10⁷ pipecolate 2.4 x10⁷ 1.8 x10⁷ 1.2 x10⁷ 6.0 x10⁶ 0 Count s*
N6-acetyllysine 1.0 x10⁶ 8.0 x10⁵ 6.0 x10⁵ 4.0 x10⁵ 2.0 x10⁵ 0 Count sFigure 6 Drought-related levels of selected metabolites showing significant changes in leaves of the hsi2-2 mutant. Each sample consisted of a minimum of 6 plants grown under well-watered (to near field capacity) or drought-stressed (visible wilting) conditions, and 24 h after re-watering to soil saturation following drought stress. Values represent averages of three biological replicates ± standard error. Treatments statistically different by ANOVA (p ≤ 0.05) are marked by asterisks.
Table 1 Gene Ontology classification terms enriched in the hsi2-2 mutant compared to Col-0 under different simulated drought regimes
Stage 0 Stage 1 Stage 2
Genes Enrich. p-value Genes Enrich. p-value Genes Enrich. p-value
Biological Process
unknown biological processes 160 9.3 1.18E-04 260 12.5 2.67E-11 456 16.9 4.61E-21
other cellular processes 140 9.7 0.029 261 12.8 4.01E-03 480 16.5 5.74E-05
other metabolic processes 138 10.4 0.015 269 13.1 2.93E-05 477 18.3 2.82E-07
protein metabolism 47 6.7 0.042 80 8.6 0.013 161 11.9 0.028
response to stress 40 6.3 9.20E-04 72 8.8 1.48E-05 125 9.1 1.11E-07
developmental processes 31 5 0.013 53 6.6 5.39E-03 86 9 7.36E-03
transcription 31 5.3 0.019 52 6.1 0.013 78 8.4 0.04
transport 28 5.2 0.051 64 8.1 2.31E-04 105 8.8 1.20E-04
response to abiotic or biotic stimulus 26 5.3 0.055 61 8.3 1.68E-04 114 9.5 8.32E-08
signal transduction 25 4.9 3.77E-03 35 5.2 0.018 65 7.7 1.96E-03
other biological processes 23 4.2 0.082 58 7.1 5.15E-04 101 10.9 2.92E-05
cell organization and biogenesis 15 3.6 0.091 22 5.2 0.022 56 7 0.054
electron transport or energy pathways 4 1.7 0.197 5 2.2 0.118 11 2.9 0.103
DNA or RNA metabolism 1 0.8 0.05 8 2.8 0.142 21 4 0.02
Molecular Function
unknown molecular functions 135 8.9 9.60E-06 231 11.5 1.23E-10 404 17 7.56E-20
other binding 76 7.5 3.20E-03 123 9.5 6.42E-03 192 11.9 0.03
other enzyme activity 62 7.1 1.93E-03 120 10.5 1.56E-06 197 12.7 6.77E-07
transferase activity 45 6.4 6.53E-03 66 8.1 0.03 155 13.2 1.75E-07
hydrolase activity 37 5.6 0.053 81 8.3 7.09E-04 131 11.4 1.37E-03
protein binding 36 5.4 0.069 69 7.8 0.036 118 10.3 0.033
nucleotide binding 35 6.4 0.039 39 6 9.76E-03 106 9.4 0.015
transcription factor activity 29 5 0.03 59 6.6 7.33E-04 96 9.4 6.60E-04
kinase activity 25 4.9 0.022 35 5.8 0.059 89 8.3 9.94E-06
DNA or RNA binding 25 5 9.91E-03 50 6.5 8.44E-03 103 9.6 0.019
other molecular functions 24 4.8 0.05 36 6.7 0.067 68 8.7 0.038
transporter activity 16 3.5 0.101 51 6.6 5.99E-05 88 8.1 1.06E-06
nucleic acid binding 9 2.9 1.06E-03 15 3.9 6.61E-06 44 6.4 2.91E-04
receptor binding or activity 7 2.9 0.024 8 2.5 0.087 15 3.6 0.033
structural molecule activity 4 1.7 0.083 8 2.9 0.048 19 4 0.064
Cellular Component
unknown cellular components 164 10.4 0.013 268 12.9 2.12E-05 415 17 1.48E-19
other cellular components 79 8 1.22E-04 110 10.7 0.013 218 14.1 3.31E-05
other membranes 58 7.5 3.99E-03 83 8.4 0.017 189 10.8 1.20E-06
nucleus 35 5.4 0.07 72 7.6 0.058 119 9.9 0.023
other intracellular components 34 6.2 4.18E-04 84 8.5 0.035 191 11.6 0.013
other cytoplasmic components 32 5 0.024 66 7.6 0.037 143 10.5 0.017
chloroplast 28 4 4.61E-03 66 7.6 0.015 152 10.9 7.94E-03
plasma membrane 21 4.6 0.038 50 6.3 0.03 129 10.9 2.07E-06
cell wall 10 2.9 0.083 13 3.6 0.104 32 5 0.017
[37] were highly induced by PBI425 but displayed identical expression patterns in Col-0 and hsi2-2 (Figure 8). Tran-scripts for PHOSPHOLIPASE Dα1 (PLDα1) and ANAC019, both positive regulators of ABA signalling [38,39], showed higher levels of expression in the mutant than wild-type following treatment with PBI425. With PLDα1, mRNA levels in hsi2 were also higher in the control and PEG 8000 treatments, suggesting constitutive differences in expression rather than altered responses to ABA and drought. Expres-sion of ERA1, which encodes a farnesyl transferase and a negative regulator of ABA signalling [40], was not inducible by PBI425 and showed no consistent differences between Col-0 and hsi2-2.
Two genes implicated in mediating drought stress (CBF1 and RD20) were highly inducible by PBI425 (Figure 8). While hsi2-2 and Col-0 displayed identical patterns of expression for RD20 in control and PBI425 treatments, expression of the transcription factor CBF1 was higher in hsi2-2 following treatment with the ABA analog. Expression of neither MYB15, MYB88 nor ERECTA were inducible by PBI425; however, levels of MYB15 in hsi2-2 were lower in the control, but not the PBI425 treatment and MYB88 levels were higher in hsi2 following PBI425 treatment. Levels of ERECTA mRNA also showed a trend of being higher in the hsi2 mutant under different treatments, although differences were Table 1 Gene Ontology classification terms enriched in the hsi2-2 mutant compared to Col-0 under different simulated drought regimes (Continued)
plastid 7 2.7 0.012 12 3.3 0.086 45 6.9 0.061 mitochondria 6 2.6 4.68E-03 19 4.3 0.112 46 6.1 0.06 extracellular 6 2.5 0.163 12 3.5 0.027 34 5.2 3.21E-04 ER 4 1.9 0.177 10 2.5 0.057 15 3.8 0.102 ribosome 2 1.1 0.035 7 3.4 0.119 18 3.9 0.084 Golgi apparatus 1 0.7 0.142 4 1.7 0.159 11 3.2 0.114
Enrichments were performed athttp://bar.utoronto.ca/ntools/cgi-bin/ntools_classification_superviewer.cgi. Statistically significant values (p < 0.05) are in bold. Stage 0, watered to field capacity; Stage 1, dry soil, no visible wilting; Stage 2, visible wilting.
-40 -20 0 20 40 60 80 100 AT1 G 52 92 0 AT3 G 16 65 0 AT5 G 60 25 0 AT4 G 35 65 0 AT1 G 02 77 0 AT1 G 52 92 0 AT3 G 16 65 0 AT5G 52 30 0 AT1 G 52 89 0 AT1 G 78 39 0 AT5 G 45 34 0 AT3 G 05 63 0 AT1 G 74 43 0 AT2 G 05 38 0 AT2 G 37 67 0 AT4 G 35 65 0 AT2G 29 37 0 AT1 G 02 77 0 AT4 G 10 02 0 AT5 G 45 83 0 AT5 G 60 25 0 Gene expr ession ( hs i2 /co l0)
Microarray Fold Change q-RT-PCR ratio
Stage 0 Stage 2
Figure 7 Kinetic RT-PCR validation of microarray analyses for a representative subset of genes. cDNA was synthesized from the areal portion of well watered plants (Stage 0) and at visible drought (Stage 2). Amplification of the housekeeping gene encoding polypyrimidine tract-binding protein1 (PTBpa, AT3G01150) was used as control to normalize PCR expression data. All values represent the averages of three biological replicates, each analyzed three times (technical replicates). Values from microarray expression are ratios of averaged, normalized fluorescent signals.
P* response to abiotic stimulus GO:0009628 2.03 5.27E-04 ABA receptor GCR2 At1g52920
P response to temperature stimulus GO:0009266 3.51 3.41E-04 RAB18, RD29B At5g66400; At5g52300
P response to light intensity GO:0009642 8.51 5.27E-04 ZAT12 At5g59820
P response to water deprivation GO:0009414 4.28 2.98E-03 RAB18, ANAC019 At5g66400; At1g52890
P response to abscisic acid stimulus GO:0009737 3.51 1.18E-03 RAB18, RD29B At5g66400; At5g52300
F* oxygen binding GO:0019825 3.63 4.93E-04 CYP705A12, -15, -19 At5g42580; At3g20080; At3g20100
Induced by Drought and Up-regulated at Stage 2 (hsi2:Col-0)
P secondary metabolism GO:0019748 5.48 6.12E-03 4-coumarate-CoA ligase 2 At3g21240
C* plasma membrane GO:0005886 4.98 8.54E-03 LTP2 At2g38530
Repressed by Drought and Up-regulated at Stage 2 (hsi2:Col-0)
P steroid biosynthesis GO:0006694 12.34 7.97E-03 DWARF 4 At3g50660
P carbohydrate metabolism GO:0005975 2.22 4.50E-04 Glycosyl hydrolase 9C2, 9B8, and 17 At1g64390; At2g32990; At2g05790
P secondary metabolism GO:0019748 2.3 9.31E-03 ESM1, CAD4 At3g14210; At3g19450
P carboxylic acid metabolism GO:0019752 2.28 1.10E-03 LOX2 At3g45140
F water transporter activity GO:0005372 9.73 1.52E-04 DELTA-TIP, PIP1 At3g16240; At3g61430
F carbon-oxygen lyase activity GO:0016835 4.31 1.27E-03 α- and β-carbonic anhydrase 1 At3g52720; At3g01500
C endomembrane system GO:0012505 1.53 1.55E-05 RKL1, LTP7 At1g48480; At2g15050
C plastid thylakoid GO:0031976 3.18 1.57E-04 β-carbonic anhydrase 1 At3g01500
C anchored to membrane GO:0031225 3.65 1.31E-04 TOO MANY MOUTHS At1g80080
Repressed by drought and Down-regulated at Stage 2 (hsi2:Col-0)
P DNA metabolism GO:0006259 6.94 7.51E-04 KRYPTONITE At5g13960
F protein binding GO:0005515 2.64 6.11E-03 Variant in methylation 4 At1g66040
Induced by Drought and Down-regulated at Stage 1 (hsi2:Col-0)
F electrochemical potential-driven transporter activity GO:0015290 5.88 1.65E-03 GPT2, ZIFL2 At1g61800; At3g43790
Induced by Drought and Up-regulated at Stage 1 (hsi2:Col-0)
P nitrogen compound biosynthesis GO:0044271 5.07 8.23E-03 GLN1.3 At3g17820
P response to chemical stimulus GO:0042221 2.23 7.92E-03 FIBRILLIN At4g04020
F oxidoreductase activity GO:0016491 2.54 8.39E-04 FERREDOXIN3 At2g27510
F protein ser/thr phosphatase activity GO:0004722 5.43 6.47E-03 PP2CA2 At1g30220
Repressed by Drought and Up-regulated at Stage 1 (hsi2:Col-0)
P cellular carbohydrate metabolism GO:0044262 4.24 3.01E-03 Cellulose synthase-like B1 At2g32610
F hydrolase activity GO:0016787 1.86 9.05E-03 Methyl IAA esterase At5g58310
BMC Plant Biology 2013, 13 :170 Page 12 of 20 ntral.com/1 471-2229/13/170
P response to temperature stimulus GO:0009266 7.17 8.46E-03 COR15B At2g42530
P response to abiotic stimulus GO:0009628 3.09 3.72E-03 COR15B, AGL19 At2g42530; At4g22950
F oxidoreductase activity GO:0016491 3.56 3.15E-03 TTG6, CAD At3g51240; At1g09500
Repressed by Drought and Down-regulated at Stage 0 (hsi2:Col-0)
P protein modification GO:0006464 6.34 7.37E-04 HDAC 18 At5g61070
F kinase activity GO:0016301 7.34 3.75E-04 Cysteine-rich receptor-like protein kinase 4 At3g45860
* P, Biological Process; F, Biological Function; C, Cellular Component.
In cases where multiple related classifications were significant, only a subset is listed. Lists with fewer than 3 genes are not shown. Enrichments were performed athttp://bioinformatics.psb.ugent.be/ATCOECIS using p < 0.05. BMC Plant Biology 2013, 13 :170 Page 13 of 20 ntral.com/1 471-2229/13/170
more obvious in the PEG 8000 treatment. Differences in ERECTA expression were also observed in rosette leaves before and after drought stress (Figure 8). Thus, the loss of HSI2 function did not affect the expression of most genes tested within 4 h of PBI425 treatment. A longer-term study may reveal latent changes in ABA-inducible expression, if any, of these genes in the mutant com-pared to the wild type.
Discussion
Our analyses establish a role for HSI2 in response to water stress during the vegetative stage of the Arabidopsis life cycle. Specifically, loss of HSI2 function results in plants better able to maintain physiological water potential under limiting water conditions, as indicated by reduced wilting and higher leaf RWC (Figure 2), while overexpression of HSI2 yields a complementary phenotype. These results are
Figure 8 Kinetic RT-PCR analysis of gene expression. cDNA was synthesized from total RNA from 14-day old seedlings treated with 25 μM PBI425 or 20% PEG 8000 for 4 h. Amplification of the housekeeping gene encoding polypyrimidine tract-binding protein1 (PTBpa, AT3G01150) was used as control to normalize expression data. All values represent the averages of three biological replicates, each analyzed three times (tech-nical replicates) ± standard error. In cases where expression levels were too small to graph, values are indicated in writing. If no bar is visible and no value indicated, the analysis was not performed.
consistent with HSI2 acting as a negative regulator. The ability of the hsi2 mutant to avoid low water potential is likely attributed, at least in part, to lower stomatal con-ductance (Figure 4), effectively reducing transpirational water loss. Consistent with this phenotype, the mutant constitutively expresses higher levels of genes implicated in reducing water loss or improving water use. These in-clude ERECTA, a positive regulator of water use efficiency through control of stomatal density and conductance [31] and PHOSPHOLIPASE Dα1, a positive regulator of ABA-induced stomatal movement and early-stage drought resistance [38] (Figure 8). Conversely, the transcription factor GTL1, a negative regulator of water use efficiency through its effect on stomatal density [32] is down-regulated in hsi2 at stage 0. Despite these changes in gene expression, no differences in stomatal density were obvi-ous between the hsi2 mutants and their corresponding wild-types in preliminary analyses. Stomatal density in Arabidopsis is developmentally controlled and affected by the environment [41]. Accordingly, more detailed analyses are required of both stomatal density and aperture. It is noteworthy that HSI2 transcripts are likely preferentially expressed in guard cells in the absence of stress [42,43], and thus could be involved in the direct or indirect regula-tion of guard cell genes.
An unanticipated finding of this study was the reduced levels of numerous metabolites and gene transcripts associated with tolerance to dehydration stress measured in the hsi2-2 mutant, compared to Col-0. This includes lower levels of ABA and several ABA metabolites (Figure 5) as well as osmolytes and osmoprotectants (Figure 6). Global analysis of gene expression revealed that most genes up-regulated under severe drought conditions are expressed at lower levels in hsi2-2 than in Col-0 (Additional file 3). Among GO terms highly enriched in these lists of genes include response to abiotic stimulus, response to water deprivation, and response to ABA stimulus (Table 2). It is noteworthy that levels of many of these metabolites continue to be induced, and levels of gene transcripts up-regulated, under drought condi-tions; it is the magnitude of change that is dampened in the mutant compared to the wild-type. These results are consistent with hsi2-2 plants experiencing, or at least perceiving, a milder dehydration stress than the wild-type under the conditions tested. One possible ex-planation for these findings is that the ability of hsi2-2 seedlings to maintain RWC and avoid low water poten-tial for a longer time than Col-0 delays the onset of cel-lular dehydration and attenuates its severity. Indeed, based on our metabolite and gene expression data, there is no evidence to indicate that hsi2-2 seedlings should have greater tolerance to dehydration stress. This includes ex-pression analysis of several genes associated with dehydra-tion stress in seedlings treated with a PEG soludehydra-tion that
simulates dehydration stress (Figure 8). The possibility that HSI2 affects drought tolerance by regulating other, and possibly, novel pathways cannot be excluded at this time and requires further investigation. Among the GO terms most significantly enriched in genes differentially expressed in hsi2 vs Col-0 are endomembranes and chlo-roplasts and represent potential targets for future studies. Included in the endomembranes group are a number of transporters (amino acid, water channel, polyamine trans-porters, and membrane) such as MATE efflux family pro-teins, proton-dependent oligopeptide transport (POT) family proteins, auxin efflux carriers, ABC transporters, a delta TIP (water channel protein), sugar and nitrate trans-porters and a cytochrome oxidase. Recently, differential expression of genes encoding pumps and transporters were associated with increased drought tolerance of rice near isogenic lines [13].
Seeds acquire desiccation tolerance during the final stages of maturation. Desiccation tolerance is also an im-portant component of drought tolerance, and parallels be-tween the two processes have been drawn previously [7]. HSI2 is known to be required for repression of seed mat-uration genes upon germination and the transition to vegetative growth [22,24,26]. In the absence of direct evi-dence for altered HSI2 activity in response of drought stress (Figure 1 and [23]), it could be argued that increased drought tolerance of the hsi2 mutant is a secondary effect triggered by the derepression of seed desiccation genes during vegetative growth. Indeed, transcripts of four genes encoding LEA proteins are constitutively up-regulated in leaves of the hsi2 mutant (Additional file 2) and GO terms consistent with antioxidant activity (e.g. flavonoids, oxido-reductases) are enriched (Table 2). However, these changes are unlikely to account for the altered dehydration avoid-ance responses described above. Overall, 23% of genes differentially regulated in hsi2 at stage 0 are also differen-tially expressed during the later stages of seed maturation, with 16% showing the same directionality of change in both conditions (data not shown). These values are lower than those observed in seedlings of hsi2 mutants [24,26]. Given that HSI2 regulation of seed maturation genes is dependent on sugar [22], the differences are likely attrib-uted to the inclusion of sucrose in the media used to grow seedlings. An alternative possibility is that HSI2 may only be required for a limited period of time during vegetative development for repressing seed maturation programs, as reported for PICKLE [44]. Of note, the seedling studies re-ported up-regulation of gene encoding master regulators of seed maturation (LEC1 and AFL clade B3 transcrip-tion factors). Of these, only transcripts of FUS3 were detected above background in leaves three-week-old Col-0 or hsi2 plants, and its expression was not altered by loss of HSI2. Thus, activation of seed maturation genes in leaves of the hsi2 mutant is likely to involve
different signalling events. In a number of organisms, genes regulating embryogenic events have been shown to be required at later stages of development, including in response to stress [45,46]. Thus, a role for HSI2 in repres-sing seed maturation genes upon germination and later, in response to water stress, is not unprecedented.
Our results indicate that HSI2 is not absolutely required for ABA signalling during drought stress. Both the (+)-ABA and its analog PBI425, which increase drought tolerance by activating ABA responses and ABA signalling [12,29], continued to effectively induce greater drought tolerance in both the hsi2 mutant and 35S:HSI2 plants without altering the relative tolerance of these genotypes compared to the wild-type (Figure 3). PBI425 was also ef-fective at reducing stomatal conductance in the mutant, with levels continuing to be lower than the wild-type fol-lowing treatment (Figure 4). Furthermore, the expression of several genes involved in ABA synthesis and signalling was unaltered in the mutant 4 hr after treatment with PBI425 (Figure 8), suggesting the mutant is not affected in its ability to respond to this hyperactive ABA analog, and presumably to ABA itself. In cases where gene expression was different between the mutant and wild-type following PBI425, it was typically also altered in the absence of PBI425, suggesting an ABA-independent cause. Although differences in the levels of several ABA-responsive genes were observed between hsi2 and wild-type when plants displayed visible wilting symptoms, these were measured several days following water withdrawal, thus complicating interpretation. Altered patterns of gene expression under these conditions are likely attributed, at least in part, to different levels of ABA in the mutant at wilting, which in turn we hypothesize to result for better maintenance of water potential in the mutant. Although the effects of PBI425 are mediated through ABA signalling, global tran-script profiling indicates that the two compounds do not act in an identical fashion [29]. Furthermore, exogenous application of growth regulators is limited in its ability to resolve the function of endogenous ones. For these rea-sons, additional research will be required to study the rela-tionship between HSI2 and ABA. This should include evaluating the role of endogenous ABA and ABA signal-ling by epistatic analysis of hsi2 and mutants defective in ABA synthesis or perception, such as nced3.
Given that HSI2 is an EAR-dependent transcriptional repressor [23], it could act to limit the transcription of a subset of drought-inducible genes when water is abun-dant. Such target genes would be constitutively de-repressed upon loss of HSI2 function, as observed in com-parisons of hsi2 and Col-0 transcriptomes at stage 0 (Table 2 and Additional file 3), conferring a benefit to the mutant upon initial exposure to limiting water conditions. Several previously reported stress responsive genes from Arabidopsis, including SFR6, LEA4-5, ATPAL1, AtCIMS,
EGY3, ATCP1, ATHAL3, ATHSP-70, FAR1, and GDH1, are differentially expressed in hsi2 in the absence of a drought stress. Notably, nearly all of the differentially expressed genes involved in cellular/transmembrane trans-port (of sugar, lipids and metal ions) are up-regulated in the mutant suggesting more active transport and de-toxification than in the wild-type. Also consistent with detoxification, possibly of reactive oxygen species known to accumulate in response to abiotic stress, is the en-richment of GO terms for oxidoreductases and flavo-noids in hsi2 at stage 0 (Table 2). We speculate that HSI2-mediated transcriptional repression is naturally relieved upon perception of limiting water conditions. Transcript levels of HSI2 do not appear to be altered in response to stress (Figure 1 and [23]), suggesting that de-repression of drought-related HSI2 targets is likely mediated by translational or post-translational modification of HSI2. Several EAR-containing plant proteins have been shown to be post-translationally modified by phosphorylation or poly-ubiquitination, providing a potential means of reliev-ing their repressive effects on gene expression (reviewed in [47]).
Conclusions
By subjecting single hsi2 mutants and plants overexpress-ing HSI2 to simulated drought stress by withholdoverexpress-ing watering, we have demonstrated a role for the putative chromatin remodelling factor HSI2 during drought stress at vegetative stage of the Arabidopsis life cycle life. Al-though elucidating the exact role of HSI2 will require add-itional research, available information indicates that it fulfils a negative role in maintaining physiological water potential under limiting water conditions and as such rep-resents a potential target for genetic manipulation towards the development of crops better suited for cultivation under water-limited environments. Formal demonstration that HSI2 activity is regulated in response to drought stress will be important to resolving its biological role at this stage of the plant life cycle. The identification of direct targets for HSI2, the dynamics of HSI2 binding to these targets and the associated epigenetic state of the targets following water withdrawal will be required to clarify the involvement and mechanism of action of HSI2 in mediat-ing drought-related gene expression.
Methods
Plant materials and growth conditions
Arabidopsis thaliana (L.) Heynh. was used throughout. T-DNA insertion lines, hsi2-2 (SALK_088606) and hsi2-5 (WiscDsLox388F10) were identified from the Salk Insti-tute Genomic Laboratory Genomic database (http://signal. salk.edu; [48] and obtained from the Arabidopsis Bio-logical Resource Centre (ABRC, http://abrc.osu.edu/). The locations of T-DNA insertions were confirmed by
sequencing of PCR fragments and plants homozygous for the T-DNA insertions were identified by PCR (oligos used for PCR amplification are listed in Additional file 4).
To generate plants overexpressing HSI2, the genomic protein-coding region of At2g30470 was amplified by PCR from the BAC T6B20 (ABRC) and inserted sequentially into pDONRZeo (Invitrogen, http://www.invitrogen.com) and the pK7WG2 [49] derivative pER330 (E. Risseeuw and R. Datla, unpublished) using Gateway technology (Invitrogen). The integrity of the resulting 35S:HSI2 gene was confirmed by sequencing. Transgenic plants were generated by dipping inflorescences of Col-0 [50] in a sus-pension of Agrobacterium tumefaciens GV3101 (MP90) harboring the modified T-DNA binary plasmid and
sub-jecting the resulting seeds to antibiotic selection (30 mg l-1
kanamycin). Independent T3 or T4 lines expressing the
transgene were analyzed.
Unless otherwise noted, seeds of different genotypes were stratified for 2 days at 4°C, sown on Sunshine #4 potting mix (Sun Gro Horticulture, http://www.sungro. com/) and transferred to environment-controlled growth
chambers with a 16-h photoperiod (200 μmol m-2s-1) at
22/20°C (day/night). All samples for gene, hormone and metabolite analysis were collected at the same time of day to minimize circadian effects, immediately frozen in liquid nitrogen and stored at −80°C.
Drought treatments and measurements
Plants were watered as needed to maintain the soil moisture near field capacity and fertilized weekly with 20 N:20P:20 K until three-week-old, at which point they were subjected to drought stress by withholding water. Visual wilting, indicated by progressive loss of lush green color of leaves and drooping of leaf blades and petiole, was monitored daily thereafter until more than 80% plants were wilting. At the end of the observation period, plants were watered to field capacity, and re-covery was recorded 24 h thereafter. Drought response (visual wilting) and recovery from wilting upon re-watering were evaluated in three independent batches of plants, originating from at least 2 different seed lots, with 36–72 plants observed per batch. Leaf water status was measured when more than 50% of the plants started to wilt. Results are presented as leaf Relative Water Con-tent (RWC = fresh weight-dry weight/turgid weight-dry weight) and as percentage of wilted or dead plants at, or over, a certain period of time. In experiments evaluating the effect of the ABA analog on the onset and progress of drought stress, three-week-old plants were subjected to root-dip treatment with 30 μM of (+)-ABA or 20 μM of the long-lived synthetic ABA analog, (+)-8’-acetylene ABA (PBI425) in 0.05% ethanol v/v [27] and watering was withheld thereafter. The concentrations of ABA and the PBI425 were chosen based on information from the
published literature [12]. Preliminary dose–response experiments established these levels as being effective at delaying visual wilting in Col-0 without undesired side effects, such as the accumulation of anthocyanins and leaf curling, that were observed when higher con-centrations of PBI425 or (+)-ABA were applied. Be-cause the hsi2 mutant responded very similarly to ABA and PBI425, and PBI425 offers several advantages over natural ABA when the sustained presence of hormonal activity is required, the synthetic analog was used in subsequent experiments. Student’s t-test (p ≤ 0.05) was performed to identify significant differences between treatments.
Measurement of stomatal conductance
Stomatal conductance was measured from fully ex-panded young leaves from well-watered or PBI425-treated plants using a steady state leaf porometer (Model SC-1,Decagon Devices, http://www.decagon.com) fol-lowing the manufacturer’s instructions. Porometer read-ings were taken from the adaxial side (lower surface) of leaves by placing the sensor head at the widest part of the leaf and holding it in place until the measurement was complete (~ 30 seconds/reading). Measurements were taken from 2–4 leaves per plant and 8–12 different plants from each genotype and treatment. Porometer readings taken different leaves of a plant were averaged to derive a single value, and genotype and treatment average were calculated thereafter. Measurements were performed between 9:30 am to 11:30 am, two h after lights were turned on in the cabinets.
Quantification of ABA and metabolites by LC-MS/MS
Analysis was conducted at the National Research Council, Saskatoon, by UPLC-ESI-MS/MS (http://www. nrc-cnrc.gc.ca/eng/solutions/advisory/plant_hormone.html) as described in Chiwocha et al. [51]. For ABA profiling, tissues for analysis were harvested from the aerial por-tion of 3-week-old, well-watered (soil saturated to field capacity), drought-stressed (showing wilting) and re-watered (to field capacity, 24 h) plants. Each sample con-sisted of material pooled from six plants.
Metabolomic profiling and analysis
For metabolic profiling analyses, tissues were harvested from the aerial portion of 3-week-old, well-watered (to soil saturation, near field capacity), drought-stressed (showing visible wilting) and re-watered (to soil satur-ation for 24 h) plants and frozen immediately in liquid nitrogen and stored at −80°C until analyzed. Samples were collected in three biological replicates per genotype and each sample (65–250 mg) consisted of material pooled from six plants. Frozen tissues were freeze-dried and ana-lyzed by Metabolon Inc (http://www.metabolon.com) as
described by Oliver et al. [52]. Briefly, samples were ex-tracted and prepared for analysis using Metabolon’s standard solvent extraction method. The extracted samples were split into equal parts for analysis on the GC/MS and LC/MS/MS platforms. Also included were several technical replicate samples created from a homogeneous pool containing a small amount of all samples considered in the study. A total 156 named biochemicals were identified. Following log transform-ation and imputtransform-ation with minimum observed values for each compound, ANOVA contrasts were used to identify biochemicals that differed significantly between two genotypes at various time points.
Microarray analysis
Gene-expression profiles were generated using Arabi-dopsis 4 × 44 K oligonucleotide microarrays (http:// www.agilent.com). Total RNA was isolated using the Qiagen RNAeasy Plant Mini Kit (http://www.qiagen. com) and quality was assessed using an Agilent-2100 Bioanalyzer. Each sample co-hybridized consisted of ros-ette leaves from four plants. Four independent biological replicates were analyzed at stage 0 (well-watered to field capacity) and three replicates at each of stage 1 (dry soil following withholding watering but before visible wilting) and stage 2 (visible wilting). Labeling and hybridization were performed following the manufac-turer’s protocol using Agilent’s QuickAmp Labeling kit for two-color microarrays and incorporated a dye swap design. After washing, arrays were scanned and signals converted to expression data using GenePix 4000B scanner (GenePix Pro. 6.1, http://www.moleculardevices. com). Further in-house analysis was performed in GeneSpring GX.10 (Agilent). Additional analyses of differentially expressed genes were conducted using the following web-based tools; the Classification
Super-Viewer (The BAR; http://bar.utoronto.ca/ntools/cgi-bin/
ntools_classification_superviewer.cgi), ATCOECIS (http://
bioinformatics.psb.ugent.be/ATCOECIS), and Athena (http:// www.bioinformatics2.wsu.edu/cgi-bin/Athena/cgi/analysis_se-lect.pl). To compare expression levels of the wild-type before and after drought, single channel intensity values were ob-tained using the formula intensity calculator plugin in BASE 2.14.0 (http://base.thep.lu.se) and normalized with the Limma software package for R [53], using robust spline for intra-array and quantile for interintra-array normalizations. MIAME complaint data have been submitted to GEO (Accession # GSE39347).
Kinetic polymerase chain reaction analysis
Total RNA was isolated using the Agilent Plant RNA Isola-tion Mini Kit and treated with amplificaIsola-tion grade DNase I (Invitrogen). The first-strand cDNA was synthesized using SuperScript® II reverse transcriptase (Invitrogen) and
kinetic Polymerase Chain Reaction was performed on an MX3005P spectrofluorometric thermal cycler (Strata-gene, http://www.stratagene.com) as described by Sharma et al. [54]. Amplification of the housekeeping gene en-coding polypyrimidine tract-binding protein1 (PTBpa; AT3G01150) was used as control to normalize expression data. The list of genes analyzed and primers used in k-RT-PCR experiments are presented in Additional file 5.
For analysis of gene expression in response to PBI425 and polyethylene glycol, seeds were surface sterilized, stratified as above, and germinated on agar solidified 0.5× Murashige and Skoog (MS) medium (Sigma, http:// www.sigma.com) in 150 × 15 mm Petri plates in a
con-trolled environment chamber (80–100 μmol m-2s-1light
Intensity, 16-h photoperiod, 24°C). Fourteen-day-old plants were flooded with PBI425 (25 μM) or 20% PEG 8000 on the germination plates and incubated at room temperature for 4 h prior to tissue harvest.
Additional files
Additional file 1: Heat maps of metabolic responses in Col-0 and
hsi2-2to drought stress.
Additional file 2: Annotated list of probe sets differentially regulated in leaves of hsi2-2 at each stages of drought.
Additional file 3: Summary of comparisons between genes found to be regulated by drought in the present study and the literature. Additional file 4: Summary of comparisons between genes found to be regulated by drought in the present study and the literature, considering directions of expression changes. Genes with >2.5× difference in average signal intensity between Col‐0 at stage 0 vs stage 2 were compared. Duplicate AGI codes were removed.
Additional file 5: List of genes and primer sequences used in this study.
Abbreviations
35S:Cauliflower mosaic virus 35S promoter; ABA: Abscisic acid; GE: ABA-glucose ester; ABI3: Absicic acid insensitive3; AFL: ABI3/FUS3/LEC2;
DPA: Dihydrophaseic acid; FUS3: FUSCA3; GO: Gene ontology; HSI2: High-level expression of sugar inducible gene2; HSL1: HSI2-Like1; HSL2: HSI2-Like2; k-RT-PCR: Kinetic reverse-transcriptase PCR; LEA: Late-embryogenesis abundant; LEC2: Leafy cotyledon2; mDr: Moderate drought; OEx: Over expression (lines show increased levels of HSI2 transcripts); PA: Phaseic acid; pDr: Progressive drought; PHD: Plant homeodomain; PLDα1: Phospholipase Dα1; RWC: Relative water content; t-ABA: Trans-ABA; VAL1: Viviparous ABI3-Like1.
Competing interests
Patent applications have been filed on the use of HSI2 to enhance drought tolerance (International Patent Application PCT/CA2010/000754, United States Patent Application 13320813). Authors NS and PRF are inventors on these applications.
Authors’ contributions
NS and PRF conceived the study, analyzed and interpreted the data, and drafted the manuscript with the assistance of KB and YB. NS and YB generated plant material and performed physiological studies. YB and KB performed gene expression analyses. KB assisted with microarray data analysis and with the preparation of figures and tables. All authors read and approved the final manuscript.