SUPPORTING INFORMATION osarf19 (a) OsARF19 (b) WT band MT band DJ osarf19 (c) OsARF19 OsActin 26 cycles 36cycles DJ osarf19 (d) 0 0.2 0.4 0.6 0.8 1 1.2 1.4 DJ osarf19 OsARF19 Re lative m RN A leve l (e) T he nu m ber of l at er al root 0 20 40 60 80 100 120 140 DJ osarf19 (f) ** ** DJ osarf19 DJ osarf19 DJ
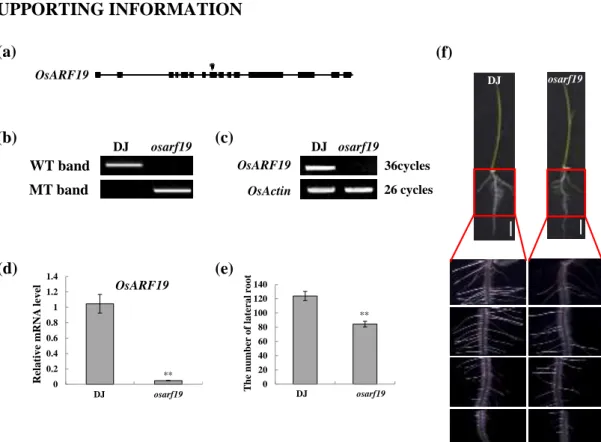
Figure S1. Identification of osraf19 mutant. (a) T-DNA insertion site in the OsARF19
gene. Black triangle indicates the T-DNA insertion site. (b) Identification of T-DNA insertion using PCR. (c) OsARF19 expression in DJ and osarf19 mutant analyzed by RT-PCR. (d) OsARF19 expression in DJ and osarf19 analyzed by qRT-PCR. (e) Lateral root number in DJ and osarf19. Ten biological repeats were performed for the measurement of leaf angles. **indicate significant differences at P < 0.01. (f) Phenotypes of WT and osarf19. Roots were observed with a Leica MZ95 stereomicroscope (Leica Instrument, Nusslosh, Germany). Bar = 2 cm.
AuxRE: TGTCT(A,C)C 100bp OsGH3-5 -1000 -1828 -2000 ATG -1731 -1281 P3 P2 P1 ATG -1000 -2000 -86 -1554 -1986 OsBRI1 -1955 -809 P3 P1 P2 -1000 -2000 -1393 OsGH3-2 ATG -1929 -1937 -1000 -2000 -1590 OsGH3-13 ATG -2267 -1000 -2000 OsGH3-1 ATG
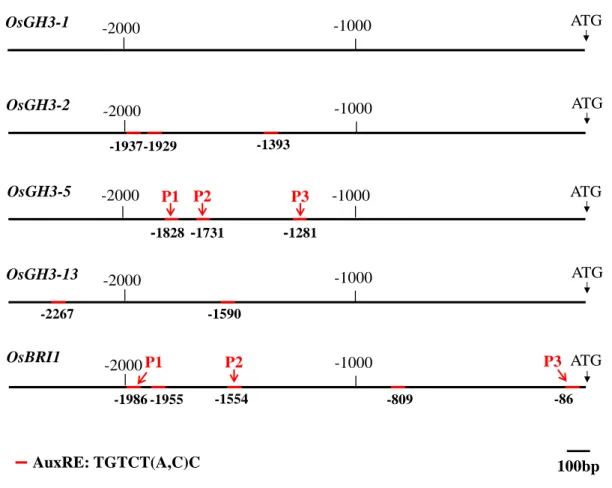
Figure S2. Analysis of AuxRE elements in promoters of OsGH3 genes and
OsBRI1. P1, P2 and P3 in OsGH3-5 and OsBRI1 promoter indicate the related
0 20 40 60 80 100 120 140 0 2 4 6 8 10 12 OsGH3-5 R el at ive m R N A l evel (a) OsGH3-5 OsActin 22 cycles 32 cycles (c) (e) (b) **
NIP OsGH3-5-O1 -O2 -O3 -O4 -O5 -O6 -O7 -O8 -O9 -O10 -O11 -O12
** ** ** ** ** ** ** ** ** 0 0.2 0.4 0.6 0.8 1 1.2 1.4 1.6 F lag leaf w id th (c m ) 0 10 20 30 40 50 60 70 80 P lan t h eigh t ( cm ) ** ** **** ** ** ** ** **** F lag l eaf an gl e ( ° ) (d) 0 0.5 1 1.5 2 2.5 3 3.5 4 G rain b re ad th (m m ) (f) ** ** ** ** ** ** ** ** ** ** ** ** ** ** ** ** ** ** ** ** ** ** ** ** ** ** ** ** ** **
Figure S3. Identification of OsGH3-5-overexpression lines. (a) OsGH3-5 expression
in NIP, OsGH3-5-overexpression lines analyzed by RT-PCR. (b) OsGH3-5 expression in NIP, OsGH3-5-overexpression lines analyzed by qRT-PCR. Three independent biological replicates were used in the qRT-PCR analysis according to Wang et al. (2010). (c) Statistical data of Flag angle. (d) Statistical data of flag leaf width. (e) Statistical data of plant height. (f) Statistical data of grain breadth. Ten biological repeats were employed in each test. Error bars indicate SD (n = 10). **
(a) WT band MT band NIP osgh3-5 0 0.2 0.4 0.6 0.8 1 1.2 NIP osgh3-5 OsGH3-5 Rela tive m RNA lev el OsGH3-5 OsActin 26 cycles 35 cycles NIP osgh3-5 Seed setting ra te (% ) 0% 10% 20% 30% 40% 50% 60% 70% 80% 90% 100% NIP osgh3-5 (b) (c) (d) (h) (g) NIP osgh3-5 NIP osgh3-5 (i) OsGH3-5 400bp Flag leaf a ng le ( º) NIP osgh3-5 (e) (f) ** ** 20 21 22 23 24 25 26 27 28 29 30 NIP osgh3-5 NIP osgh3-5 NIP osgh3-5 NIP osgh3-5
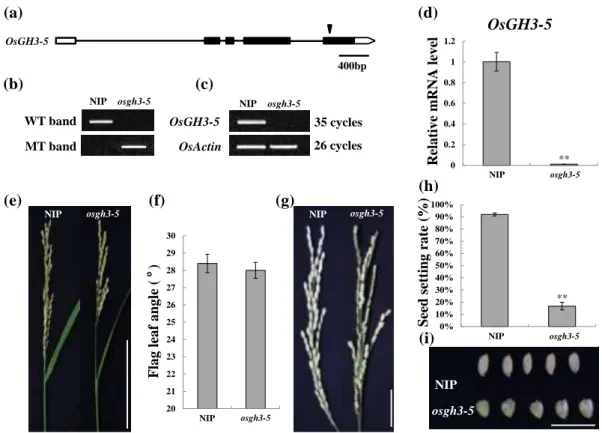
Figure S4. Identification of the osgh3-5 mutant. (a) TOS17 insertion site in the
OsGH3-5 gene. Black triangle marks the TOS17 insertion site. (b) Identification of
the TOS17 insertion using PCR. (c) OsGH3-5 expression in NIP and osgh3-5 mutant analyzed by RT-PCR. (d) OsGH3-5 expression in NIP and osgh3-5 analyzed by qRT-PCR. Three independent biological replicates were used in the qRT-PCR analysis according to Wang et al. (2010). Error bars indicate SD (n = 3). ** indicate significant differences at P < 0.01. All bars = 400μm. (e) Flag Leaf angles at the mature period of NIP and osgh3-5. Bar = 10 cm. (f) Statistical data of flag leaf angle of NIP and osgh3-5. Ten biological repeats were performed each test. (g) Phenotype of panicle of NIP and osgh3-5. Bar = 2 cm. (h) Seed setting rate of NIP and osgh3-5. Ten biological repeats were performed for each test. Error bars indicate SD (n = 10). ** indicate significant differences at P < 0.01. Bars = 200μm. (i) Phenotypes of seeds. Bar = 1 cm.
0 2 4 6 8 10 12 R-T F L LJ LR R
OsGH3-5
R el a ti v e m R N A lev el ** ** ** ** **(d)
(f)
(e)
(c)
(g)
(a)
(b)
(h)
(j)
(i)
(k)
(l)
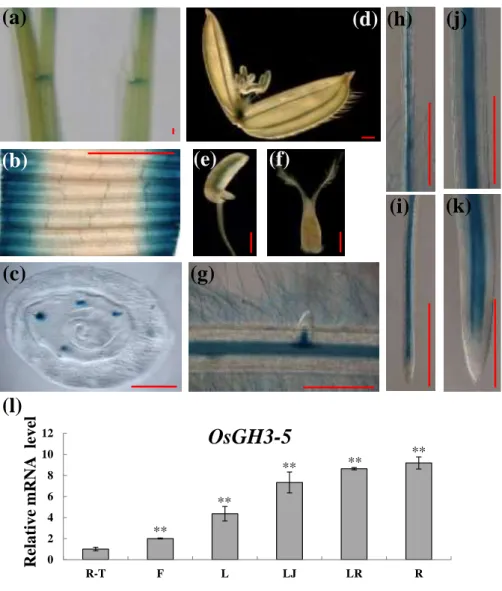
Figure S5. Expression pattern of OsGH3-5 in rice NIP. (a) Lamina joints of flag
leaves for three month-old. (b) Leaf. (c) The cross section of root-stem transition region. (d) Flower and glume. (e) Anther. (f) Stigma. (g) Root hair and lateral root in adventitious root. (h) and (i) Lateral root. Maturation zone (h). Root tip (i). (j) and (k) Primary root. Elongation zone (j). Root tip (k). (l) qRT-PCR analysis of OsGH3-5 in each tissue of rice NIP. R-T: The cross section of root-stem transition region, F:
(2010). Error bars indicate SD (n = 3). ** indicate significant differences at P < 0.01. All bars = 400μm. 0 0.5 1 1.5 2 2.5 3
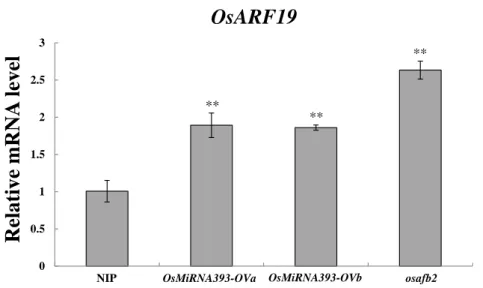
NIP OsMiRNA393-Oa OsMiRNA393-Ob osafb2
OsARF19
Relat
ive
mRN
A
le
vel
** ** **NIP OsMiRNA393-OVa OsMiRNA393-OVb osafb2
Figure S6. OsARF19 expression in OsMiRNA393-overexpression lines and osafb2
(OsTIR1-RNAi) mutant. Three independent biological replicates were used in the
qRT-PCR analysis according to Wang et al (2010). Error bars indicate SD (n = 3). ** indicate significant differences at P < 0.01.
Figure S7. ChIP assay and yeast one hybrid of OsARF19 and OsBRI1.
(a) ChIP-PCR analysis. OsARF19 ChIP assays were performed as described under Fig. 4a. DNA products were amplified using three specific primers (listed in Supporting Information Table S4) with the AuxRE elements in OsBRI1 promoters. (b) YOH assay between OsARF19 and OsBRI1. The bait vector containing the
OsBRI1-promoter fragments P1 or P3 and the mutated P1M or P3M fused HIS2
reporter gene, and the prey vector containing OsARF19 fused a GAL4 activation domain were co-transformed into yeast cells (Y187). Growth condition of yeast cells were tested as indicated under Fig. 4b.
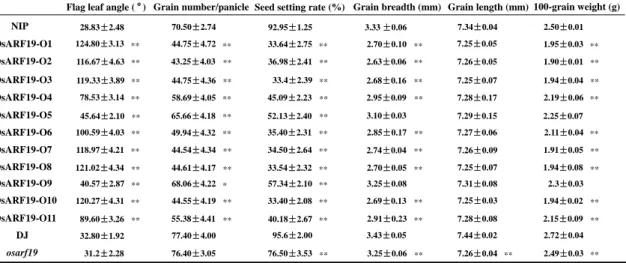
Table S1a. Statistical data of phenotypical characterization in WT/NIP,
OsARF19-overexpression lines, WT/DJ and osarf19.
NIP OsARF19-O1 OsARF19-O2
Plant height (cm) Tiller number Flag leaf width (cm) Flag leaf length (cm) Panicle length (cm)
OsARF19-O3 OsARF19-O4 OsARF19-O5 OsARF19-O6 OsARF19-O7 OsARF19-O8 OsARF19-O9 OsARF19-O10 OsARF19-O11 DJ osarf19 72.50±2.65 7.67±0.58 1.41±0.04 45.70±1.47 49.25±2.50 9.67±0.58 1.05±0.06 27.63±0.91 51.30±1.25 9.33±0.58 1.17±0.06 26.42±1.31 17.69±0.65 13.49±0.85 14.03±0.33 50.52±1.56 65.35±1.25 68.09±2.05 58.66±2.18 53.74±1.09 49.96±2.17 69.80±2.07 50.35±1.46 64.38±2.41 80.00±2.55 7.40±0.55 1.56±0.05 48.38±0.97 79.70±1.10 7.00±1.00 17.82±0.29 17.56±0.29 1.48±0.04 45.50±1.12 9.50±0.41 8.52±0.39 7.92±0.23 9.13±0.48 9.40±0.31 9.60±0.64 7.84±0.32 9.53±0.08 8.18±0.67 1.09±0.04 1.25±0.16 1.31±0.09 1.18±0.03 1.10±0.06 1.05±0.04 1.35±0.05 1.08±0.08 1.23±0.13 2.51±1.64 33.02±1.67 38.43±1.47 30.27±1.45 27.04±1.90 27.52±1.46 40.49±1.37 27.52±1.78 35.37±1.61 13.51±0.56 15.9±0.24 16.5±0.86 14.51±0.44 13.83±0.64 13.53±0.65 17.03±0.66 13.51±0.51 15.43±0.40 ** ** ** ** ** ** ** ** ** ** ** ** ** ** ** ** ** ** * ** ** ** ** ** ** ** ** ** ** ** ** ** ** ** ** ** ** ** * * * * * * * * *
All values are the averages of 10 seedlings for 3 month-old plants (±SD).
* Significant difference from wild type at 5% by student’s t test. ** Significant difference from wild type at 1% by student’s t test.
* **
Table S1b. Statistical data of phenotypical characterization in WT/NIP,
OsARF19-overexpression lines, WT/DJ and osarf19.
NIP OsARF19-O1 OsARF19-O2 OsARF19-O3 OsARF19-O4 OsARF19-O5 OsARF19-O6 OsARF19-O7 OsARF19-O8 OsARF19-O9 OsARF19-O10 OsARF19-O11 DJ osarf19 44.75±4.36 58.69±4.05 65.66±4.18 44.54±4.34 44.61±4.17 68.06±4.22 44.55±4.19 55.38±4.41 33.4±2.39 45.09±2.23 52.13±2.40 35.40±2.31 34.50±2.64 33.54±2.32 33.40±2.08 40.18±2.67 2.68±0.16 2.95±0.09 3.10±0.03 2.85±0.17 2.74±0.04 2.70±0.05 3.25±0.08 2.91±0.23 7.25±0.07 7.28±0.17 7.29±0.15 7.27±0.06 7.26±0.09 7.25±0.07 7.31±0.08 7.28±0.08 1.94±0.04 2.19±0.06 2.25±0.07 2.11±0.04 1.91±0.05 1.94±0.08 2.3±0.03 2.15±0.09
Grain number/panicle Seed setting rate (%) Grain breadth (mm) Grain length (mm) 100-grain weight (g) Flag leaf angle ( º)
28.83±2.48 116.67±4.63 124.80±3.13 32.80±1.92 31.2±2.28 119.33±3.89 78.53±3.14 45.64±2.10 100.59±4.03 118.97±4.21 121.02±4.34 40.57±2.87 120.27±4.31 89.60±3.26 70.50±2.74 92.95±1.25 3.33 ±0.06 7.34±0.04 2.50±0.01 44.75±4.72 33.64±2.75 2.70±0.10 7.25±0.05 1.95±0.03 43.25±4.03 36.98±2.41 2.63±0.06 7.26±0.05 1.90±0.01 77.40±4.00 95.6±2.00 3.43±0.05 7.44±0.02 2.72±0.04 76.40±3.05 76.50±3.53 3.25±0.06 7.26±0.04 2.49±0.03 49.94±4.32 57.34±2.10 2.69±0.13 7.25±0.03 1.94±0.02 ** ** ** ** ** ** ** ** ** ** ** ** ** ** ** ** ** ** ** ** ** ** ** ** ** ** ** ** ** ** ** ** ** ** ** ** ** ** ** ** ** ** ** ** ** ** ** ** **
Data are measured with 4 month-old seedlings at least 10 plants (±SD). * Significant difference from wild type at 5% by student’s t test. ** Significant difference from wild type at 1% by student’s t test.
** ** ** ** ** *
Table S2. Primer sequences for OsARF19 gene.
Name Primer sequences (5’-3’)
OVARF19U/L GGTACCATGATGAAGCAGGCGCAGCA/CAGCTGTCATTCGAATTGTTCATATGAAC RTARF19U/L GTCCTACTGAATTTGTTATC/CAGATAGAAACCCTATTTCG ProARF19U/L GGATCCATATGCCAAGCCAAGGTTA/GGTACCGACCTCAGACCAGACAG ARF19-LP GCCAGGGATTTGCATGATAA ARF19-RP CATCCCAACCAACCTGTAAGTT Ngus-RB AACGCTGATCAATTCCACAG
OsACTIN U/L TCAGCAACTGGGATGATATGGAG/GCCGTTGTGGTGAATGAGTAAC
Table S3. Primer sequences for OsGH3 genes.
OsGH3-1-qRT-U/L CGGGAACAAGCAATGGAACA /CAGATCATCACCCTCTAGCTTCAA OsGH3-2-qRT-U/L TCATGCCCGTCATGAACTTG /TCGTCTCCGACTTGATGAACAG OsGH3-5-qRT-U/L CACGGAAAGCCCAAGTTCATT/TTATGACTTGCTTGCTACCATAA
OsGH3-13-qRT-U/L TGTGTAATGTCAAACGTTGCTCAT/TGATTCATAAAGAACACTGCTCGTATT OVGH3-5U/L CACCATGACGATCTGCAGCTG/AAATCCATAGGCAGTACTGAAATAA
ProGH3-5-GUSU/L GTCGACCAGAAAGTTTTTCAGAGATAACAG/GGTACCGAGAGAGAGGTTGGTGATGG GH3-5-LP/RP GCCAGACTCACCAATAACAT/CACCACCAAGGCTTAGGAAA
TOS17 tail16 AGGTTGCAAGTTAGTTAAGA(3’end of Tos 17)
Name Primer sequences (5’-3’)
Table S4. Primer sequences for ChIP-PCR analysis.
35S:ARF19-sGFP-U/L GGTACCATGATGAAGCAGGCGCAGCA/GTCGACTTCGAATTGTTCATATGAACCATTG pGH3-1-1U/L GTATCGTCCAGAGTTCCACAC/CATTTCCTAACACCCCTTGTG pGH3-1-2U/L ATGTATCGTGGTGTTAAGTG/TTCAACCGTATTGTTTTAGT pGH3-1-3U/L ACATCTTCTCCATCTCCACG/GAGCTTGGTTTGTGTGAGCG pGH3-2-1U/L CAGATTTACTGTAGATCCTCG/ATCTGTCGATCGAGTTGTTCC pGH3-2-2U/L ACAGAAAGGGGATAGATAGG/AAAATTAGCACGTCACAAA pGH3-2-3U/L GTGGCGCTGCACACTACTG/GTTGTGTAGTTGTTCGTCTCC pGH3-5-1U/L TAATCTCCTTTCTTTGCGTCT/AGTTTTAATACCTCGTTGACC pGH3-5-2U/L TGTCGGCAATAAAGTTCCAC/GTAGAATCCTGGCTTTACCAC pGH3-5-3U/L CCTTTCCTCCATTGTAGGGTG/CGCGAAATTTTGGACGAACCG pGH3-13-1U/L TTGTTTTCCTCCTCTTTTCC/CTGTTGTTTTATTGTTTGCTA pGH3-13-2U/L CTTTTGGGAGGAGGTAGTAAC/AGATGTGAGATGATTTAGCC pGH3-13-3U/L GGCTGAAGAAGTAGAAGAAG/TTGACAGTCCAAAGGTTATT pBRI1-1U/L CAGTAAAACCTGAAAGTGCAT/CACCCCTACTTGTCACGGA
Table S5. Primer sequences for Yeast one-hybrid.
Name Primer sequences (5’-3’)
OsGH3-5-P3-pHIS2-U AATTCGCGGGGGATGCTGCTCCCTGAGCCTGTGTGTGTCTCTTGATTTTTCTTTCTTTGCTCGCAGAGCT
OsGH3-5-P3-pHIS2-L CTGCGAGCAAAGAAAGAAAAATCAAGAGACACACACAGGCTCAGGGAGCAGCATCCCCCGCG
OsGH3-5-P3M-pHIS2-U AATTCGCGGGGGATGCTGCTCCCTGAGCCTGTGTGAAAAAATTGATTTTTCTTTCTTTGCTCGCAGAGCT
OsGH3-5-P3M-pHIS2-L CTGCGAGCAAAGAAAGAAAAATCAATTTTTTCACACAGGCTCAGGGAGCAGCATCCCCCGCG OsBRI1-P1-pHIS2-U AATTCGTACCTCTAACATGCGTACACAATTCTTACTGTCTCAGGTCATACCAAGGAAGATCTTATGAGCT OsBRI1-P1-pHIS2-L CATAAGATCTTCCTTGGTATGACCTGAGACAGTAAGAATTGTGTACGCATGTTAGAGGTACG OsBRI1-P1M-pHIS2-U AATTCGTACCTCTAACATGCGTACACAATTCTTACAAAAAAAGGTCATACCAAGGAAGATCTTATGAGCT OsBRI1-P1M-pHIS2-L CATAAGATCTTCCTTGGTATGACCTTTTTTTGTAAGAATTGTGTACGCATGTTAGAGGTACG OsBRI1-P3-pHIS2-U AATTCTCCTCCTCATCACTTCCCACTCTCCCCCTTCTGTCTCTCTACTTTCTCTCTCTACCGCCGGAGCT OsBRI1-P3-pHIS2-L CCGGCGGTAGAGAGAGAAAGTAGAGAGACAGAAGGGGGAGAGTGGGAAGTGATGAGGAGGAG OsBRI1-P3M-pHIS2-U AATTCTCCTCCTCATCACTTCCCACTCTCCCCCTTCAAAAAATCTACTTTCTCTCTCTACCGCCGGAGCT OsBRI1-P3M-pHIS2-L CCGGCGGTAGAGAGAGAAAGTAGATTTTTTGAAGGGGGAGAGTGGGAAGTGATGAGGAGGAG OsARF19-orf-ADU/L CCATCGATGGATGATGAAGCAGGCGC/CCGCTCGAGTCATTCGAATTGTTCATATGA
Table S6. Primer sequences for co-expression analysis.
Name Primer sequences (5’-3’)
OVARF19U/L GGTACCATGATGAAGCAGGCGCAGCA/CAGCTGTCATTCGAATTGTTCATATGAAC ProGH3-5-sGFPU/L GAATTCCAGAAAGTTTTTCAGAGATAACAG/GGATCCTAATGGTAGAATCCTGGCTTTAC
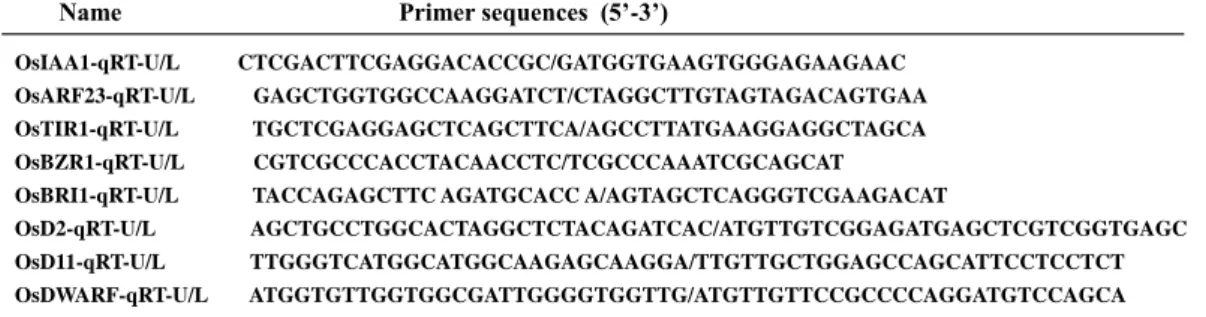
Table S7. Primer sequences for qRT-PCR analysis.
OsIAA1-qRT-U/L CTCGACTTCGAGGACACCGC/GATGGTGAAGTGGGAGAAGAAC OsARF23-qRT-U/L GAGCTGGTGGCCAAGGATCT/CTAGGCTTGTAGTAGACAGTGAA OsTIR1-qRT-U/L TGCTCGAGGAGCTCAGCTTCA/AGCCTTATGAAGGAGGCTAGCA OsBZR1-qRT-U/L CGTCGCCCACCTACAACCTC/TCGCCCAAATCGCAGCAT
OsBRI1-qRT-U/L TACCAGAGCTTC AGATGCACC A/AGTAGCTCAGGGTCGAAGACAT
OsD2-qRT-U/L AGCTGCCTGGCACTAGGCTCTACAGATCAC/ATGTTGTCGGAGATGAGCTCGTCGGTGAGC OsD11-qRT-U/L TTGGGTCATGGCATGGCAAGAGCAAGGA/TTGTTGCTGGAGCCAGCATTCCTCCTCT OsDWARF-qRT-U/L ATGGTGTTGGTGGCGATTGGGGTGGTTG/ATGTTGTTCCGCCCCAGGATGTCCAGCA