DOI: 10.1126/science.1166368
323
, 1187 (2009);
Science
et al.
Zhonghui Liu,
Climate Transition
www.sciencemag.org (this information is current as of February 27, 2009 ):
The following resources related to this article are available online at
http://www.sciencemag.org/cgi/content/full/323/5918/1187
version of this article at:
including high-resolution figures, can be found in the online
Updated information and services,
http://www.sciencemag.org/cgi/content/full/323/5918/1187/DC1
can be found at:
Supporting Online Material
http://www.sciencemag.org/cgi/content/full/323/5918/1187#otherarticles
cites 33 articles
, 8 of which can be accessed for free:
This article
http://www.sciencemag.org/cgi/collection/atmos
Atmospheric Science
subject collections
:
This article appears in the following
http://www.sciencemag.org/about/permissions.dtl
in whole or in part can be found at:
this article
reprints
of this article or about obtaining
permission to reproduce
Information about obtaining
is a
Science
2009 by the American Association for the Advancement of Science; all rights reserved. The title
Copyright
American Association for the Advancement of Science, 1200 New York Avenue NW, Washington, DC 20005.
(print ISSN 0036-8075; online ISSN 1095-9203) is published weekly, except the last week in December, by the
Science
on February 27, 2009
www.sciencemag.org
12. D. Hsieh et al., Nature 452, 970 (2008).
13. S.-C. Zhang, T. H. Hansson, S. Kivelson, Phys. Rev. Lett. 62, 82 (1989).
14. F. Wilczek, Phys. Rev. Lett. 58, 1799 (1987). 15. J. D. Jackson, Classical Electrodynamics (Wiley, New York,
1999).
16. E. Witten, Phys. Lett. B 86, 283 (1979). 17. See supporting material on Science Online. 18. O. Madelung, U. Rössler, M. Schulz, in
Landolt-Börnstein, Substance/Property Index, Semiconductors, Non-Tetrahedrally Bonded Elements and Binary Compounds I, Subvolume III/17E-17F-41C (Springer, Berlin, 1998), pp. 1–11.
19. C. Castelnovo, R. Moessner, S. L. Sondhi, Nature 451, 42 (2008).
20. J. Leinaas, J. Myrheim, Nuovo Cim. B 37, 1 (1977). 21. F. Wilczek, Phys. Rev. Lett. 49, 957 (1982). 22. R. Jackiw, C. Rebbi, Phys. Rev. Lett. 36, 1116 (1976). 23. P. Hasenfratz, G. ’t Hooft, Phys. Rev. Lett. 36, 1119
(1976).
24. E. Fradkin, S. Kivelson, Nucl. Phys. B 474, 543 (1996).
25. C. Chamon et al., Phys. Rev. Lett. 100, 110405 (2008).
26. We thank O. M. Auslaender, T. L. Hughes, S. Kivelson, and L. Luan for insightful discussions. This work is
supported by the U.S. Department of Energy, Office of Basic Energy Sciences under contract DE-AC03-76SF00515.
Supporting Online Material
www.sciencemag.org/cgi/content/full/1167747/DC1 SOM Text
Figs. S1 to S5 References
27 October 2008; accepted 16 January 2009 Published online 29 January 2009; 10.1126/science.1167747
Include this information when citing this paper.
Global Cooling During the
Eocene-Oligocene Climate Transition
Zhonghui Liu,1,2* Mark Pagani,1* David Zinniker,1Robert DeConto,3Matthew Huber,4 Henk Brinkhuis,5Sunita R. Shah,6R. Mark Leckie,3Ann Pearson6About 34 million years ago, Earth’s climate shifted from a relatively ice-free world to one with glacial conditions on Antarctica characterized by substantial ice sheets. How Earth’s temperature changed during this climate transition remains poorly understood, and evidence for Northern Hemisphere polar ice is controversial. Here, we report proxy records of sea surface temperatures from multiple ocean localities and show that the high-latitude temperature decrease was substantial and heterogeneous. High-latitude (45 degrees to 70 degrees in both hemispheres) temperatures before the climate transition were ~20°C and cooled an average of ~5°C. Our results, combined with ocean and ice-sheet model simulations and benthic oxygen isotope records, indicate that Northern Hemisphere glaciation was not required to accommodate the magnitude of continental ice growth during this time.
T
he abrupt shift to glacial conditions near the Eocene-Oligocene (E-O) boundary ~33.7 million years ago (Ma) is character-ized by a ~+1.5 per mil (‰) change in oxygen isotopic (d18O) values of benthic foraminifera (1–3) in ~300,000 years, which is indicative of continential ice accumulation and high-latitude cooling, and an ~1-km deepening of the global calcite compensation depth (CCD) (2). Proposed causes for this fundamental change in Earth’s climate state include changes in ocean circulation due to the opening of Southern Ocean gateways (4), a decrease in atmospheric CO2(5–8), and a minimum in solar insolation (2).How Earth’s temperature changed during ice expansion is poorly defined, largely because ben-thic d18O records do not distinguish between ice volume and temperature. Deep-sea temperature records based on foraminiferal Mg/Ca ratios show little change during ice expansion (9–11). As a re-sult, benthic d18O records imply E-O ice volumes
that must be accommodated by Northern Hemi-sphere glaciation (2, 9, 12). This conclusion is nearly untenable given scant physical evidence for Northern Hemisphere ice sheets before the latest Miocene (7, 12–15). Deep-water forami-niferal Mg/Ca ratios could be affected by factors other than temperature (9, 11), including a deepen-ing of the CCD (2) and changes in deep-water
carbonate ion concentration that occurred during the E-O climate transition. Indeed, shallow-water Mg/Ca–based temperatures, from exceptionally well-preserved foraminifera deposited above the CCD, indicate ~2.5°C of cooling in the tropics (14, 15) and cast further suspicion on deep-water Mg/Ca–based temperatures across this major CCD deepening event.
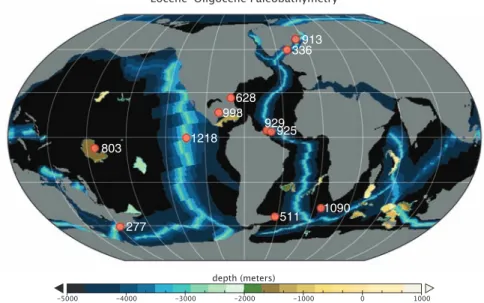
Here, we report E-O sea surface temperature (SST) changes, which were determined with alkenone unsaturation index (UK′
37) and tetrather index (TEX86) (16, 17), from 11 globally dis-persed ocean localities. These localities include Ocean Drilling Program/Deep Sea Drilling Project (ODP/DSDP) sites 277, 336, 511, 913, and 1090, with paleolatitudes between ~45° and 70° in both hemispheres (18), and sites 628, 803, 925, 929, 998, and 1218 in the tropics (Fig. 1 and table S1) (19). Chronologies for these sites were previously established or refined and/or determined in this study (table S2 and fig. S1). TEX86indices were converted to SST by use of a modified temper-ature calibration based on all published ocean surface sediment data (fig. S2) (20). Nonetheless, older calibrations would yield qualitatively similar results over the temperature ranges observed.
Both UK′
37and TEX86SSTs show substantial high-latitude cooling between ~34 and 33 Ma (Fig.
1Department of Geology and Geophysics, Yale University, New
Haven, CT 06520, USA.2Department of Earth Sciences,
Univer-sity of Hong Kong, Hong Kong, People’s Republic of China.
3Department of Geosciences, University of
Massachusetts-Amherst, Massachusetts-Amherst, MA 01003, USA.4Department of Earth
and Atmospheric Sciences, Purdue University, West Lafayette,
IN 47907, USA.5Laboratory of Palaeobotany and Palynology,
Utrecht University, Budapestlaan 4, 3584 CD Utrecht,
Nether-lands.6Department of Earth and Planetary Sciences, Harvard
University, Cambridge, MA 02138, USA.
*To whom correspondence should be addressed. E-mail: [email protected] (Z.L.); [email protected] (M.P.) 913 336 628 998 1218 803 277 1090 511 925 929
Fig. 1. Paleolocations of DSDP and ODP sites used in this study, superimposed on a map of reconstructed E-O bathymetry and geography (18).
on February 27, 2009
www.sciencemag.org
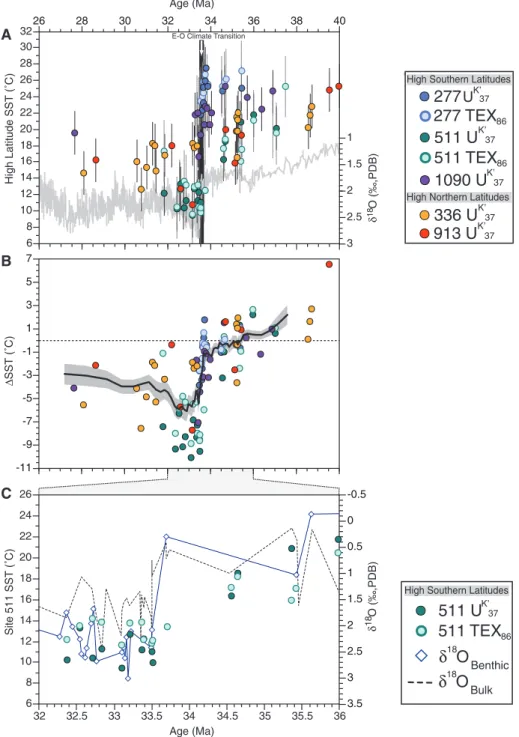
2). At sites 511 and 336, for which E-O transition records are relatively complete, SST cooled >5°C from the late Eocene to the early and mid-Oligocene, whereas maximum cooling at sites 277, 913, and 1090 occurred ~33.5 Ma. High-latitude cooling av-eraged ~4.8°C (using a direct average of all high-latitude data ranging from ~2° to ~8°C at individual sites) from the late Eocene (~34 to 37 Ma) to the earliest Oligocene (~33 to 34 Ma) (table S3 and fig. S4), or ~5.4°C at 33.4 Ma when determined by a 10-point running average of the combined high-latitude records (Fig. 2B). Our estimate of SSTcooling is most likely a minimum value, given that the full magnitude of SST change is probably not expressed because of low resolution, core gaps, and sediment hiatuses close to the E-O boundary (fig. S4).
In general, the timing and pattern of high-latitude SST reconstructions from the late Eocene to early and mid-Oligocene correlate well with benthic d18O changes (Fig. 2) (21, 22). SST reached the lowest values near the same time as the maximum d18O excursion at ~33.5 Ma, par-ticularly at site 511 (Fig. 2C). Given the resolution of our entire data set, high-latitude SST changes appear to be approximately synchronous with ben-thic d18O changes during the climate transition.
Our records also indicate that late Eocene high-latitude SST was substantially warmer than previous estimates. Before the E-O climate tran-sition (~34 to 37 Ma), high-latitude SST was ~20°C [T2.7°C for UK′
37and T3.7°C for TEX86 (19)] (Fig. 2A), which is ~10°C warmer than tem-peratures derived from benthic and planktonic d18O records from deep-sea cores (21, 23). Some lo-calities, such as site 277, exhibit extraordinarly warm SST, with temperatures reaching ~27°C. Differences between our records and benthic/ planktonic d18O records could be explained in various ways: diagenesis, seasonality, and/or lo-cations of deep-water production. Diagenesis could potentially alter both UK′
37(24) and TEX86(25) indices, resulting in temperature estimates warm-er than original SSTs. Howevwarm-er, thwarm-ere is no con-sistently strong evidence that UK′
37(24) or TEX86 (26) values are radically altered by diagenesis. In addition, diagenetic pathways differ for these two distinct proxies, yet SST estimates yield remark-ably similar results (Fig. 2A). Two relatively complete records from sites 511 and 336 indicate that the coldest early Oligocene UK′
37SST was only ~3° to 6°C warmer when compared with the same locations today (table S1). Although these warmer-than-modern temperatures are antici-pated for the early Oligocene, they also constrain warm-temperature biases introduced by diage-netic effects for Oligocene and late Eocene to smaller than 3° to 6°C. Finally, our late Eocene proxy records from the high latitudes are broadly consistent with other documented marine and terrestrial biotic changes (27, 28) and terrestrial temperature records (29, 30).
Discrepancies between foraminiferal d18O– and organic-based temperature estimates could also reflect differences in the locations of our sites
relative to deep-water sources as well as the season-ality of foraminifera versus organic production. Paired benthic and planktonic d18O records during this time show systematic offsets to at least 65°S, and SST gradients of 7° to 10°C between mid- to high-latitude sites such as 511 and 1090, and polar site 690 (23), indicating that deep-water formation
was probably focused across latitudes higher than those represented by our site localities. Further, benthic d18O values reflect deep-water production during winter months, whereas UK′
37 and TEX86 values capture mean annual SSTs that were prob-ably biased toward late spring/early autumn tem-peratures near the poles. Our model results also
E-O Climate Transition
6 8 10 12 14 16 18 20 22 24 26 28 30 32 H igh Latitude SST (˚C ) δ 18O (‰,PDB) Age (Ma) ∆ SST (˚C ) 3 2.5 2 1.5 1 -11 -9 -7 -5 -3 -1 1 3 5 7 32 32.5 33 33.5 34 34.5 35 35.5 36 Age (Ma) 6 8 10 12 14 16 18 20 22 24 26 Sit e 511 SST (˚C ) 3.5 3 2.5 2 1.5 1 0.5 0 -0.5 δ 18O (‰,PDB) 26 28 30 32 34 36 38 40
511 U
K’37511 TEX
86δ
18O
Benthicδ
18O
BulkHigh Southern Latitudes
277
UK’37277 TEX
86511 U
K’37511 TEX
861090 U
K’37336 U
K’37913 U
K’37 High Southern LatitudesHigh Northern Latitudes A
B
C
Fig. 2. High-latitude SST records during the late E-O. (A) SST reconstructions from five high-latitude sites. The gray line represents a composite benthic d18O record (21). SST calibration equations for UK′
37and TEX86are SST = (UK′37– 0.039)/0.034 (16) and SST = 50.47 – 16.33/TEX86, respectively (19). SST uncertainty is based on 1s SE of their respective calibration regressions (fig. S3). (B) Changes in SST represented as temperature deviations from mean values at each site before the E-O transition (~34 to 37 Ma). The solid black line represents a 10-point running average of SST changes from all high-latitude sites and yields ~5.4°C of cooling at 33.4 Ma. The shaded region brackets the SE of the 10-point running average. The dotted line marks zero SST change relative to the pre–E-O (~34 to 37 Ma) SST average. (C) A detailed comparison of UK′
37and TEX86SST values with d18O records of benthic foraminifera (22) and bulk carbonate during the E-O transition at site 511.
on February 27, 2009
www.sciencemag.org
show that it is possible to sustain ~20°C annual mean temperatures in mid- to high-latitude regions, with near-freezing winter temperatures in the polar
coastal waters that reflect deep-water formation re-gions (fig. S5). Recent evidence suggests that Mg/Ca and d18O SST estimates from well-preserved early
and late Eocene planktonic foraminifera are broadly consistent with TEX86estimates but ~10°C warmer than other d18O estimates from the tropics (14, 31) and high latitudes (32), suggesting that the primary planktonic d18O values (23) were altered by early diagenesis (31). Although our late Eocene SST es-timates from site 277 and probably site 1090 (Fig. 2A) appear particularly warm when compared with other high-latitude sites investigated here, they are in accord with early and mid-Eocene SST es-timates from New Zealand, based on the TEX86 proxy, Mg/Ca, and d18O values from extraordinarily well-preserved planktonic foraminifera (32). Thus, we suggest that our high-latitude estimates, because of biases introduced by diagenesis and seasonal production, are probably at the warm end of but remain close to the E-O mean annual tempera-tures. Physical interpretation of exceptional high-latitude warmth during the late Eocene remains an important challenge to climate scientists.
Compared with high-latitude E-O SST, tropical TEX86-SST records are more difficult to interpret. Tropical SST predominantly range between 27° to 31°C before ~34 Ma and after ~32 Ma. A brief interval (between ~33 to 34 Ma) of apparent colder temperatures is expressed in most of our tropical TEX86-SST records, with inferred temperature changes varying from 0° to 15°C (Fig. 3A). How-ever, such large tropical SST variations require physically improbable atmospheric and oceanic circulations when considered within the context of spatial temperature gradients that drive wind fields (8). Further, large tropical SST changes are unsupported by other tropical Mg/Ca-based SST reconstructions from well-preserved foraminifera (14, 15). Indeed, UK′
37values from sites 925 and 929 in the tropical Atlantic indicate temperatures >27°C and do not support the large temperature variability suggested by some of our TEX86records (Fig. 3B). Given these considerations, we suggest that large tropical TEX86perturbations do not solely record SST variations. Instead, extreme TEX86 values probably reflect changes in tropical water-column properties, associated with high-latitude surface cooling identified here, and variations in the population and production depths of Crenarchaeota (20, 33). If we consider only TEX86records with temperature variations constrained by coeval UK′
37 records (sites 925 and 929), tropical cooling does not appear to exceed ~3°C (table S3), which is consistent with other tropical temperature records (14, 15).
Our results affect interpretations of ice volume and the potential for Northern Hemisphere glacia-tion during the E-O climate transiglacia-tion. Ice-volume calculations, based on benthic d18O records, require an estimate of deep-ocean cooling. However, the full change in SST from sparsely sampled localities is not necessarily translated to abyssal depths. To evaluate how surface temperature change was translated into the deep ocean, we ran coupled atmosphere-ocean simulations with Eocene bound-ary conditions (8) and CO2levels representative of pre- and posttransition atmospheric mixing ratios (5, 6) (19). Model simulations reproduce ~5°C of
Age (Ma) 10 15 20 25 30 35 22 24 26 28 30 32 26 28 30 32 34 36 38 40 Lo w Latitude SST ( ˚C) Lo w Latitude SST ( ˚C)
E-O Climate Transition A B
925 TEX
86929 TEX
86803 TEX
86628 TEX
861218 TEX
86998 TEX
86 Tropical Atlantic925U
K’37929U
K’37 Tropical AtlanticFig. 3. Tropical SST records during the late E-O. (A) TEX86SST records from six tropical sites. (B) UK′37-SST records from sites 925 and 929. The TEX86proxy probably overestimates the magnitude of tropical SST changes because of tropical oceanographic perturbations associated with high-latitude cooling.
Fig. 4. Fully coupled E-O model results. The zonally and annually averaged temperature difference between the high and low partial pressure of CO2cases described in (19), representing late Eocene and early Oligocene conditions, is shown. Cooling is maximized in the equatorial upper thermocline below the mixed-layer, high-latitude oceans in the upper 2 km and in the abyss, predominately north of the equator. The vertical scale (in meters) is stretched.
on February 27, 2009
www.sciencemag.org
high-latitude cooling consistent with our data, a 3.8°C volumetric-mean ocean cooling, and global-mean surface cooling of 4.4°C (Fig. 4). The model provides clear evidence of spatially heterogenous benthic cooling, averaging ~4°C (that is, somewhat less than the surface temperature change). How-ever, because (i) these model simulations do not account for temperature feedbacks related to grow-ing ice sheets and (ii) our estimate of ~5°C of high-latitude cooling might represent a minimum value, model results for deep-water temperature change also potentially slightly underestimate the magni-tude of cooling. Therefore, the combination of our model and proxy results provides a range between 3° and 5°C of benthic cooling during the E-O climate transition, with our best estimate converg-ing on 4°C.
Assuming that the average d18O value of Oligocene Antarctic ice sheets was ~20 ‰ more positive relative to today (an assumption that max-imizes ice-volume estimates) (34), the growth of continental ice implied by a +1.5 ‰ shift in benthic d18O and a benthic cooling of 3° to 5°C is between ~10 × 106and 30 × 106km3. This estimate is equivalent to ~50 to 140% of the volume of a simulated early Oligocene East Antarctic ice sheet (5, 34) or ~40 to 120% of modern Antarctic ice volume and 30 to 100% of Antarctic ice volume during the Last Glacial Maximum. Although our results do not contradict evidence of small lo-calized glaciers in the northern high latitudes (13), estimated ice volumes could be easily accommo-dated on Antarctica alone (34) and do not require Northern Hemisphere glaciation (12) to explain the magnitude of the benthic d18O shift. Finally, between ~33 and 34 Ma, our data support a pattern of systematic cooling in both the northern and south-ern high latitudes (Fig. 2A) that was approximately in phase with benthic d18O changes (Fig. 2C)—a
temporal pattern also observed in other tropical records (14, 15). These results are consistent with a scenario of global cooling forced by a reduction in greenhouse gas concentration rather than the more regionalized effects of ocean gateways (5–8).
References and Notes
1. K. G. Miller, R. G. Fairbanks, G. S. Mountain, Paleoceanography 2, 1 (1987).
2. H. K. Coxall, P. A. Wilson, H. Palike, C. H. Lear, J. Backman, Nature 433, 53 (2005).
3. N. J. Shackleton, J. P. Kennett, Initial Rep. Deep Sea Drill. Proj. 29, 743 (1975).
4. J. P. Kennett, J. Geophys. Res. 82, 3843 (1977). 5. R. M. DeConto, D. Pollard, Nature 421, 245 (2003). 6. M. Pagani, J. C. Zachos, K. H. Freeman, B. Tipple,
S. Bohaty, Science 309, 600 (2005).
7. R. DeConto, D. Pollard, D. Harwood, Paleoceanography 22, Pa3214 (2007).
8. M. Huber, D. Nof, Palaeogeogr. Palaeoclimatol. Palaeoecol. 231, 9 (2006).
9. C. H. Lear, Y. Rosenthal, H. K. Coxall, P. A. Wilson, Paleoceanography 19, Pa4015 (2004).
10. C. H. Lear, H. Elderfield, P. A. Wilson, Science 287, 269 (2000).
11. K. Billups, D. P. Schrag, Earth Planet. Sci. Lett. 209, 181 (2003).
12. A. K. Tripati et al., Earth Planet. Sci. Lett. 265, 112 (2008).
13. J. S. Eldrett, I. C. Harding, P. A. Wilson, E. Butler, A. P. Roberts, Nature 446, 176 (2007). 14. C. H. Lear, T. R. Bailey, P. N. Pearson, H. K. Coxall,
Y. Rosenthal, Geology 36, 251 (2008). 15. M. E. Katz et al., Nat. Geosci. 1, 329 (2008). 16. F. G. Prahl, L. A. Muehlhausen, D. L. Zahnle, Geochim.
Cosmochim. Acta 52, 2303 (1988). 17. S. Schouten, E. C. Hopmans, E. Schefuss,
J. S. Sinninghe Damsté, Earth Planet. Sci. Lett. 204, 265 (2002).
18. R. D. Müller, M. Sdrolias, C. Gaina, B. Steinberger, C. Heine, Science 319, 1357 (2008).
19. Materials and methods are available as supporting material on Science Online.
20. J.-H. Kim, S. Schouten, E. C. Hopmans, B. Donner, J. S. Sinninghe Damsté, Geochim. Cosmochim. Acta 72, 1154 (2008).
21. J. Zachos, M. Pagani, L. Sloan, E. Thomas, K. Billups, Science 292, 686 (2001).
22. J. P. Muza, D. F. Williams, S. W. Wise, Initial Rep. Deep Sea Drill. Proj. 71, 409 (1983).
23. J. C. Zachos, L. D. Stott, K. C. Lohmann, Paleoceanography 9, 353 (1994).
24. J. O. Grimalt et al., Geochem. Geophys. Geosys. 1, 2000GC000053 (2000).
25. S. R. Shah, G. Mollenhauer, N. Ohkouchi, T. I. Eglinton, A. Pearson, Geochim. Cosmochim. Acta 72, 4577 (2008). 26. S. Schouten, E. C. Hopmans, J. S. Sinninghe Damsté, Org.
Geochem. 35, 567 (2004).
27. H. Brinkhuis, H. Visscher, Soc. Econ. Paleontol. Mineral. Spec. Publ. 54, 295 (1995).
28. D. R. Prothero, T. H. Heaton, Palaeogeogr. Palaeoclimatol. Palaeoecol. 127, 257 (1996). 29. S. Schouten et al., Geology 36, 147 (2008). 30. A. Zanazzi, M. J. Kohn, B. J. MacFadden, D. O. Terry,
Nature 445, 639 (2007).
31. P. N. Pearson et al., Geology 35, 211 (2007). 32. C. J. Hollis et al., Geology 37, 99 (2009). 33. C. Turich et al., Geochim. Cosmochim. Acta 71, 3272
(2007).
34. R. M. DeConto et al., Nature 455, 652 (2008). 35. The authors thank S. Schouten and E. Hopmans for their
assistance in establishing an interlaboratory calibration, J. Eldrett for advice on the site 913 age model, M. Woodruff of the University of Massachussetts Stable Isotope Facility for analyses of site 511 material, and Integrated Ocean Drilling Program for providing samples. The reviews of P. Wilson and one anonymous referee greatly improved the manuscript. This work was supported by a postdoctoral fellowship provided by Yale University and a Major Research Instrumentation grant from NSF. Computing was performed on Rosen Center for Advanced Computing resources within Information Technology at Purdue. M.H.’s contribution is partially supported by the New Zealand’s Global Change Through Time Programme at GNS Science.
Supporting Online Material
www.sciencemag.org/cgi/content/full/323/5918/1187/DC1 Materials and Methods
Figs. S1 to S5 Tables S1 to S3 References
24 September 2008; accepted 23 January 2009 10.1126/science.1166368
Seeing the Fermi Surface in
Real Space by Nanoscale
Electron Focusing
Alexander Weismann,1,2Martin Wenderoth,1* Samir Lounis,3Peter Zahn,4Norbert Quaas,1 Rainer G. Ulbrich,1Peter H. Dederichs,3Stefan Blügel3
The Fermi surface that characterizes the electronic band structure of crystalline solids can be difficult to image experimentally in a way that reveals local variations. We show that Fermi surfaces can be imaged in real space with a low-temperature scanning tunneling microscope when subsurface point scatterers are present: in this case, cobalt impurities under a copper surface. Even the very simple Fermi surface of copper causes strongly anisotropic propagation
characteristics of bulk electrons that are confined in beamlike paths on the nanoscale. The induced charge density oscillations on the nearby surface can be used for mapping buried defects and interfaces and some of their properties.
T
he coherent propagation of electrons in solids is central for a variety of phenome-na that are at the core of modern physics. Scanning tunneling microscopy (STM) has beenused to manipulate atoms and create structures that allow standing electron wave patterns to be visualized (1). C. R. Moon et al. (2) extended this line of investigations to the retrieval of
quantum-phase information in nanostructures with the scanning tunneling microscope. Another facet of electron propagation has been revealed by measurements (3) of exchange interaction be-tween adatoms and wires mediated through the Ruderman-Kittel-Kasuya-Yosida (RKKY) mech-anism (4) on a platinum surface. All of these effects depend on a fundamental property of the electron sea: It rearranges itself to minimize the disturbance caused by foreign atoms. These Friedel oscillations (5) may cause technologi-cally important effects such as the formation of diluted magnetic semiconductors, spin-glasses, or the interlayer exchange coupling between netic layers (6) exploited in read heads of mag-netic hard discs.
1IV Physikalisches Institut, Universität Göttingen, 37077
Göttingen, Germany.2Courant Research Center Göttingen,
37077 Göttingen, Germany.3Institut für Festkörperforschung
and Institut for Advanced Simulation, Forschungszentrum
Jülich, 52425 Jülich, Germany.4Fachbereich Physik,
Martin-Luther-Universität Halle-Wittenberg, 06099 Halle, Germany. *To whom correspondence should be addressed. E-mail: [email protected]