Analytical and Bioanalytical Chemistry
Electronic Supplementary Material
Effects of an iron-based fuel-borne catalyst and a diesel particle filter on
exhaust toxicity in lung cells in vitro
Sandro Steiner, Jan Czerwinski, Pierre Comte, Norbert V. Heeb, Andreas Mayer, Alke Petri-Fink, Barbara Rothen-Rutishauser
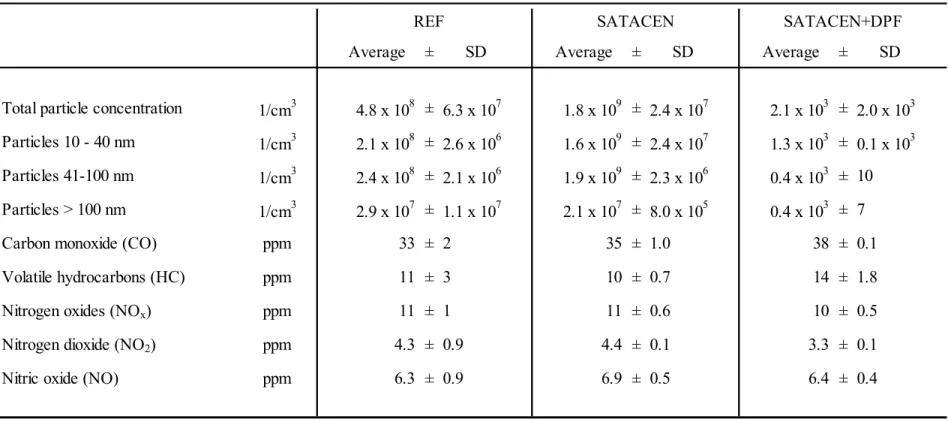
Average ± SD Average ± SD Average ± SD
Total particle concentration 1/cm3
4.8 x 10⁸ ± 6.3 x 10⁷ 1.8 x 10⁹ ± 2.4 x 10⁷ 2.1 x 10³ ± 2.0 x 10³ Particles 10 - 40 nm 1/cm3 2.1 x 10⁸ ± 2.6 x 10⁶ 1.6 x 10⁹ ± 2.4 x 10⁷ 1.3 x 10³ ± 0.1 x 10³ Particles 41-100 nm 1/cm3 2.4 x 10⁸ ± 2.1 x 10⁶ 1.9 x 10⁹ ± 2.3 x 10⁶ 0.4 x 10³ ± 10 Particles > 100 nm 1/cm3 2.9 x 10⁷ ± 1.1 x 10⁷ 2.1 x 10⁷ ± 8.0 x 10⁵ 0.4 x 10³ ± 7
Carbon monoxide (CO) ppm 33 ± 2 35 ± 1.0 38 ± 0.1
Volatile hydrocarbons (HC) ppm 11 ± 3 10 ± 0.7 14 ± 1.8
Nitrogen oxides (NOx) ppm 11 ± 1 11 ± 0.6 10 ± 0.5
Nitrogen dioxide (NO2) ppm 4.3 ± 0.9 4.4 ± 0.1 3.3 ± 0.1
Nitric oxide (NO) ppm 6.3 ± 0.9 6.9 ± 0.5 6.4 ± 0.4
Table S1: Exhaust characterization. Particle concentrations and concentrations of gaseous exhaust components in the ten-fold diluted exhaust, listed as average ± standard deviation.
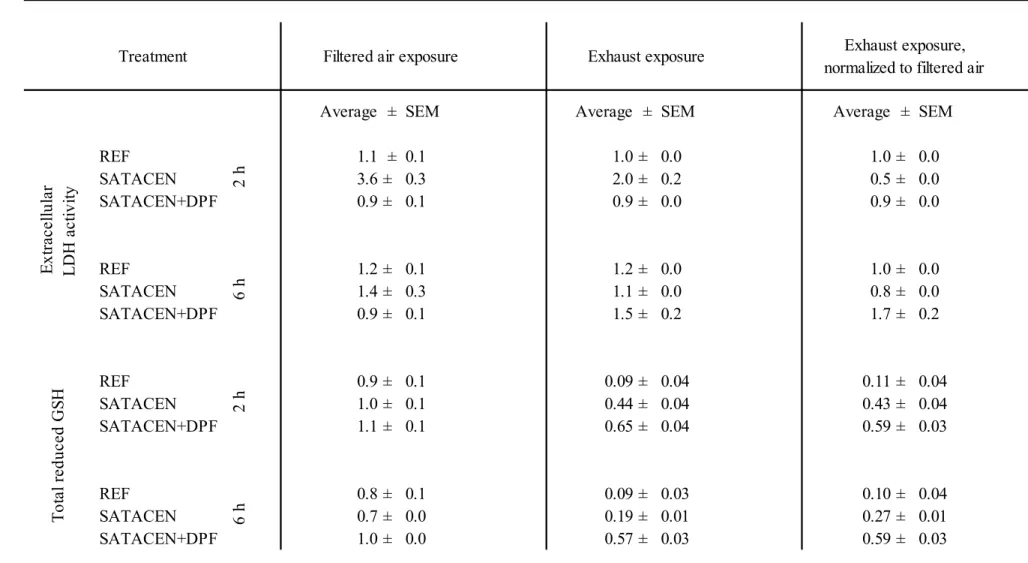
Average ± SEM Average ± SEM Average ± SEM REF 1.1 ± 0.1 1.0 ± 0.0 1.0 ± 0.0 SATACEN 3.6 ± 0.3 2.0 ± 0.2 0.5 ± 0.0 SATACEN+DPF 0.9 ± 0.1 0.9 ± 0.0 0.9 ± 0.0 REF 1.2 ± 0.1 1.2 ± 0.0 1.0 ± 0.0 SATACEN 1.4 ± 0.3 1.1 ± 0.0 0.8 ± 0.0 SATACEN+DPF 0.9 ± 0.1 1.5 ± 0.2 1.7 ± 0.2 REF 0.9 ± 0.1 0.09 ± 0.04 0.11 ± 0.04 SATACEN 1.0 ± 0.1 0.44 ± 0.04 0.43 ± 0.04 SATACEN+DPF 1.1 ± 0.1 0.65 ± 0.04 0.59 ± 0.03
Filtered air exposure Exhaust exposure Exhaust exposure, normalized to filtered air
Table S2: Biological responses measured upon filtered air exposure and upon exposure to ten-fold diluted exhausts, listed in non-normalized form and as normalized to the filtered air exposure (filtered air exposure = 1). REF: exhaust produced from reference diesel (low sulfur petrodiesel), REF-S: exhaust produced from reference diesel additized with 40 ppm Satacen®3. REF-SF: exhaust produced from additized fuel, filtered by silicon carbide DPF
Treatment E xt ra ce llu la r L D H a ct iv ity ce d G SH 2 h 6 h 2 h
Average ± SEM Average ± SEM Average ± SEM REF 1 ± 0 25.7 ± 4.7 25.7 ± 4.7 SATACEN 1 ± 0 21.5 ± 5.6 21.5 ± 5.6 SATACEN+DPF 1 ± 0 22.2 ± 3.9 22.2 ± 3.9 REF 1 ± 0 34.0 ± 7.0 34.0 ± 7.0 SATACEN 1 ± 0 21.5 ± 5.6 41.3 ± 18.1 SATACEN+DPF 1 ± 0 4.6 ± 1.5 4.6 ± 1.5 REF 1 ± 0 1.8 ± 1.4 1.8 ± 1.4 SATACEN 1 ± 0 0.9 ± 0.4 0.9 ± 0.4 SATACEN+DPF 1 ± 0 0.8 ± 0.2 0.8 ± 0.2 REF 1 ± 0 2.0 ± 1.6 2.0 ± 1.6 SATACEN 1 ± 0 13.7 ± 11.0 13.7 ± 11.0 SATACEN+DPF 1 ± 0 1.0 ± 0.8 1.0 ± 0.8
Treatment Filtered air exposure Exhaust exposure Exhaust exposure,
normalized to filtered air
no rm al iz ed a m ou nt o f H M O X 1 m RN A no rm al iz ed a m ou nt o f TNF m RN A 2 h 6 h 2 h 6 h Table S2, continued
Average ± SEM Average ± SEM Average ± SEM REF 1 ± 0 2.7 ± 2.9 2.7 ± 2.9 SATACEN 1 ± 0 1.5 ± 0.8 1.5 ± 0.8 SATACEN+DPF 1 ± 0 1.4 ± 0.4 1.4 ± 0.4 REF 1 ± 0 3.1 ± 1.8 3.1 ± 1.8 SATACEN 1 ± 0 7.2 ± 8.0 7.2 ± 8.0 SATACEN+DPF 1 ± 0 2.7 ± 0.2 2.7 ± 0.2 REF 3.1 ± 0.7 ng/ml 4.0 ± 1.1 ng/ml 1.3 ± 0.3 SATACEN 1.5 ± 0.3 ng/ml 1.5 ± 0.1 ng/ml 1.0 ± 0.1 SATACEN+DPF 1.4 ± 0.2 ng/ml 1.8 ± 0.2 ng/ml 1.2 ± 0.1 REF 5.7 ± 1.0 ng/ml 7.1 ± 1.6 ng/ml 1.3 ± 0.3 SATACEN 4.3 ± 0.3 ng/ml 2.5 ± 0.1 ng/ml 0.6 ± 0.0 SATACEN+DPF 2.3 ± 0.1 ng/ml 4.5 ± 0.3 ng/ml 2.0 ± 0.1 no rm al iz ed a m ou nt o f IL -8 m RN A E xt ra ce llu la r T N F-α co nc en tra tio n 2 h 6 h 2 h 6 h Treatment Table S2, continued
Filtered air exposure Exhaust exposure Exhaust exposure, normalized to filtered air
Average ± SEM Average ± SEM Average ± SEM REF 1.4 ± 0.1 ng/ml 1.7 ± 0.3 ng/ml 1.2 ± 0.2 SATACEN 1.3 ± 0.1 ng/ml 1.3 ± 0.1 ng/ml 1.0 ± 0.1 SATACEN+DPF 1.0 ± 0.1 ng/ml 0.9 ± 0.1 ng/ml 0.9 ± 0.1 REF 1.4 ± 0.1 ng/ml 1.6 ± 0.3 ng/ml 1.2 ± 0.2 SATACEN 1.5 ± 0.1 ng/ml 1.2 ± 0.1 ng/ml 0.8 ± 0.0 SATACEN+DPF 1.0 ± 0.0 ng/ml 1.2 ± 0.0 ng/ml 1.3 ± 0.0
Treatment Filtered air exposure Exhaust exposure Exhaust exposure,
normalized to filtered air Table S2, continued E xt ra ce llu la r IL -8 co nc en tra tio n 6 h 2 h
TA100
average ± SD average ± SD average ± SD average ± SD negative control 4.4 ± 2.3 1.9 ± 3.1 5.3 ± 2.1 8.0 ± 4.8 2 h 5.9 ± 2.0 7.0 ± 5.2 7.1 ± 2.2 5.9 ± 3.4 4 h 8.5 ± 3.4 26.1 ± 13.3 11.3 ± 4.8 9.9 ± 6.8 6 h 13.1 ± 5.1 37.3 ± 12.6 15.3 ± 12.2 8.9 ± 4.7 2 h 1.3 3.7 1.3 1.0 4 h 1.9 13.6 2.1 1.2 6 h 3.0 19.4 2.9 1.1TA98
negative control 1.6 ± 3.1 0.6 ± 1.4 1.9 ± 3.6 0.3 ± 0.6 2 h 1.1 ± 1.0 0 ± 0 0.9 ± 0.8 0.9 ± 1.0 4 h 0.8 ± 1.0 0 ± 0 1.4 ± 2.1 0.8 ± 0.5 6 h 2.0 ± 2.4 0 ± 0 1.0 ± 2.1 2.0 ± 1.1 nu m be r of re ve rt an ts ct io n tiv e l fo ld in du ct io n ov er ne ga tiv e co nt ro lTable S3: Absolute number of revertants fomed upon exhaust exposure in Salmonella typhimuruim strin TA100 and TA98 and fold induction of revertant formation over baseline (number upon exhaust exposure divided by number in negative control). A fold induction of 3 or higher indicates mutagenicity. SATACEN+DPF SATACEN DPF REF nu m be r of re ve rt an ts