HAL Id: halshs-01854291
https://halshs.archives-ouvertes.fr/halshs-01854291
Preprint submitted on 6 Aug 2018
HAL is a multi-disciplinary open access
archive for the deposit and dissemination of sci-entific research documents, whether they are pub-lished or not. The documents may come from teaching and research institutions in France or abroad, or from public or private research centers.
L’archive ouverte pluridisciplinaire HAL, est destinée au dépôt et à la diffusion de documents scientifiques de niveau recherche, publiés ou non, émanant des établissements d’enseignement et de recherche français ou étrangers, des laboratoires publics ou privés.
Distributed under a Creative Commons Attribution - NonCommercial - ShareAlike| 4.0 International License
Firm-Level Labor Demand for and Macroeconomic
Increases in Non-Regular Workers in Japan
Hiroshi Teruyama, Yasuo Goto, Sebastien Lechevalier
To cite this version:
Hiroshi Teruyama, Yasuo Goto, Sebastien Lechevalier. Firm-Level Labor Demand for and Macroeco-nomic Increases in Non-Regular Workers in Japan. 2018. �halshs-01854291�
INCAS
DP Series
Discussion Paper Series 2018 #07
I N C A S
Understanding institutional change in Asia: a comparative perspective with Europe
http://incas.hypotheses.org/
This work has received funding from the European Union’s Horizon 2020 research and innovation programme under the Marie Skłodowska-Curie grant agreement No 645763.
Firm-Level Labor Demand for and Macroeconomic Increases in
Non-Regular Workers in Japan
July 2018 Hiroshi Teruyama
Kyoto University, Kyoto, Japan
Yasuo Goto
Seijo University and the Research Institute of Economy, Trade and Industry, Tokyo, Japan
Sebastien Lechevalier
ABOUT THE INCAS PROJECT
INCAS is a Marie Skłodowska-Curie Actions R.I.S.E funded project under the European Commission’s
H2020 Programme.
The project INCAS aims at creating a top-level research and advanced training network on institutional
change in Asia, in comparative perspective with Europe.
The coordinator, Ecole des Hautes Etudes en Sciences Sociales (France), promotes this network together
with Oxford University (UK), Freie Universität Berlin (Germany), and in collaboration with Waseda
Uni-versity (Japan). The aim of the proposed mobility scheme is to give birth to a European consortium and
network of faculties and advanced graduate students specialized in the comparative analysis of
institutio-nal change in Asia and Europe. The partners have chosen Japan as a reference point because of its
com-parability with Europe as shown by previous studies, its historical influence on development and further
institutional changes in Asia, and the expertise accumulated within our research team.
Analyzing current economic dynamics in Japan and later expanding this analysis to other Asian countries
promises to generate insights that might be help to better understand challenges for Europe and to prepare
relevant policy proposals. Our purpose is to compare the results obtained in the case of Japan and few
other Asian countries (South Korea, Taiwan, China, and possibly Thailand, after having checked the data
availability), not only to previous results on Europe but also to original results we will get on European
countries (primarily France – which will be our reference country in Europe – and then the UK, Germany,
and Italy) in mobilizing new historical data and applying our theoretical framework.
INCAS DP
SERIES / 2018 #07
Firm-Level Labor Demand for and Macroeconomic Increases in
Non-Regular Workers in Japan
Hiroshi Teruyama
Kyoto University, Kyoto, Japan
Yasuo Goto
Seijo University and the Research Institute of Economy, Trade and Industry, Tokyo, Japan
Sebastien Lechevalier
École des hautes études en sciences sociales, Paris, France
Abstract
The purpose of this study is to account for the increase in non-regular workers, namely, part-time and dispatched workers, in the Japanese econ¬omy from the early 2000s. Our contribution is that we use a firm-level panel dataset extracted from an administrative survey and distinguish between the short-run and long-run determinants of non-regular labor de¬mand. Using the estimated parameters of the labor demand function, we decompose the rate of increase in the macroeconomic non-regular worker ratio into determinant factor contributions. Our major results can be summarized as follows. First, the firm-level determinants of the demand for part-time and dispatched workers significantly differ. Second, our re¬sults suggest that the non-regular job creation stimulated by the increased female labor supply plays an essential role relative to direct demand-side factors. Third, the microeconomic demand conditions for non-regular la¬bor are widely dispersed among firms. Neither the demand factors exam¬ined in this study nor industrial differences can explain this heterogeneity.
Keywords
Non-Regular Employment, Part-Time Workers, Dispatched Workers, Firm-Level Labor Demand, Female Labor Supply, Japan
JEL Classification
J22, J23, D22
Acknowledgment
Corresponding author: H. Teruyama; email: teruyama@kier.kyoto-u.ac.jp. H. Teruyama and Y. Goto’s research received financial support from the Japan Society for the Promotion of Science (JSPS KAKENHI Grant Numbers 16H03631 and 26285068 and JSPS Core-to-Core Program, A. Advanced Research Networks), and we would like to acknowledge it. S. Lechevalier wishes to acknowledge that this work has received funding from the European Union’s Horizon 2020 Research and Innovation Programme under the Marie Skllodowska-Curie grant agreement No 645763. We are grateful to the participants in the 2017 SASE meeting (Lyon University, June) and the 2016 and 2017 INCAS workshops (Waseda University, September 2016; Oxford University, May 2017) for their critical comments that helped us improve the paper. The usual caveats apply.
INCAS DP
SERIES / 2018 #07
1. Introduction
Although the size of the increase depends on the definition considered (e.g., contract length, working hours, or title used by the workplace), non-regular employment in Japan has clearly experienced an overall increase since the mid-1980s. For example, if regular employment is defined based on the title used by the workplace, the share of non-regular workers among total employees was 20 percent in 1990, 25 percent in 2000, and 35 percent in 2010 (see, e.g., Kitagawa et al., 2018).
Many studies have already addressed this issue; among the most recent stud ies, we may cite Kitagawa et al. (2018) or Kambayashi (2018). However, studies examining the causes of the increase in non-regular employment are relatively scarce, and there is no consensus view of the factors driving this increase. Sev eral reasons related to both labor supply and demand have been suggested. The increase in female labor-force participation, uncertainty surrounding product demand, and the introduction of information and communication technologies have all contributed to firms’ increased usage of non-regular workers, although their respective quantitative contributions are still a matter of empirical debate (Asano et al., 2013). However, it is less well known that the overall increase in the use of non-regular workers is not evenly distributed across all firms or establishments. Instead, non-regular workers are concentrated in some specific firms or establishments (see, for example, Kalantzis et al., 2012) and a better understanding of this stylized fact and its implications is required.
This study tries to identify the sources of non-regular employment growth at the firm level, considering the importance of heterogeneity in individual firms’ labor demand. To this end, we use a comprehensive government survey on corporate behavior, the “Basic Survey of Japanese Business Structure and Ac tivities” (the BSBSA, hereafter), to estimate the firm-level demand function for non-regular workers. This survey contains extensive information on corporate governance and finance. Taking advantage of the rich information contained in the survey, we investigate various determinants of regular worker demand from short-run and long-run perspectives, and we distinguish between two types of non-regular workers: part-time and dispatched workers. Then, we apply the firm-level results to a factor decomposition of the macroeconomic growth in non-regular employment and try to identify the primary source of the economy wide increase in non-regular employment. We also find a large dispersion in non-regular labor demand at the firm level and we examine the sources of this heterogeneity.
Whereas most studies interested in non-regular workers use surveys of em ployees, we use an administrative firm survey, which allows us to focus on the corporate characteristics that may explain the diverse use of non-regular work-ers. Our major results can be summarized as follows. First, the firm-level determinants of the demand for part-time and dispatched workers significantly differ. Second, our results suggest that the non-regular job creation stimulated by the increased supply of female labor plays an essential role relative to direct demand-side factors. Third, the microeconomic demand conditions for non regular labor are widely dispersed among firms. Neither the demand factors examined in this study nor industrial differences can explain this heterogeneity.
The remainder of this paper proceeds as follows. Section 2 reviews the aggre gate transition and firm-level distribution of non-regular employment. Section 3 presents the empirical model of the non-regular worker demand function with various short-run and long-run determinants. Then, the importance of these determinants is examined based on the estimation results. Section 4 decom poses the factors of aggregate non-regular employment growth to find the major causes, and it investigates the sources of non-regular demand heterogeneity at the firm level. Section 5 concludes.
INCAS DP
SERIES / 2018 #07
2. Overview of the non-regular employment move ment in the BSBSA
The expansion of the non-regular worker sector is a prominent phenomenon in the Japanese labor market. Several characteristics define non-regular employ ment, as discussed in Kambayashi (2013), for example. The externally identi-fiable simplex standards used for defining non-regular employment are working hours and contract length. Comparing several government labor surveys, we can see that the share of short-term contract workers among total employed workers has been stable around 15 percent, whereas that of part-time work ers increased steadily from 20 to 30 percent from 2000 to the middle of the 2010s. These surveys also show that the size of the part-time worker population roughly corresponds to 80 percent of that of workers termed “non-regular” by their workplaces, which is the widest definition of non-regular workers with var ious types of contracts. This fact suggests that a large fraction of non-regular workers are part-time workers. Thus, to consider the increase in non-regular workers, it is essential to investigate the part-time employment transition.1
Despite the increasing social interest in this issue, comprehensive studies on the source of the growth in non-regular employment are scarce. An exception is the informative empirical research by Asano et al. (2013). First, consider ing the potential importance of the growth in the female labor supply and the
service industry sector to the non-regular employment expansion, they exam ine the compositional effects of the demographic and industrial structure using micro-data from government labor surveys. They find that these compositional changes can explain only a small part of the increase in non-regular workers. Thus, majority of the increase occurs within demographics or industry sectors. Second, they focus on the demand of individual firms for non-regular workers using firm-level panel data, which is also used in this study and is explained below. They examine the effects of sales uncertainty and information and com munication technology (ICT) use and find that these factors are determinants of individual firms’ demand for non-regular workers but can explain only a rel atively small part of this demand. They conclude that the factors that they examine explain about one quarter of the increase in non-regular workers.
Asano et al. (2013) highlight the importance of individual factors for the growth in non-regular employment. In consideration of their remarkable finding, this study focuses on individual firms’ demand for non-regular workers and pushes their study further, although we use a different method.
To investigate individual firms’ non-regular labor demand behavior, a panel dataset containing information on both employed (or accepted) non-regular workers and firms’ management is indispensable. However, such datasets are scarce in Japan. On one hand, corporate finance data based on securities re ports, which are widely used in empirical studies on firm behavior in Japan, contain insufficient information on non-regular workers. On the other hand, several government labor surveys at the establishment level contain rich in formation on the types and numbers of non-regular workers but contain very limited information on firms’ management and corporate finance.
Currently available survey data with sufficient information on both non regular workers and their workplaces can be found in the BSBSA conducted by the Ministry of Economy, Trade, and Industry (METI). The BSBSA is an annual survey that contains data on the diversification, globalization, and in formatization of Japanese firms, and it is generally used by the METI to inform and learn from its own economic policymaking. The survey’s scope covers firms with 50 or more employees whose paid-up capital or investment is higher than 30 million yen in industries including mining, manufacturing, wholesale and retail trade, food services, and many other service industries. Although the BSBSA does not include data from micro-enterprises, it addresses a large range of firms and has a sample size of around 30,000 firms in each year. This feature pro-vides a strong advantage in the context of our research, and the survey is used throughout this study.
The BSBSA reports the number of workers classified by their employment types. The classification consists of five categories, as follows. First, normal workers are those with contract lengths over one month or employed over sev-enteen days in the last two months in the survey year. These restrictions on contract or employment length are aimed
1. For example, Kitagawa et al. (2018) show the composition of the non-regular worker population according to these characteristics using the the Labour Force Survey (Ministry of Internal Affairs and Communications) and the Monthly Labour Survey (Ministry of Health, Labour, and Welfare). In these surveys, part-time workers are defined as those with under 35 weekly working hours, and temporary and daily (i.e., short-term) workers are defined as those on contracts of no more than a year.
Note that these three definitions (i.e., contract-length, working-hours, and workplace-title definitions) are not mutually exclusive, and one definition does not subsume the other def¬initions, as examined by Kambayashi (2017). Thus, part-time workers are not a subset of workplace-title non-regular workers, that is, there are part-time workers identified as reg¬ular workers by their workplaces. However, referring to the details of the workplace-title non-regular workers in the Labour Force Survey, we find that the share of workplace-title part-time workers has been about 70 percent of workplace-title non-regular workers since the 2000s. Part-time workers predominate among non-regular workers irrespective of definitions.
INCAS DP
SERIES / 2018 #07
to distinguish these workers from short-term workers, defined as temporary workers below. Second, regular work ers are those classified as such in their workplaces among normal workers.2 Third, part-time workers are those normal workers whose scheduled working hours or working days a week are less than those of regular workers. The sum of regular and part-time workers does not equal the number of normal workers in a considerable number of firms. Thus, in such firms, there exist full-time workers who are not regarded as regular workers (e.g., some of them may be full-time workers with fixed contract lengths). No further information about such non-regular workers is reported in the BSBSA. Fourth, temporary workers are those employed daily or with fixed contract lengths of not more than one month. Fifth, dispatched workers are those employed by a temporary labor agency and commanded by a client firm to engage in a firm’s work.
The types of non-regular workers that we can distinguish based on the BSBSA’s worker definition are part-time, dispatched, and temporary workers. Among them, pat-time and dispatched workers are the non-regular workers considered in this study, and they are the essential types for the non-regular employment analysis. As mentioned above, part-time workers account for a large fraction of non-regular workers. Although the share of dispatched workers is smaller than that of part-time workers, we do need to keep them in mind. In Japan, labor market deregulation has advanced regarding dispatched work ers (i.e., through the amendments to the Temporary Work Agency Law), as described, for example, by Watanabe (2014). Dispatched workers are typical non-regular workers used for employment adjustments on the margin. Their employment is sensitive to business cycle conditions. In particular, a jump in terminations of dispatched worker contracts after the global financial crisis in 2008 attracted public concern as a symbolic event revealing unstable non-regular employment.3
The sample period is from 2000 to 2014 throughout this study.4 Although the BSBSA begins in the middle of the 1990s, the number of dispatched workers and some of the variables we use are only available after 2000.
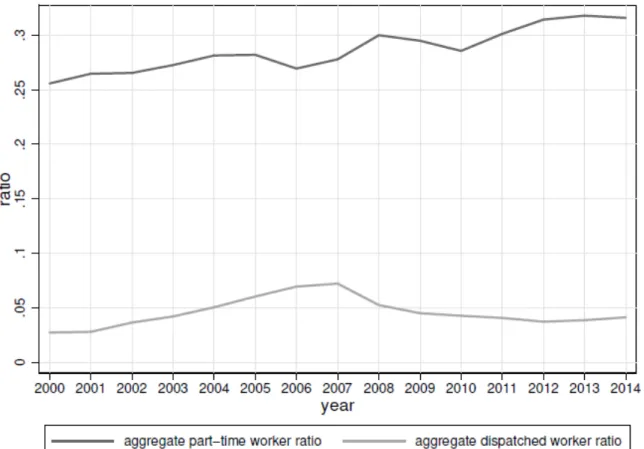
We now illustrate these non-regular worker dynamics in the BSBSA. Figure 1 shows the economy-wide movements of non-regular workers. The aggregate part-time worker ratio is the ratio of the total number of part-time workers to the total number of workers aggregated over all firms in the sample in each survey year. The total number of workers is the sum of the numbers of normal, dispatched, and temporary workers.5 The aggregate dispatched worker ratio is defined in the same way.
The aggregate part-time worker ratio is steadily increasing from 25 percent to more than 30 percent, but it fluctuates moderately in the latter half of the 2000s. This BSBSA part-time worker ratio is higher by a few percentage points than the economy-wide ratio based on the published government data mentioned at the beginning of this section. Government surveys generally distinguish part-time workers as those working below 35 hours in a week. On the other hand, the BSBSA’s definition of part-time workers, as mentioned above, is broader and includes those with more than 35 weekly working hours but fewer than full working hours. This difference might be a reason for the gap between the part-time worker ratios in the BSBSA and those found using other representative government statistics. In addition, since the BSBSA does not cover small firms, this gap suggests that the employment of part-time workers is mildly biased toward larger firms.
By comparison, the aggregate dispatched worker ratio is much lower and more stable; it varies from three to seven percent and peaks in 2007. This transition pattern traces well that of the economy-wide dispatched workers ratio based on government statistics.6 However, the levels of the latter are much lower, at around 1 to 2.5 percent. This comparison suggests that the use of dispatched workers is substantially concentrated among relatively large firms.
2. The BSBSA does not define “regular workers” clearly, like many other firm or household surveys in Japan. Regular workers usually correspond to full-time workers with indefinite-term contracts.
3. On the other hand, temporary workers are thought to be employed tentatively and irregularly for restricted purposes or occupations. In the BSBSA sample, the share of firms that employ temporary workers is small and continuously decreasing. Specifically, this share is only 6.9 percent on average from 2000 to 2014 and is about 5.5 percent in the 2010s. The aggregate ratio of the number of temporary workers to total workers is also very small and rapidly decreasing. Specifically, this ratio is 2.3 percent in 2000, 1.0 percent in 2005, and 0.8 percent in 2014. Thus, temporary workers are not frequently employed, at least among firms in the BSBSA sample, and, thus, we concentrate our analysis on the other two types of non-regular workers.
4. The BSBSA asks firms to answer questions based on the conditions in the settlement terms for the previous year. Thus, we use data from the survey conducted in a given year (on June 1 until 2006 and on March 31 from 2007) to represent the previous years’ business and financial conditions.
5. Note that normal, dispatched, and temporary workers do not overlap according to the BSBSA definitions. Normal workers consist of regular, part-time, and other non-regular normal workers, although the last category is not distinguished explicitly.
INCAS DP
SERIES / 2018 #07
Figure 1: Non-regular Worker Ratio 2000–2014
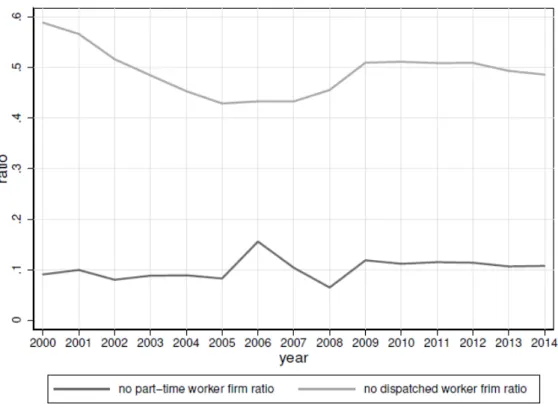
Not all firms necessarily employ these non-regular workers. Figure 2 shows the ratio of the number of firms that employ no part-time or use no dispatched workers to the total number of surveyed firms in each year.7 We find that about 90 percent of firms employ part-time workers, and this ratio is rather stable over 15 years of our study period, with slight fluctuations around 2007. This finding means that part-time employment has become a widespread and established style of employment in Japan. On the other hand, the share of firms with no dispatched workers is about 40 to 60 percent and is stable at around 50 percent in the 2010s.
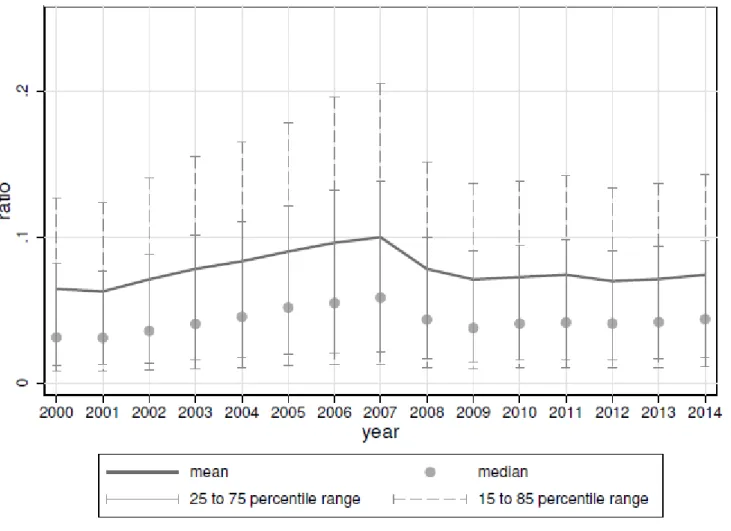
Next, we consider the behavior of individual firms with regard to non-regular worker employment. We define the individual part-time worker ratio as the ratio of the number of part-time workers in a firm to its total number of workers in a given year. The individual dispatched worker ratio is defined similarly. Figure 3 indicates the sample mean and median of the individual part-time worker ratio with the distributed range of the 15th, 25th, 75th, and 85th percentiles, excluding firms with no part-time workers, in each year. The means are around 20 percent and are larger than the medians, which are around 10 percent. Thus, the distribution of individual part-time worker ratios is left-skewed. In addition, part-time worker ratios are diverse among firms. Half of firms fall in a wide range from about three to thirty percent. The distribution expands after the end of the 2000s.
We also find that the means (and medians) are surprisingly stable, in contrast to the continuously increasing aggregate ratio shown in Figure 1. The increasing aggregate ratio suggests that the distribution of individual ratios shifts to the right. This shift should raise the sample mean of individual part-time worker ratios. However, the means increase only slightly, as shown in Figure 3. The reason is that the employee sizes of firms in the right tail of the distribution (i.e., part-time worker intensive firms) have increased. The aggregate ratio equals the sum of individual ratios weighted by the shares of firms’ total employees among economy-wide employees. Thus, even when the sample means of individual part-time worker ratios are relatively stable, the aggregate part-time worker ratios can rise due to increasing employee weights among intensive users of part-time workers. For example, the economy-wide share of workers in firms whose part-time worker ratios exceed 50 (75) percent was about 26 (13) percent in 2000 and about 35 (24) percent in 2014.8
7. The BSBSA data have many missing values for some fields, including the number of non-regular workers. We assign zeros to some of missing values when we can conclude that the respondents left the question unanswered not because they refused to answer but because those values were actually zeros. For the standards for this interpolation, see Section 2.
8. Referring to a government survey, Kalantzis et al. (2012) point out that part-time workers are concentrated in very large and very small firms, the latter of which are not included in the BSBSA sample. Since large firms’ worker weights are large, the assertion of Kalantzis et al. (2012) is consistent with our finding here.
INCAS DP
SERIES / 2018 #07
Figure 2: Ratio of Firms with No Non-regular Workers 2000–2014
INCAS DP
SERIES / 2018 #07
Figure 4: Individual Dispatched Worker Ratio 2000–2014
The behavior and distribution of the individual dispatched worker ratio are shown in Figure 4. The average individual dispatched worker ratio is slightly higher than the aggregate ratio. The average ratio ranges roughly between six and ten percent. The median values are lower than the averages, with a spread between three and six percent, which is almost the same as that of the aggre gate ratios. The range between the 25th and 75th percentiles is around or less than ten percentage points and is much smaller than that for part-time workers. Additionally, the range shrinks slightly after 2007. As a result, the variation pattern of the average individual ratio is quite similar to that of the aggre gate ratio. Dispatched worker acceptance is not as heterogeneous as part-time employment is. However, note that firms that do not use dispatched workers account for a large fraction of the total, specifically, about half of the total. In this sense, firms are polarized with respect to dispatched worker acceptance.
The findings in this section suggest that heterogeneous individual employ ment behavior is potentially important even when we examine macroeconomic increases in non-regular workers. The next section investigates the determinants of the individual firms’ non-regular worker ratios using the BSBSA data.
3. Determinants of Individual Firms’ Non-Regular Worker Ratio
This section estimates the determination of non-regular employment behavior at a firm level, including the case in which a firm employs no non-regular workers. We try to identify the influential factors of individual firms’ demand for non regular workers.
3.1 The Short-Run and Long-Run Determination of Non-Regular Employment
Firms’ reasons for using non-regular workers are twofold in general. One is labor input flexibility owing to their low labor adjustment costs.9 Firms can control their total hours worked more flexibly with lower costs by changing the
9. In Japan, many studies characterize non-regular workers as those with low adjustment costs and try to explain non-regular workers’ fluctuations or growth from this perspective. For example, see Morikawa (2010), Miyamoto (2016), and Kitawaga et al. (2018). This view is not restricted to non-regular workers in Japan. For example, see Houseman (2001) for the US.
INCAS DP
SERIES / 2018 #07
working hours of part-time workers than by changing those of regular workers whose working hours are prescribed. If firms need to adjust the total number of workers, they incur fewer costs by concluding or terminating the contracts of fixed-term workers or receiving worker dispatching services than by hiring or firing regular workers. Non-regular workers, therefore, can be used as a low-cost extensive or intensive adjustment margin.
The other purpose of using non-regular workers is wage cost savings. Non regular workers are generally paid lower wage rates than are regular workers.10 Employers’ social insurance contributions may be lower for non-regular workers. However, if non-regular workers’ productivity is low in accordance with their low wages, firms receive no particular advantage from using non-regular instead of regular workers. Thus, we expect that firms should have incentives to use low-paid workers. Some non-regular workers might obtain non-pecuniary utility from their working environment (e.g., flexible working hours or no transfers) to compensate for their low wages. Involuntary non-regular workers resignedly ac cept lower wages than their productivity warrants since they cannot find regular jobs. There would be increases in jobs that do not require workers with human capital investments under long-term contracts or workers’ efforts induced by efficiency wages.
The low adjustment costs may imply that non-regular workers act as an ad justable margin of labor against the volatility of firms’ profitability conditions. If this hypothesis is true, then non-regular employment should vary pro-cyclically more than regular employment does in the short run, and this adjustment is profitable for a firm. However, extending non-regular workers would erode the firm’s profits by, for example, reducing the share of long-employed skilled work-ers. Thus, the firm tries to set the share of non-regular workers at an optimal level in the long run. In other words, there is a steady-state level of the share of non-regular workers. This level is affected by structural factors, such as pro duction technology, monopoly power, adjustment cost structures, and demand variability.11 The wage gap between regular and non-regular workers also has an effect. A temporary variation in the wage gap affects the short-run non-regular worker share, and the steady-state wage gap determines the long-run share with other structural factors.
In other words, the long-run non-regular worker ratio is determined as the optimal level at which a firm holds such workers as an adjustment margin con sidering the benefits (e.g., reduction of compensation and adjustment costs) and costs (e.g., low productivity or trainability), which are influenced by long-run determinants. The observed non-regular worker ratio is the sum of the long-run optimal ratio and deviations caused by short-run determinants.
3.2 Estimation Model and Explanatory Variables
In the following analysis, we estimate the non-regular worker share determina tion by short-run and long-run factors using BSBSA panel data. The data are annual, and the sample period is from 2000 to 2014. We consider two types of non-regular workers: part-time workers and dispatched workers. The total number of workers is the sum of normal, dispatched, and temporary workers, as explained in Section 2. The explained variable is the individual non-regular worker ratio, which is defined as the ratio of the number of non-regular work ers to the total number of workers in a firm. Hereafter, it is simply called the non-regular worker ratio (specifically, the part-time or dispatched worker ratio) unless otherwise mentioned.
The explanatory variables are divided into two groups: short-run and long run determinants. Long-run determinants are relatively stable factors that affect the steady-state ratio of non-regular workers. These determinants are structural factors (or proxy variables for them), as discussed in the previous subsection. To construct these variables, we must extract long-run levels from the observed values. The long-long-run level is thought to be stable for a certain period, but it can change over the very long term. We approximate this situation by dividing the full sample period into two sub-periods and taking the sample mean in each sub-period as the estimated long-run level of the variable.12
The individual non-regular worker ratio deviates and fluctuates temporar ily around the long-run level. A typical factor that induces such temporary deviations is a demand shock requiring labor adjustment. If firms can adjust non-regular workers at a lower cost than they can adjust regular workers, short run adjustments target non-regular workers and, thus, the non-regular worker share varies pro-cyclically with demand fluctuations.
10. Kitagawa et al. (2018) estimate regular and non-regular workers’ wage functions and find that regular workers’ wage rates are much larger than those of non-regular workers owing to the steep slopes of regular workers’ wage-tenure profiles.
11. Several studies examine the steady-state shares of the two types of workers (i.e., workers who have the properties of either regular or non-regular workers), although these studies’ model settings are diverse. For example, see Wasmar (1999), Kalantzis et al. (2012), Miyamoto (2016), and Kitagawa et al. (2018). However the focuses of these studies are not necessarily the same as that of this study.
12. To this end, we consider low pass filters, such as the Hodrick–Prescott filter. However, since most sample firms do not have complete or consecutive series observations, the number of firms used for the estimation is reduced drastically. Moreover, even the number of full time-series observations (15) might be too small to obtain reliable estimates. Thus, we take the rather simple approach of using the sample mean as a proxy for the long-run level.
INCAS DP
SERIES / 2018 #07
We now turn to specific explanatory variables and begin with the short-run determinants. The deviations of the log of a firm’s real sales from its sub-sample mean (see the explanation of the long-run determinants below) represent the de-mand fluctuations. Real sales are measured by a firm’s gross sales divided by the producer price index classified by the industries to which the firm belongs.13 The log real sales variable (deviations from its sub-sample mean) is an individ ual factor affecting the short-run non-regular ratio variation. Many empirical studies of non-regular labor adjustment, such as, for example, Benito and Her nando (2008), Caggese and Cuñat (2008), Morikawa (2010), Asano et al. (2013), and Hosono et al. (2015), use sales fluctuations as a proxy variable reflecting exogenous demand shocks in various contexts. Aggregate economic conditions are also considered as short-run determi nants. The unemployment rate represents the labor market’s reflection of ag gregate business-cycle conditions, which may influence individual firms’ non regular worker ratios by changing wage rates, the costs of finding workers, the worker resignation probability, and so on. In addition, “Lehman shock” (global financial crisis) dummies, which take a value of one in 2008 and 2009 and a value of zero in other years, are included. The global financial crisis caused extraordinary shocks to the Japanese labor market and might have compelled irregular employment adjustments. The Lehman shock dummy is introduced to capture the unusual responses of the non-regular worker ratio after the shock. These explanatory variables represent macroeconomic conditions and, thus, are common to all firms.
Next, we examine the long-run determinants. As explained in Section 3.1, the full sample period of 2000–2014 is divided into two sub-samples, and the long-run levels of variables are assumed to be stable during each sub-period. This process requires the assumption that the long-run levels changed once in a specific year during these 15 years. We assume that the turning year is 2008, when the global financial crisis occurred. This large shock might have brought about drastic structural changes in firms’ technology and strategy, and, as a result, the steady-state values were altered. The relatively large variation in the non-regular ratio around 2007 and 2008 shown in Section 2 might also provide supporting evidence for this assumption. This treatment makes the long-run determinants time variant and allows us to use panel fixed-effect estimation.
Thus, the sub-sample periods are set to be 2000–2008 and 2009–2014. The long-run determinants are the sample means of the variables explained below in each sub-period. In the BSBSA dataset, not all surveyed firms necessarily have full time-series observations of the variables. One reason is appearances or disappearances of sampled firms. Another is that respondent firms did not answer some questions. Since too few observations imply that statistical relia bility cannot be ensured, firms with variables with fewer than three observations in each sub-period are dropped from the sample. Considering that the maxi mum observation number is six in the latter sub-period, we require at least four observations in a sub-period.
We now discuss specific long-run variables. Houseman (2001) argues that growth in establishment size advances flexible staff arrangements, including part-time and dispatched worker employment, in the US. Ono (2009) exam ines US data on temporary help services and finds that larger plants seem to use more temporary workers who are from temporary help services agencies and, thus, are similar to dispatched workers according to our definition, and she suggests that this relationship may be because larger firms benefit from cost advantages in negotiating with the agencies. She also notes that larger plants could be more likely to face greater penalties in the event of unjust dismissal lawsuits by permanent workers, which would also make it more attractive for such firms to rely on temporary workers instead. This explanatory variable can confirm these conjectures. However, an alternative argument suggests the opposite direction of the firm-size effect. For example, using US survey data, Montgomery (1988) argues that larger firms experience higher supervisory costs per worker, which increases the quasi-fixed costs of using part-time workers and, therefore, decreases the demand for such workers. This notion relates to the ar gument that non-regular workers are typically said to feel less attachment to their firm and, thus, may need to be supervised more.
Firm age is the number of years that have passed since the establishment year of the firm. Whereas most empirical results imply that the age of the firm nega tively correlates with the use of non-regular workers, explanations for this result remain underdeveloped in the literature. Ono (2009) suggests that young plants use temporary workers more frequently to ensure more employment flexibility since young plants may reflect greater output uncertainty than that captured by demand fluctuations. Kato and Zhou (2015), based on an original firm survey in Japan, argue that start-ups (young firms by definition) will typically rely on non-regular employees to fulfill non-core activities, such as administration, due to resource constraints and high internal transaction costs. In addition, younger firms might have more management flexibility to adopt new types of working to improve their labor management, and their non-regular worker ratios might be high. On the contrary, Houseman (2001) indicates that incumbents in union ized firms might have strong negotiating power to protect their employment and wages. It may be undesirable for such firms to employ inflexible and costly regular workers when extending the sizes of their workforces. Old firms may be more unionized, and, thus, this effect
INCAS DP
SERIES / 2018 #07
increases old firms’ non-regular worker ratios.
We use the capital–labor ratio, or capital intensity, to capture firms’ pro duction technology structures. Capital is measured as the amount of tangible fixed assets deflated by the industry producer price index, and labor is the total number of workers. The ratio is taken as a logarithms to normalize the marginal effect (i.e., to measure percentage changes). Autor et al. (2003) and Autor et al. (2006) argue that computer capital is a substitute for labor in routine cognitive (low-skilled) tasks and a complement to workers engaged in rational reasoning (high-(low-skilled) tasks. If this conjecture applies to broader types of modern capital equipment, capital-intensive firms might require more high-skilled (i.e., regular) workers for the efficient utilization of the technologies embodied in capital equip ment and fewer low-skilled (i.e., non-regular) workers who can be replaced by capital. On the other hand, advanced capital equipment can perform compli-cated skilled tasks and, instead, requires more unskilled workers to perform simple manual jobs with low human-capital investment costs. The direction of the effect is determined by the complementarity/substitutability of each type of labor to capital.14
Firms’ financial conditions might affect the composition of workers. Tight borrowing constraints induce firms to reduce labor costs by increasing the share of non-regular workers with low wages. Since firms with bad financial condi tions face high probabilities of bankruptcy, it is difficult for them to commit to long-term employment contracts with regular workers. Thus, bad financial conditions are found to lead to less stable employment relations. For example, Lechevalier et al. (2014) argue that firms’ high indebtedness might translate into pressure to downsize or hire more non-regular workers in the estimation of the labor adjustment speeds of Japanese firms. Caggese and Cu˜nat (2008) examine two opposite effects of financing frictions on the composition of permanent and fixed-term workers. Current financial constraints increase the demand for more productive permanent workers, and future financial constraints increase the de mand for flexible fixed-term workers. Using a database of Italian firms, they find that financially constrained firms use fixed-term contracts more intensively. Us ing Spanish firm data, Benito and Hernando (2008) examine fixed-term worker demand and conclude that the demand for flexible labor displays greater sen sitivity to financial factors and greater cyclical sensitivity. In a related work, Hosono et al. (2015) examine the demand function of dispatched workers in the period of the global financial crisis, in which large exogenous demand shocks oc curred. They find that firms with low liquid asset ratios decreased their share of dispatched workers more than other firms did, and they suggest that dispatched workers were used as buffers to negative shocks by liquidity constrained firms. The debt–asset ratio, defined as the ratio of liabilities to total assets, proxies firms’ unhealthy financial conditions to examine their effect on the non-regular worker ratio.
The decentralization of management seems to affect the composition of reg ular and non-regular workers. After rearranging the definitions of diverse cate gories of non-regular workers in Japan, Dissanayake (2016) suggests the possi bility that different corporate organizational structures demand different types of non-regular workers. Here, we consider the concentration of operations as an essential example of the organizational structure. A highly concentrated oper ational structure might make it difficult for a firm to improve the division of labor and, thus, such a firm has fewer standardized or simplified jobs. In other words, a centralized operating structure may require more skilled and complex jobs. Conversely, a decentralized organizational structure may require the hir ing of more regular and skilled workers to manage the decentralized units of production. To represent management decentralization, we use the ratio of the number of workers at a headquarters to the total number of workers. We call this ratio the headquarters concentration ratio.
Foreign trade introduces additional uncertainties into firms’ businesses ow ing to exchange rate fluctuations or competition with foreign rivals. Non-regular workers increase when firms need to make labor adjustment more flexible, and it is less costly to prepare for foreign demand variations. Matsuura et al. (2011) argue that an increase in the share of export sales encourages firms to reduce the number of products produced, which increases revenue fluctuations (as with more products, shocks will normally not hit all products simultaneously). These fluctuations lead to more volatile employment and an increasing share of non regular workers. Hosono et al. (2015), mentioned above, also consider trade effects and find that firms with higher shares of exports to total sales responded more to demand shocks in the global financial crisis by reducing their dispatched worker ratios. Yokoyama et al. (2018) examine the impact of exchange rate fluctuations on employment adjustment and show that firms relying heavily on exporting adjust non-regular employment significantly in response to exchange rate shocks. However, the opposite effects of exports are also possible. For ex-ample, export companies may promote overseas production and move unskilled jobs abroad to reduce labor costs. Laffineur and Mouhoud (2015) find that a higher share of exports as well as increasing foreign direct investment contribute to an increase in the need for regular workers, as they can benefit from on-the job training and acquire firm-specific capital in
14. By analyzing Japanese multinational firms, Kambayashi and Kiyota (2014) conclude that disemployment in Japan is mainly driven by the substitution of capital for labor rather than the reallocation of labor caused by foreign direct investment, although they consider employment as a whole.
INCAS DP
SERIES / 2018 #07
French firms. To observe the effect of trade, the export sales ratio, which is the ratio of the amount of goods exported to that of total sales, is included in the explanatory variables.
Many studies on Japanese corporate governance, such as, for example, Ah madjian (2008), Abe and Hoshi (2008), and Jackson (2008), suggest that high foreign ownership moves firms away from the traditional practices of Japanese firms. As for employment adjustment, Lechevalier et al. (2014) find that firms with higher adjustment speeds have higher shares of foreign shareholders. This higher foreign ownership creates pressure to lower labor costs and increase flex-ibility, which can be achieved through the hiring of more non-regular workers. To capture this effect, we include the foreign capital ratio, which is the ratio of foreign capital to total paid-up capital, in our analysis.
From the viewpoint that non-regular workers are used as a buffer for labor adjustment, a large short-run volatility of corporate performance should drive a firm use more flexibly adjusted non-regular workers. Many studies, including Comin and Mulani (2006) and Comin and Philippon (2006) in the US and Kim and Kwon (2017) in Japan, among others, find that economic activity at the firm level has become more volatile. This phenomenon is an incentive for firms to increase the number of non-regular workers. Ono and Sullivan (2013) examine the relation between US firms’ use of temporary workers and the output growth uncertainty they face. From a similar viewpoint, Morikawa (2010) and Asano et al. (2013) investigate how firm-level demand uncertainty, measured by the standard deviation of unexpected sales growth, influences the non-regular worker ratio in Japan. They commonly find positive correlations between the level of uncertainty and the scale of non-regular worker use. In particular, using the same dataset as ours, Morikawa (2010) separately considers three types of non-regular workers, part-time, dispatched, and temporary workers, and finds that the elasticity of the number of dispatched workers is largest among non-regular workers. Following these studies, we add the measure of demand volatility as a long-run determinant.
However, our volatility measure is the standard deviation of observed sales growth (variability hereafter) instead of that of unexpected sales growth (i.e., uncertainty). If firms adjust their workers for demand fluctuations, they should respond to all demand fluctuations irrespective of whether they were expected in advance. For example, demand seasonality can largely be expected, and firms try to vary their workers with smaller labor adjustment costs more by responding to these seasonal fluctuations. In fact, Houseman (2001) reports that the employment of dispatched or short-term workers is larger in indus tries with production seasonality in the US. Vidal and Tigges (2009) support the argument that firms are using dispatched workers to achieve planned and systematic numerical flexibility, as in the case of seasonality. Therefore, firms increase their shares of workers with low adjustment costs when they face large demand variability rather than demand uncertainty. Thus, we use the sample standard deviation instead of that of some type of forecast error as a factor that affects a firm’s long-run composition of workers with different adjustment costs. The real sales variability is measured as the standard deviation of log real sales from the sub-sample mean.15
In Japan, it is often mentioned that an increase in female labor market re tention is a source of non-regular, and especially part-time, labor. Abe (2011) discusses this point from the perspective of a cohort analysis of women’s labor supply. Tsutsui (2016) argues that increased labor supply by married women leads to non-regular worker growth due to the persistent sexual division of house work in Japan. To observe this effect, we include the female labor force par ticipation rate for ages 25 to 60 years to capture the extent of female labor retention. In other words, this value is the ratio of the number of women in the labor force aged 25 to 60 years across the whole economy to the population of women aged 25 to 60 years. At the macroeconomic level, female labor market participation and the non-regular worker ratio affect each other. However, for individual firms, macroeconomic female labor force participation is exogenous. Since the trend growth dominates short-run fluctuations in the time series tran sition of female labor force participation rates, we include this variable without converting it to the sub-sample mean.
As considered thus far, many long-run determinants have effects on the non regular worker ratio in both positive and negative directions. The regression analysis below reveals which direction of the effect dominates for each determi nant. Some variables have many missing values even for firms that replied to the survey. Considerable numbers of these values are thought to be unfilled because the numbers are actually zeros. We assume that the missing values are zeros in the following two cases. First, it seems that firms provided no answers to some questions not because they refused to report the actual values but because those values were zero. For example, many firms have missing data for the amount of exports in every survey year. It is safe to assume that such firms did not engage in trade. Thus, we interpolate missing values with zeros when the reported values of a certain variable are all zeros except for the missing values or are all missing. Second, the questionnaire asks about the numbers of dispatched and temporary workers in the same question; if a firm provides
15. For example, Comin and Mulani (2006) measure the sales volatility using the sample standard deviation of sales. They determine the sample period as the ten-year rolling window, which is the ten-year sub-period including the concerned year at the midpoint. We do not take this approach since it would seriously reduce the number of observations in our case.
INCAS DP
SERIES / 2018 #07
an answer for the number of workers for one of these worker types but leaves the other part unanswered, we regard the reason for the missing answer as no use of that type of worker. Thus, we regard such a missing value as zero.
The explained variables are the individual part-time and dispatched worker ratios. We treat the two types of non-regular worker ratios separately in the estimation. As we see in Section 2, a certain number of firms employ no part-time and/or accept no dispatched workers, and we should take this fact into account. Therefore, the model is estimated using a fixed– effect panel Tobit model with dummies for each individual firm. Although the model is not free from the incidental parameter problem, Greene (2004) argues that the fixed– effect maximum likelihood estimator of the Tobit model shows essentially no bias in the slope estimators and that the small sample bias would be transmitted to the estimates of partial effects but that it appears to be small if the number of time units is five or more.
The estimated equation is
where yit is the non-regular (part-time or dispatched) worker ratio of firm i in year t; xkit is the determinant factor k, which may be a short-run or long-run factor, of firm i in year t; αi is an individual effect (a firm dummy) for firm i, which is time invariant; and εit is an independent and identically distributed error with a normal distribution for firm i in year t. All explanatory variables should be exogenous in this framework. Although there is a low possibility of causality from the non-regular worker ratio to the above explanatory variables, endogeneity can arise in the short run due to ex ternal factors that affect the non-regular worker ratio and some explanatory variables simultaneously. However, note that most explanatory variables at the firm level are long-run factors in which short-run variations are eliminated by averaging. This method of variable construction is expected to reduce the pos sibility of endogeneity bias. For example, in the short run, the total number of workers and the non-regular worker ratio should be affected simultaneously by outside circumstances. When non-regular workers are easier to adjust than regular workers are, a firm employs non-regular workers and keeps the number of regular workers unchanged during a tentative upturn in business conditions, resulting in both the expansion of the total number of workers and an increase in the non-regular worker ratio. However, in the long run, it is natural to consider that a firm determines its optimal non-regular worker ratio given its workforce size (i.e., firm size).
Moreover, the only short-run individual variable is the deviation rate of real sales in our model. Demand variables, such as sales or shipments, are regarded as exogenous to a firm’s employment decision in previous studies in this field, such as those mentioned at the beginning of this subsection. However, the business cycle conditions might influence non-regular employment and sales simultaneously, and this effect causes correlation between a sales variable and a disturbance of the non-regular worker ratio. The unemployment rates are included to represent such external factors and resolve such endogeneity.
3.3 Results
Table 1 reports the estimation results.16 The numbers of observations are 42,051 for the part-time worker ratio and 42,221 for the dispatched worker ratio, in cluding cases in which these ratios are zero. Observations from firms that report the number of non-regular workers as zero throughout the period cannot be used for estimation. These observations number 2,119 and 2,301 for the part-time and dispatched worker ratios, respectively. Moreover, 20,290 and 19,552 ob servations are dropped for these respective ratios due to missing explanatory variables. Therefore, the numbers of observations used are 19,642 and 20,368, respectively.
We begin with the short-run determinants. Demand shocks are measured by the temporary deviations of real sales from their long-run values. Since the variables are in logarithms, the value of an estimated coefficient approximately represents the effect of the variable’s marginal change on a change in the non regular worker ratio. A percent increase
16. In interpreting the Tobit estimation results, the partial effect is often referred to instead of the estimated coefficient. The partial effect of the Tobit model is
coefficient × (probability of non-censored observation),
which represents the expected marginal contribution of an explanatory variable considering the truncation at zero. However, since we are interested in an individual firm’s response to the determinant rather than the aggregate economy’s response, we focus on the value of the coefficient itself.
INCAS DP
SERIES / 2018 #07
INCAS DP
SERIES / 2018 #07
in the real sales deviation raises the part-time worker ratio 0.0003 percentage points and the dispatched worker ra tio 0.04 percentage points. The former effect is insignificant even at the ten percent level. Thus, we conclude that part-time workers are not adjusted in response to demand fluctuations more than other workers are. The role of the labor adjustment margin in this case is due to dispatched workers, although the response is not so large. These results indicate that non-regular workers are not so sensitively adjusted in response to an individual firm’s demand fluctua tions. This finding does not coincide with the widespread view that non-regular employment is unstable in response to firms’ business conditions in Japan.
A percentage point increase in the unemployment rate (represented in deci mal fraction) increases the part-time worker ratio by 0.003 percentage points and decreases the dispatched worker ratio by 0.02 percentage points. An improve-ment in the labor market condition reduces part-time workers but promotes the use of dispatched workers relative to regular workers. Since the wage costs of part-time and dispatched workers do not necessarily dominate one another, the difference in the responses of the ratios of these workers depends on their sub stitutability with regular workers. In a regular employment expansion phase, which is usually accompanied by the tight labor market, a firm reduces the number of non-regular workers who are substitutes and raises the number of those who are complements to regular workers. In this sense, part-time workers are more substitutable with regular workers than dispatched workers are. This perspective is consistent with findings shown in Morikawa (2010).
In addition, the Lehman shock dummy shows that the global financial crisis had a positive effect on part-time workers. The part-time worker ratio is higher than usual by 0.3 percentage points in 2008 and 2009. On the contrary, it caused a negative response of the dispatched worker ratio, which was 0.2 percentage points lower in this period. During the global financial crisis, the dismissal of dispatched workers became a social problem in Japan, symbolizing unsta ble non-regular employment. The estimated negative coefficient in the case of dispatched workers is consistent with this impression, although the size is not large. However, it should be noted that this assertion does not apply evenly to non-regular workers, as the positive response of part-time workers indicates.17
As a whole, part-time and dispatched workers show contrasting features in their responses to the short-run determinants. Firms adjust the part-time worker ratio in response to economy-wide labor market conditions but not to individual demand fluctuations. Firms extend part-time employment in bad economic conditions during which they reduce regular employment. This find ing is consistent with the recognition that some workers avoid unemployment by taking non-regular jobs in a recession. Firms might reduce labor costs by substituting non-regular workers with part-time workers whose wage levels are lower and more cyclical. On the other hand, the adjustment pattern of dispatched workers is consistent with the recognition that workers with low adjustment costs are used to coping with temporary changes in economic conditions. The dispatched worker ratio is adjusted positively to both aggregate and individ ual economic conditions. Firms adjust dispatched workers more sensitively to individual demand conditions than they do part-time workers. Next, we look at the effects of long-run determinants. Firm size (log of the number of workers) increases the share of non-regular workers, with a larger effect on part-time workers. A percent increase in firm size raises the part-time worker ratio by 0.05 percentage points, whereas it increases the dispatched worker ratio by 0.02 percentage points. Long-established firms employ relatively fewer non-regular workers. How ever, the size of the effect is small, albeit statistically significant. A year in crease in firm age reduces the part-time ratio by 0.1 percentage points and the dispatched worker ratio by 0.03 percentage points.
The log of the capital–labor ratio has a negative coefficient for both types of non-regular worker ratios. Firms with capital-intensive technology employ fewer non-regular workers, especially part-time workers. A percent increase in the capital–labor ratio decreases the part-time worker ratio by 0.01 percentage points and the dispatched worker ratio by 0.004 percentage points. This fact suggests that capital and unskilled labor may be substitutes in the production technology.
A high debt–asset ratio increases the ratio of part-time workers. A per centage point increase in this ratio raises the part-time worker ratio by 0.02 percentage points but insignificantly affects the dispatched worker ratio. This financial condition is only related to part-time workers.
Both non-regular worker ratios are lower in firms with higher headquarters concentration ratios. A firm with one
17. Hijzen et al. (2015) point out that the increased amount of non-regular workers caused employment adjustment to respond more sensitively to economic shocks positively or negatively and resulted in much higher worker turnover during the global financial crisis than in the period of the Asian currency crisis. However, they also conclude that employment response during the global financial crisis was smaller than expected based on that during the Asian currency crisis.
INCAS DP
SERIES / 2018 #07
percentage point more concentration has a 0.1 percentage point lower part-time worker ratio. This effect is smaller for the dispatched worker ratio, 0.01 percentage points.
The export–sales ratio has a negative effect on the part-time worker ratio and a positive effect on the dispatched worker ratio. A percentage point increase in this ratio reduces the part-time worker ratio by 0.3 percentage points and raises the dispatched worker ratio by 0.02 percentage points. Firms use these two types of non-regular workers differently to cope with export uncertainty.
The direction of the foreign capital effect also differs between the two types of workers. A percentage point increase in the foreign capital ratio induces a 0.05 percentage point increase in the dispatched worker ratio and a 0.16 percentage point decrease in the part-time worker ratio. As shown by the coefficients on the short-run variables, part-time workers do not respond to firms’ temporary performances more flexibly than regular workers do. Thus, if foreign owners require frequent labor adjustments, part-time workers might not necessarily be efficient for this aim. Instead, part-time workers are exchanged for dispatched workers, since, by using the latter, firms can cut labor adjustment costs, includ ing implicit costs that are not always reflected in the terms of contracts.
The coefficient on the real sales variability is negative for the part-time worker ratio and positive for the dispatched worker ratio. A percent increase in this variability (i.e., standard deviation) reduces the part-time worker ratio by 0.03 percentage points and raises the dispatched worker ratio by 0.05 percentage points. If non-regular workers are used as a buffer against demand fluctuations, then a large variability of demand should increase the share of this worker type. This effect is observed in changes in dispatched worker ratios. However, in the part-time worker case, increased variability reduces this ratio. It might be that skilled or full-time workers, rather than unskilled part-time workers, are necessary to manage unstable demand. Moreover, as shown above in this subsection, the part-time worker ratio does not respond to demand fluctuation and, thus, part-time worker adjustment costs (e.g., firing costs due to legal protection) do not seem to be much smaller than those of regular workers. Then, under long-term unstable demand conditions, firms substitute part-time workers with less costly adjustable workers, such as dispatched workers. Note that written labor contracts do not always assure easier termination of contracts for dispatched workers than for part-time workers. Here, we do not restrict the labor adjustment costs be explicit in the terms of contracts. The labor adjustment costs described here includes those that reflect, for example, investments in firm-specific skills, legal risks, and retention probabilities, which are not always observable.
The part-time worker ratio increases by 0.4 percentage points when there is a one percentage point increase in the female labor force participation rate. On the other hand, the dispatched worker ratio decreases by 0.3 percentage points. The negative effect on the dispatched worker ratio seemingly contradicts the intuition that increased female labor force participation raises firms’ non-regular worker use. It is probable that the increased female labor supply mainly targets part-time jobs (and might reduce the relative wages of these jobs). Thus, firms may shift some dispatched workers’ jobs to part-time workers.
Overall, these results have some important characteristics. First, most vari ables show statistically significant effects. Second, the signs of coefficients (i.e., the directions of effects) of some variables differ between part-time and dis patched workers. The signs of the latter coefficients seem more consistent with the intuition around non-regular workers, such as that they are workers with low adjustment costs. Third, the sizes of the effects on dispatched workers are generally larger for short-run determinants than for long-run determinants in comparison to part-time workers. The employment of part-time workers is more structurally determined.
4. Factor Decomposition of Non-regular Growth and Dispersion
Based on the estimated results in the previous section, this section examines the major causes of the growth in the aggregate non-regular worker ratios and then proceeds to investigate the sources of the cross-sectional dispersion of the firm-level non-regular worker ratios.
4.1 Time-Series Decomposition: Sources of the Non-Regular Worker Increase
This subsection examines the sources of the non-regular worker increase based on the estimation results in Section 3. As we see in Section 2, the shares of part-time and dispatched workers, especially those of the former, have increased since the 2000s. In the previous section, we examine the quantitative impact of heterogeneous micro demand and structural factors and macro labor-market factors on individual firms’ non-regular employment determination in a unified
INCAS DP
SERIES / 2018 #07
framework. Doing so allows us to evaluate the quantitative contribution of those factors to the aggregate increases in non-regular workers.
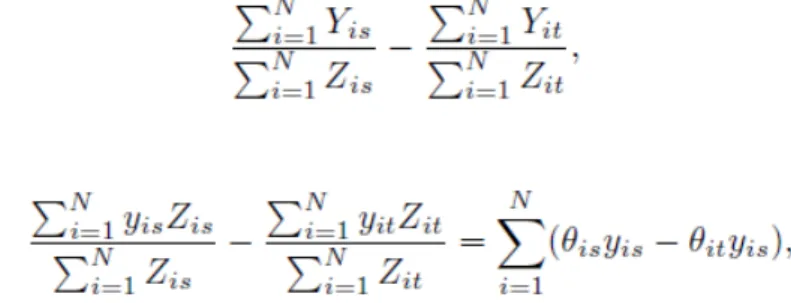
We now further explain the method. The aggregate non-regular worker ratio is measured by the ratio of the aggregate number of non-regular workers to that of the total number of workers across all firms.
where Yit is the number of non-regular workers, Zit is that of all workers in firm i in year t, and N is the number of firms. Note that the individual non-regular worker ratio yit has the relation yit = Yit/Zit. The increase in the aggregate non-regular ratio from t to s is
which can be represented as
where θit indicates the share of firm i among the whole economy in the number of workers in year t. We clarify that y is observed only when y* > 0, which is represented by
where the right-hand side in parentheses represents the condition. Accordingly, the contribution of factor xk to the growth of y is
where βk is the estimated coefficient on variable k in the Tobit latent equation (1). The share of a contribution is measured by the contribution (4) divided by the total growth (3).
The starting year t is fixed to 2000. When we set the comparison year s to any year in the latter sub-period, the growth rate of an individual long run variable k for a certain firm, xkis − xkit, is unchanged, since the value of a long-run variable is constant at its sub-sample mean by definition. On the other hand, firms with positive non-regular workers and the weight of each firm θi both change in different years. Moreover, the firms surveyed in year s are not necessarily in those surveyed in a different year s’ . Thus, the observations and weights that are used for calculating the growth rate from t to
s differ from those from t to s’ . Consequently, the aggregated contribution (4) changes when we set different comparison
years. The short-run individual variable (i.e., real sales) and the macroeconomic variables vary every year. To examine the general properties of the contribution, we calculate the aggregated contribution (4) and its share in total non-regular growth (3) from t = 2000 to each of s = 2012, 2013, and 2014 and average these three values.
Table 2 shows the average values and the average non-regular growth rates for these three years. In our sample, the aggregate part-time worker ratio in creases by 6.67 percentage points, and the aggregate dispatched worker ratio increases by 1.43 percentage points on average from 2000 to the most recent three years, as shown in the first row and the first and third columns, respec tively. The total contribution of each factor (4) to the rate of increase (3) is also shown in the first row and the second and fourth columns. In the first column, the third row and the below rows indicate the contribution of each factor to the part-time worker growth rate in percentage terms. The corresponding rows in the second column represent the contributions as a fraction of the total rate of aggregate non-regular worker growth. The growth in the part-time worker ratio explained by the short-run and long-run factors is 4.81 percentage points, which amounts to 73 percent of total growth. The reminder of this growth is left unexplained by the model. The bulk of the explained growth, 53 percent, is attributed to the 25 to 60-year-old female labor market participation rate. This result means that factors reflecting individual firms’ conditions are relatively unimportant for explaining the increases in the part-time worker ratio. Most of the increase can be attributed to an exogenous aggregate labor market condi tion, female labor