HAL Id: hal-00015163
https://hal.archives-ouvertes.fr/hal-00015163
Submitted on 23 Feb 2006
HAL is a multi-disciplinary open access
archive for the deposit and dissemination of
sci-entific research documents, whether they are
pub-lished or not. The documents may come from
teaching and research institutions in France or
abroad, or from public or private research centers.
L’archive ouverte pluridisciplinaire HAL, est
destinée au dépôt et à la diffusion de documents
scientifiques de niveau recherche, publiés ou non,
émanant des établissements d’enseignement et de
recherche français ou étrangers, des laboratoires
publics ou privés.
On the choice of the model cell and the integration
volume in the use of the rotation function
Alain Lifchitz
To cite this version:
Alain Lifchitz. On the choice of the model cell and the integration volume in the use of the
rota-tion funcrota-tion. Acta Crystallographica Secrota-tion A Foundarota-tions and Advances, Internarota-tional Union of
Crystallography, 1983, 39, pp.130-139. �10.1107/S0108767383000227�. �hal-00015163�
130 R E P R E S E N T A T I O N OF THE F O U R - D I M E N S I O N A L CRYSTAL CLASSES. I. respect to the symmetry) then a null symbol ( - ) can be
written to correspond to directions in which no symmetry is present. However, since each axis is identically related to every other there is no loss of information, except that relating to orientation, if the null symbols are omitted. Thus class No. 3 (Fig. 1) is shown in the orientation - - - m, but m is a sufficient symbol.
Rotation planes have to be specified in a separate sequence. The order adopted for the axial plane is wx, xy, yz, zw, wy, zx, and a semi-colon is placed between the two series of symbols when both are present.
Again, null symbols can be inserted as required to give an unambiguous notation, including orientation. A possible shortened notation that does not include orientation may be derived as follows:
If there is only one rotation plane as in No. 6 all the null symbols may obviously be omitted.
In four dimensions two planes may intersect in a line or only in a point, and in the latter case their representations in the hyperstereogram do not inter- sect at all. This means that the axial planes concerned do not contain a common axis, and there are three differently oriented possibilities for No. 7, where this is true, namely 2 - 2 - - - , - 2 - 2 - - and . . . . 2 2. On the other hand, for No. 12 there are four differently oriented possibilities 2 2 - - - 2, - 2 2 - 2 - , - - 2 2 - 2 and 2 - - 2 2 - . If we make a convention that an orientation is chosen such that two planes are in the first four positions then No. 7 has two places occupied that are separated by a null symbol, whereas No. 12 always has two adjacent occupied places amongst these four (treated cyclicly). Thus we may symbolize No. 7 as 2 - 2 and No. 12 as 2 2 (since two two-fold planes in the latter relationship necessarily imply the third). Thus in
the sequence of symbols for rotation planes it is essential to retain a null symbol when the planes involved do not intersect in a line.
Two sets of symbols for the first 16 classes are given in Table 1; 'extended symbols' are already in the shortened form discussed above. In the column headed 'symbol' the contraction has been taken a stage further by omission of those symmetry elements that are necessarily implied by others. Their meaning will be greatly clarified by comparison with the hyperstereo- grams in Fig. 1. Additional complications in the nomenclature arise in some higher-symmetry systems, but these will be dealt with in a subsequent publication along with the corresponding explanatory hyperstereo- grams.
Conclusion
The hyperstereogram is a very powerful tool in clarifying the concepts of four-dimensional crystal- lography.
Thanks are due to P. M. de Wolff for extremely helpful advice on improvements in the precision and clarity of presentation of the discussion.
References
BROWN, H., BOLOW, R., NEUBOSER, J., WONDRATSCHEK, H. & ZASSENHAUS, H. (1978). Crystallographic Groups of 4- Dimensional Space. New York: Wiley.
KUNTSEVICH, T. S. & BELOV, N. V. (1968). Acta Cryst. A24,
42-51.
WHITTAKER, E. J. W. (1973a). Acta Cryst. A29, 673-678.
WHITTAKER, E. J. W. (1973b). Acta Cryst. A29, 678-684.
Acta Cryst. (1983). A39, 130-139
On the Choice of the Model Cell and the Integration Volume in the Use of the Rotation
Function
BY ALAIN LIFCHITZ
Laboratoire de Mindralogie et de Cristallographie, associd au CNRS, Universitd Pierre et Marie Curie, 4 place Jussieu, F-75230, Paris C E D E X 05, France
(Received 10 March 1982; accepted 19 August 1982)
Abstract
In the general case where there is only one molecule in the asymmetric unit, and in the absence of non- crystallographic symmetry, molecular-replacement (MR) techniques can be used to solve an unknown 0567-7394/83/010130-10501.50
crystal structure from a closely related known molecular model. The procedure comprises two stages in order to find (i) the orientation of the model in the crystal, and (ii) the position of the well oriented model relative to the crystallographic symmetry elements. The most widely used rotation function R(8) [Rossmann & © 1983 International Union of Crystallography
ALAIN L I F C H I T Z 131 Blow (1962). Acta Cryst. 15, 24-31], for stage (i),
correlates the rotated central portion U of the Patterson function of the observed crystal with the calculated Patterson function of the proposed model. The calcu- lation of the Patterson function of the model is performed in an arbitrary cell of sufficient size to prevent the overlap of intramolecular vectors from adjacent origins. Tollin & Rossmann [Acta Cryst.
(1966), 21, 872-876] have proposed a criterion for the choice of the cell; this criterion is in fact sufficient but not necessary: after a discussion on the shape and the size of U, it is shown in this paper that the volume of the cell can be generally halved for the very same resulting map and, as a consequence, the computing time is also halved. Moreover, the size of the cell, even over-reduced, has a relatively weak influence on the ultimate conclusion of the MR calculation.
1. Introduction
Once the structure of one member of a family of related molecules has been solved by conventional methods, the structures of other members can be determined more readily. The molecular-replacement (MR) method may be used to determine what orientation and position of a closely related molecular model fits best the X-ray diffraction intensities from the crystal of an unknown structure. When an appropriate model exists, and the MR is successful, the great deal of labour required for the multiple-isomorphous-replacement (MIR) method can be considerably reduced. Moreover, MR can help solve structures by the MIR method as MR electron density maps can be used to determine heavy-atom- derivative positions directly (Buehner, Lifchitz, Bally & Mornon, 1982).
Rossmann & Blow (1962) (hereafter RB) have formulated the general concepts of MR, although earlier authors had already tried to use similarities between structures and/or a priori knowledge on unknown structures to solve these structures in some particular cases: Taylor (1954), Vand & Pepinsky (1956), Buerger (1959). Their work has shown that superimposing the Patterson function of a known model molecule on the observed Patterson function of an unknown crystal structure allows the determination of the six independent parameters corresponding to the degrees of freedom in the general case when there is only one rigid molecule in the asymmetric unit and non-crystallographic symmetry is absent.
This six-dimensional problem splits into two three- dimensional subproblems, i.e. to find (i) the orientation of the known molecule in the observed crystal, and (ii) the position of the model relative to the symmetry elements or origin of the cell.
As RB have shown, the determination of the orientation can be performed first, independently of the
translation, because the major part of the orientational information on the units of the observed crystal 'lies in a volume extending from the origin by the overall dimensions of the units'.
RB have introduced the rotation function R(0) to find the 'best' agreement between model and observed structure versus the orientation 0. This is the method most used to find 0.
This correlation-like function is defined in direct space as:
R ( 0 ) = f Pe[C(O)X, IPo(X,)dV , (1)
u
where Po is the Patterson function of the observed crystal, Pc is the calculated Patterson function of the model, C(O) is a rotation matrix defining the relative orientation between crystal molecules and the pro- posed, model, and U is an integration volume equal to or smaller than the crystal cell.
The mathematical properties of the Fourier trans- form allow R(O) to be expressed in reciprocal space:
R(O) = ~ • IFe(h')lZlFo(h)l z Ghh,(O), (2) h h'
where I Fol is the observed structure factor from the crystal, I Fcl is the calculated structure factor from the proposed model, h,h' are vectors in reciprocal space of, respectively, the observed crystal and the hypothetical model 'crystal', and Ghh,(0) is an interference function depending only on the volume U and 0.
The numerical evaluation of R(8), in the present case, can be reduced when performed in reciprocal space, particularly by using Crowther's (1972)fast rotation algorithm based on a spherical-harmonics development and FFT.
The aim of this paper is to discuss, on the one hand, the choice of U and, on the other, the choice of the lattice h' (or the hypothetical unit cell containing the model for the calculated Patterson function, which is equivalent in direct space), and to derive simple practical rules for optimizing the computing effort in the use of R(0).
2. The Integration volume U
For an effective and practical use of the rotation function R (0), the choice of the rotated model is by far the most important. However, other parameters such as the integration volume and the arbitrary unit cell containing the model have to be carefully selected in order to obtain the best results together with a computing time which is as short as possible. What rules govern the choice of these last two parameters?
In their paper on programs for evaluating R(0), Tollin & Rossmann (1966) (hereafter TR) have established rules of thumb:
132 M O D E L CELL F O R THE R O T A T I O N F U N C T I O N (1) 'The integration is performed over the volume U
equal to the volume around the origin of the Patterson function within which Po and Pc are expected to show similarity. U is invariably chosen to be a sphere of radius r0'; in fact, these authors have described algorithms which approximate this sphere by a centrosymmetric volume: this maintains the exact rotation symmetry of R(O) in Eulerian space (Tollin, Main & Rossmann, 1966), needed for easier inter- pretation of the maps.
(2) 'It is helpful to place the known rigid group in an arbitrary unit cell of sufficient size to avoid overlap of the self-Patterson vectors, that is leaving gaps between the groups equal to the diameter of the group'.
These rules ensure a correct evaluation of R(O)
provided that the radius r 0 has been defined appro- priately; following RB quoted above, the useful portion of the Patterson function has approximately the overall dimension of the model, which therefore gives r 0.
In fact, the choice of this radius is a compromise. Joynson, North, Sarma, Dickerson & Steinrauf (1970) gave a good discussion of the dilemma and concluded by recommending, from their experience, that U be a sphere of radius equal to half the diameter of the model: it is, by far, the most often used choice in the literature and leads, in general, to good results.
In the current situation where P0 is the classical Patterson structure of the observed crystal, containing only one molecule in the asymmetric unit, some theoretical arguments can be given to support the rule of thumb of Joynson et al. The overall dimension of the Patterson function of the isolated molecule is twice that of the molecule itself. Therefore, the corresponding volume of the Patterson function is 23 -- 8 times the volume of the molecule. On the other hand, in the crystal the molecules are arranged with a packing which is more or less compact: the asymmetric unit and the molecule have a volume of the same order.
Let us suppose, now, that the unit cell of the crystal, which is of course identical to that of the Patterson structure of this crystal, is built up from K molecules in the general equivalent positions of the space group: if the space group is not centrosymmetric (which is necessarily the case for protein crystals), there are 2K asymmetric units in the unit cell of the Patterson structure. As pointed out by Huber (1970), the Patterson structure contains K 2 Patterson functions of
the isolated molecule from which only K, however, are independent, K . ( K - l) being related by the sym- metry of Patterson space.
Thus some intrinsic overlaps occur systematically in a Patterson structure. From the K independent Patter- son functions, onl~¢ one is a self-Patterson function, translation independent and centred at the origin. Therefore, the central part of the Patterson structure, the only relevant part for the rotation-function cal- culation, is constituted by the superposition, at the
origin, of K symmetry-related copies of this self- Patterson function. This rotational part of the Patter- son structure is 'blurred' by overlap of the translational part formed of the K ( K - l) cross-Patterson functions. The distances from the origin of these cross-Patterson functions and the overall dimensions of the molecule are of the same order.
The size of U may now be chosen in order to balance two criteria: U must contain (i) a maximum of orientational vectors, and (ii) a minimum of transla- tional vectors. To define the volume U by the set of points where the local contribution of the two types of vectors are equal, amounts approximately to applying the rule of Joynson et al.
This suggests that for U the smallest polyhedral volume [similar to the Wigner-Seitz cell used in solid-state physics (Kittel, 1968)] defined by the median planes perpendicular to the vectors (r k - rk,) should be used, where r k are the centres of molecules in the cell: although individual vectors r k are not yet known, in general, before the ultimate conclusion of the
MR, ( r k - - rk, ) can be taken, with sufficient accuracy, as
the vectors formed from the origin to the major peaks in the Patterson map. Moreover, such a polyhedral volume maintains, by construction, the exact sym- metry of R (0)in Eulerian space.
Selection of U following Joynson et al., or with a similar rule, leads to a rejection of about ~ (!) of the volume considered in the detection of the molecular orientation: saving a reduction of the computation in the same proportion, one can question the actual meaning of a result found in these conditions. In fact, the rejected proportion of 'orientational' vectors is far less. Relation (A 19) of the Appendix, between the mean values of R(8) according to the choice of U
R' = 0.91R, (3)
indicates that only less than 10% of useful vectors are omitted in the computation, to limit to less than 10% the disturbance of R (0) by extraneous vectors.
Lattman & Love (1970) pointed out that Pc in (1) is the Patterson function of an isolated molecule, so the integration volume U is no longer necessary, the model itself being of finite extent. Strictly speaking this is true and may speed up the numerical evaluation of R(O).
Unforturiately, this neglect of U is equivalent to choosing implicitly U identical to a sphere of radius equal to the diameter (and not to the radius...) of the model, which is a poor compromise and, moreover, requires the selection of an oversized cell for the model. A reduced sphere U is needed to improve the contrast of significant peaks in R(O).
The preceding discussion needs to be generalized for the case of ellipsoidal-shaped molecules:
ALAIN LIFCHITZ 133 can be a good choice, for it minimizes the contribution
of the least significant long vectors. This type of compromise was apparently used by Colman, Deisenhofer, Huber & Palm (1976) with the M603 Fab fragment of dimensions 80 x 40 x 40/k, and where r 0 = 30/k was chosen. In fact, an actual integration radius of 2r 0 has been used because U could be chosert, in this particular MR application, as having approxi- mately overall dimensions of
Po:
contrary to the classical situation, this observed Patterson function was computed from a selected domain of the isomorphous electron density and so overlap by adjacent Patterson functions could be totally eliminated.The origin peak of the Patterson function contains very little information on orientation. Its radius and the data resolution are of the same order. It could be usefully removed when overlaps occur at adjacent origins (Lattman & Love, 1970). But, in the present case, this operation is unnecessary since the model cell can be chosen of sufficient size. The origin contributes to R(O) only by adding a quasi-constant term, which does not affect the positions or shapes of the peaks.
Limiting the integral (1) on the volume U is equivalent to multiplying the integrand by a weighting function equal to 1 inside U and equal to 0 outside. A more general weighting function could be a decreasing function of the distance from the origin: intermolecular and intramolecular vectors are inextricably inter- mingled, but most of the vectors near the Patterson origin are intramolecular and the proportion decreases as the distance increases from the origin. A Gaussian function leads to what has been called the 'shaded rotation function' (Sasada, 1964; Prothero & Ross- mann, 1964). Craven (1975) has also proposed such a weighting scheme, but acting directly on the model, to compensate for possible errors in the atomic positions.
3. Symmetry, shape and size of the model cell
Two symmetries and corresponding shapes seem a
priori
interesting for the model cell: (i) the symmetry ofthe observed crystal with its corresponding shape and (ii) P 1 symmetry with a well sized arbitrary cell.
The former seems theoret{cally attractive for several reasons: first its 'physical' nature and secondly the possibility for calculating the transform of the model by a classical structure factor calculation program, using
the
h,k,l
sequence of the observed crystal as input data.The symmetry produces extraneous overlaps on intra- molecular vectors, in comparison with a self-Patterson function of an isolated molecule. Nevertheless, in this case, Pc and
Po
belong to the same Laue class. It can be expected that the same symmetry for both functions may produce comparable features, particularly in the region surrounding the origin. Such similarities may allow easier interpretation of the rotational correlation(i.e.
the rotation-function calculation). Nevertheless, inpractice, this symmetry is rarely used, for the position of the model has to be chosen to avoid overlaps by crystal packing. This complication does not exist with P1.
In fact, the higher the symmetry of the model crystal, the smaller is the rotational asymmetric unit and so is the computing time, but the greater also might be the number of spurious overlaps between self-Patterson functions and between peaks in R(0) too. These overlaps, in distorting significant peaks, produce loss of accuracy as well as false peaks and lead to cumber- some or impossible interpretation of the map.
So, the lowest symmetry P1 is normally chosen for the model unit cell, the Patterson function of symmetry P i leading to a minimum of peak overlaps and maps which are easier to unravel. But what criterion determines the shape and size of this unit cell?
Some authors, using MR to solve their structures, have given no details about the choice of the hypo- thetical cell, but many have followed the Joynson
et al.
equivalent 'reformulation' of rule (2) above: 'The hypothetical unit cell has dimensions that are at least twice as great as the dimensions of a single molecule in each direction' [see specially Hackert, Ford & Ross- mann (1973) and Nixon & North (1976)]. With this criterion the volume of the cell would be at least 23 = 8 times the volume of the model.
Other authors have used even larger cells: three times, in each direction, and even more, the overall dimensions of the model (Bott & Sarma, 1976; Schmidt, Girling, Houston, Sproul, Amma & Huisman, 1977), that is to say a cell volume at least 33 = 27 times the volume of the model. The number of structure factors to be evaluated is proportional to this volume. Although the correct result was obtained for the R(8) maps, such unnecessarily large cells lead to an increase in computing time without any improvement in the map.
In every case an orthogonal cell a = p = ), = 90 ° was selected, to simplify the structure factor calculation.
4. Reduction of the model hypothetical cell
Craven (1975) has stated the problem clearly: 'The axial dimensions should be large enough that no intermolecular vectors occur within the sphere of comparison to be used in the rotation function', and, moreover, has given a practical rule: 'Thus, only
intra-fragment
vectors should occur within a certaindistance r 0 of the origin of the model Patterson function. If the model fragment is imagined to be enclosed by an envelope r 0 distant from all atomic centers, then the unit cell should be large enough to contain this envelope'. In fact, this criterion is as good as or better than the TR rule, according to the U
134 M O D E L CELL F O R T H E R O T A T I O N F U N C T I O N chosen, but is again only sufficient, i.e. the cell can be
smaller with no more overlap of intramolecular vectors. We have already pointed out this situation and have experimented with another criterion to select a reduced cell (Lifchitz, Harada, Morris, Laurent & Berthou, 1977). A practical rule, necessary and sufficient, can easily be derived for an optimized choice of the model cell.
4.1. One-dimensional model
It will be convenient, if trivial, to consider first a one-dimensional model for this derivation. A model of size 2B, and therefore of 'radius' B is placed in a 'cell' of size A (Fig. la). 4B = 2(2B) is the size of the Patterson function of the model with the same period A as the model cell (Fig. lb). Fig. l(c) represents the limit situation which totally prevents overlap from adjacent Patterson functions and corresponds to the TR rule:
A > 4B (5)
The keyword is 'totally' and was, with no doubt, implied in the TR rule; it is unnecessarily restrictive and may be contrasted with Craven's rule which permits overlap outside the sphere of interest, U.
Let C be the 'radius' of U. A necessary and sufficient condition, to avoid overlap in the volume U, depending upon the period A, is clearly (Fig. ld):
A ___ C + 2B, (6)
which agrees with Craven's practical rule only i f r o / 2 is substituted for r 0.
The more usual situations need now to be examined. The inequality (6) becomes identical to (5) when C = 2B; that is to say, the diameter of U is equal to the size
0 A 2A x - 2 B 0 2B 4B 6B 8B 10B x
(a) (c)
A - 2 B 2 ( A - B ) 2 B + C 2 B + 2 C 4 B + C
(b) (d)
Fig. 1 (a) Isolated one-dimensional model 2B sized in a unit cell of period A. (b) Patterson function, of the preceding model, 4B wide. (c) Smaller period A = 4B which totally prevents overlap from adjacent Patterson functions. (d) Necessary and sufficient condition, to avoid overlap in the volume U: A = C + 2B.
of the Patterson function of the model, which corre- sponds, for example, to the Lattman & Love rotation program. In the most important case, in practice, where U is the limiting volume of the model, i.e. C = B, (6) becomes
A > 3 B , (7)
which can be expressed as: In the use of rotation functions, with an integration volume equal to the limiting volume of the rotated model, the optimal model unit cell has dimensions that are one and a half times the dimensions of this limiting volume in each direction. This choice avoids both vector overlap and waste of computing time.
The volume of the unit cell is now (½)3 = 3.375 times the volume of the model instead of 8 in the TR rule.
For a given symmetry, and range of resolution, the number of structure factors of a crystal is directly proportional to the unit-cell volume as is, at least, the computing time for structure factor calculation. On the other hand, for a given resolution and volume U, the computing effort varies approximately as the number of structure factors with both types of algorithm used for the calculation of R (0):
- the proportionality is obvious in a direct evaluation of (2), whatever the algorithm used.
- Crowther's fast rotation algorithm comprises two stages: first the expansion of IFI 2 in spherical- harmonics terms, which takes the major part of the computing time, and is roughly proportional to the number of IFI 2 and, secondly, a convolution by FFT, with a short and quasi-constant computing time.
Thus, whatever algorithm is used to evaluate R(O),
the computing time varies as the model unit-cell volume.
The R(O) computing time can therefore be reduced, following (7), 23/(3) 3 = 2.37 times, in comparison with the TR rule, for the same map.
The effect of limited resolution needs also to be discussed.
The 'electron density' (Fig. la) corresponds to an unlimited resolution. In the more realistic case of limited resolution D, this ideal electron density is widened by convolution with the sine( ) function
sin ( 2zcx/D)/ ( 2ztx/D),
leading to the density shown in Fig. 2. Strictly speaking the size of the model becomes infinite, but it is commonly, and more practically, chosen as the width at half the height
2B --, 2 B + D / 2 (8) and the inequality (6) becomes
A > C + 2 B + D / 2 . (6') In actual situations, the resolution D varies as the radius B of the model, as does the radius C of U; the
A L A I N L I F C H I T Z 135 period A can be corrected by a roughly constant
multiplicative factor: thus, following (6'), in the case for example of lysozyme, which fits within a 20 A radius sphere, the side of the hypothetical unit cell, at 6 / k resolution, is 63/k long and following (7) only 60 A. In practice, the difference (5%) can be generally neglected, and (7) seems to lead to satisfactory structure resolution by M R (Harada, Lifchitz, Berthou & Jolles, 1981).
4.2. Two-dimensional model
'Orientation' and 'shape' have very restricted mean- ing for the above one-dimensional (1D) model. The restriction disappears with a two-dimensional (2D) model which can be conveniently used to discuss the role played by these factors.
The area S of the lozenge (Fig. 3) circumscribing the limiting circle of the 2D model is
S = 4B2/sin a.
The minimum of this area corresponds to a square (a = 90 °) and justifies the choice of orthogonal P1 hypo- thetical cells. This can be extended to an ellipsoidal model, where the smaller limiting rectangular cell has the dimensions and the orientation of the ellipse axes. Although, in practice, no special attention seems to have been given to the initial orientation of the model (which is clearly arbitrary...), one can see, following elementary geometrical considerations, that the selec- tion of an adequate relative orientation between the model and its unit cell, will again save computing time.
E
~.]
2A ' xFig. 2. Widening effect of the limited resolution D, on the one-dimensional electron density.
i s
2 B
Fig. 3. The circumscribing square is the cell • with the smaller area S.
Application of (6) or (7) is performed by selecting an adequate magnified homothetic cell of the reduced limiting cell containing the model.
4.3. Undersized cells
When (6), (7) or (6') are not satisfied, the resulting undersized unit cells lead to Patterson function overlaps from adjacent origins. The corresponding perturbation of the Patterson function can be evaluated from the two following points:
- Let x be the relative distance between two identical domains of size L and of volume V ~ L N in N-dimensional space. The size of the domain overlap (when it occurs...) is (1 - x ) L and it has a volume A V ~, (1 -- x ) N L N. The relative volume overlap of these two domains is
A V / V , , ~ ( 1 - x) N. (9) The relative disturbing effect varies directly as A V / V , which is plotted Fig. 4 for N = 1, 2, 3.
For weak overlaps (1 > x >> ½), A V / V decreases drastically as N increases, and takes very small values: e.g. at 3D (N = 3) for an overlap of 10% A V / V = 10 -3. - The Patterson function of an individual molecule is a self-correlation function, and its mean local value falls off in a similar way to the preceding law (9) with x representing the relative distance from the origin: consequently, values of a 3D Patterson function are very small in its peripheral region (in vector formalism, it can be said: there are few long vectors in a molecule). As quoted by Lattman (1982), the effects of placing this function in a lattice with spacings somewhat smaller than the diameter of the Patterson function are slight. In this sense one can undersample the transform IFcl 2 of the Patterson function, compared with the criteria of the sampling theorem (Whittaker, 1915; Shannon, 1949).
As it is derived in the Appendix, from the expression of the perturbation by overlap of the Patterson function, the mean relative disturbing effect, on the local value of R (0), is roughly
A R / R ,~ 504(1 -- x) 9 (10) d V 7 0- 0 . 2 5 0 . 1 2 5 0 . . . i 2 D i 0.5 1 x
Fig. 4. Plots, for the physical dimensionality values, of the relative volume overlap of two objects versus the relative distance.
136 M O D E L C E L L F O R T H E R O T A T I O N F U N C T I O N when the integration volume U is the Patterson function
itself, and
AR'/R' ~ 6 9 ( ] - - x ) 6 ( ] - x) 3 (11) when U is the model envelope, x is the relative distance between two adjacent Patterson functions (½ < x < 1 for the first case and ½ < x < ~] for the second).
This shows, in particular, that (6) can be substituted for (6') with an unimportant loss of accuracy. For example, with a linear overlap of 10% expressions (10) and (11) give, respectively, AR/R = 5 × 10 -7 and
A R ' / R ' = 14 x 10 -7.
Thus, it can be predicted that R(O) functions will have very good robustness against over-reduced model cells and limited resolution.
A practical experiment has been performed to test this convenient property of R(O) in its application to MR. F c of an isolated model of the tetragonal form of hen egg white lysozyme (Blake, Mair, North, Phillips & Sarma, 1967) has been used against 380 independent
F o values, in the range 6-25 A, of the orthorhombic high-temperature form (Jolles & Berthou, 1972). Presence of mother liquor in a real crystal alters the intensities of low-angle reflections to a very large extent (Joynson et al., 1970; Lattman & Love, 1970). As recommended by RB such low-order reflections are omitted in the rotation-function calculation, reducing extraneous peaks in the map and giving a simple means of 'sharpening' due to the contrast enhancement (Prothero & Rossmann, 1964).
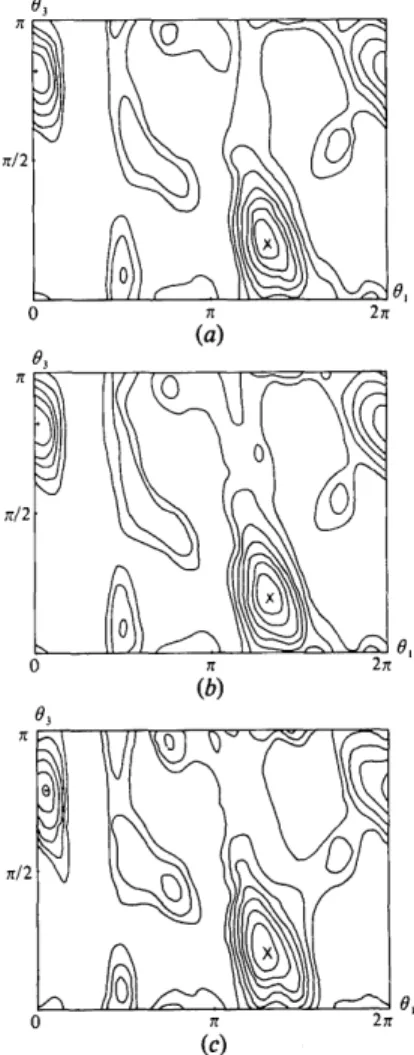
The radius of the limiting sphere of a lysozyme molecule is roughly 20 A, and this was chosen as the radius of the integration sphere U. Three different orthogonal model unit cells, all having cubic shape and P1 symmetry, have been considered: an oversized cell following TR rule (5), a reduced cell following (7) and a heavily undersized cell. The observed crystal has P21212~ symmetry giving a P2~ab rotational Eulerian symmetry to R(O) (Rao, Jib & Hartsuck, 1980). The whole asymmetric unit of R(O) was computed by Crowther's fast rotation program. Results are listed in Table 1, with the corresponding rotation maps in Fig. 5.
Qualitatively and quantitatively the three maps have great similarities. The highest peak of R(O) was in the
same section 02 ~ 67 o in every case. Cells of sides 80 and 60 A lead clearly, in practice, to a very similar result.
The 40/i, cell corresponds to a period A equal to the model size 2B (Fig. la) and, therefore, a total overlap of adjacent Patterson functions (Fig. lb). This leads to a drop in the peak-to-background ratio from 4.3 to 3.9 standard-deviation units, which indicates a slightly disturbed map with a corresponding loss of quality.
In spite of this, the 80 A / 6 0 A and 40 A maps have very similar features with just a slightly rotated main peak. A rewritten expression from Lattman (1972), given in another context, permits the easy evaluation of this small Eulerian rotation:
AO2= AO~ + AO~ + AO] + 2A01AO3 cos 02. (12) Consultation of Table 1 gives A01 = --5 °, A02 = 0 °, A83 = 2.5 °. The small resulting rotation AO = 4.6 ° is (only) of the same order as the sampling increments (5, 5, 2.5) ° used for the computation of the rotation maps. One can also compare O 0 with the orientation (237, 66, 30) ° (Berthou, Lifchitz, Artymiuk & Jolles, 1982) of the molecule at the conclusion of the rigid-body refinement, at the same resolution, which corresponds to a rotation AO = 6.8 o from the orientation found in 80 A / 6 0 / k maps and 7.5 o for the 40 A map: in this case, the slightly disturbed map also permits a satisfactory refinement ....
To conclude, it can be said that significant econ- omies can be made in the calculation of the rotation function between a model molecule and an unknown structure, by a careful choice of the integration volume and of the unit cell in which the model is placed, for calculation of a Patterson function which will be compared with the Patterson function of the unknown structure.
The use of the rotation function, to find the orientation of the molecule, leads to three consecutive and related choices: (i) the model, (ii) the integration volume U and (iii) the hypothetical model unit cell. The choice of a suitable rotated model is, of course, by far the most important.
Some simple theoretical arguments have been given which justify the currently used rule of thumb selecting for U the sphere circumscribing the model itself.
Table 1. Comparison of the rotation functions for three decreasing model hypothetical cells
Observed crystal cell: P2t212 t, a = 56.4, b = 73.8, c = 30.4/k, a = fl = ), = 90 °. Model hypothetical cell: P1, a = b = c, ct = fl = ~ = 90 °.
Maximum value of R(0): Rmax; minimum value of R(O): Rm| n. S t a n d a r d Peak/background
Mean value m deviation a in a units Highest peak
Model ceil (%) (Rma x -- Rmln) (%) (Rma x -- Rmln) (100 -- m)/o 00 = (0 t, 02, 03) °
a = 80 A 37.6 14.5 4.30 240, 67, 35
a = 60 37.8 14.5 4.29 240, 67, 35
A L A I N L I F C H I T Z 137 However, in comparison with U chosen as the limiting
volume of the Patterson function of the isolated model, of the volume around the origin of the observed Patterson function, relevant in the detection of the molecular orientation, is rejected. But consideration of the general law of variation of the mean value of the Patterson function leads to the conclusion that only less than 10% of orientational vectors are omitted in the computation whilst the disturbance of R(O) by extra- neous vectors can be limited to less than 10%.
The volume of the arbitrary model unit cell should be chosen to be as small as possible, following the rule (6)/(7), since the computation effort is proportionately reduced. This rule deduced from elementary geometri-
0 n 2 n (a) ~3 it zr/2 0 03 hi2 0 o (b) Oi 2n n 2~r (e)
Fig. 5. Contours of sections through the main feature of the rotation function R (0) at 6 A: the same sections (02 = 67 o) of the Eulerian cell asymmetric unit, corresponding to the highest peak, is given for three different hypothetical model unit cells. These cells are cubes of side a, PI symmetry, containing one lysozyme molecule. (a) a = 80 A (oversized cell), (b) a = 60 A (reduced cell), (c) a = 40 A (undersized cell). Seven equidistant contours between the mean and maximum values are shown, x is the best orientation, and + indicates the next highest peak. Map (a) and (b) are very similar and (c) is only slightly different from the other two.
cal considerations upon overlaps of Patterson functions at least halved the whole calculation of the rotation function when the classical criterion is used, for the very same map R(8). Moreover, some theoretical arguments and experiments have shown that the computation can even be reduced (up to eight times) with, in general, only weak perturbation of the rotation map.
I thank Drs J. Berthou and A. Soulard who read the manuscript. Thanks are also given to Dr R. A. Crother for kindly supplying a copy of his fast rotation program. The author is indebted to Dr B. T. M. Willis and the two referees for their comments which have improved the final version of this paper.
A P P E N D I X
Let R be an approximate value of the rotation function R(O) - its local mean value. R can vary when adjacent Patterson functions of an individual molecule overlap. The relative variation A R / R versus the relative distance x is studied in the case where some simplifying hypotheses are valid:
(i) the relative linear overlap is low; (ii) we consider only mean local values;
(iii) the molecule has a quasi-spherical shape (therefore the Patterson function also);
(iv) the two Patterson functions correlated to produce R(O) have a quite similar law of variation within the integration volume U.
As quoted in the paper, the law of mean local value fall-off, of the Patterson function P(r) of an individual molecule in N-dimensional space, is a consequence of the relation (9)
P(r) "~ ( 1 - r) u, (A 1) where r, the relative distance from the origin, varies in the range [0,1 ].
We will consider successively two possible inte- gration spheres U for the computation of R(8) as defined by (1): (a) the whole limiting volume of P e, and (b) the limiting volume of the molecule used to evaluate
P c "
A 1. U -- limiting sphere o f the Patterson function Fig. 6(a) schematizes an overlap situation ('aliasing') by undersampling IFcl 2, The relative resulting linear overlap is clearly:
(1 - x ) . (A2)
It is a 'simple' overlap, as in the case of the following derivation, until:
138 MODEL CELL F O R T H E R O T A T I O N F U N C T I O N Otherwise a 'double' overlap occurs, because of the
periodical nature of the Patterson function.
From consideration of the relation (A 1) and Fig. 6 (a), the mean local disturbance of the Patterson function, by overlap of the adjacent Patterson function, evaluated at the centre of this overlap region, is given by
A P c ( x ) = ( 1 - x ) N.
(A4)
The volume of an N-sphere of radius r is
V(r) = AN rN (A5)
and thus the surface area of this N-sphere
S(r) = a N N r u-~, (A6)
where A N is a constant.
If the overlap region may be considered spherically shaped, its volume is
AN(1 -- X) N (A7)
from (A 2), as the relative scale between r and x is 2. To find the total volume of overlap, the number of contacts with the nearest neighbours must be taken into account:
A V = 2NAN(1 - x) N. (A8)
On the other hand, R(O) is the integral of the product of two Patterson functions within the in- tegration volume U:
R = y p2(r)S(r)dr. (A9)
U
Using the relation (A 1) and (A6)
1 R = A N N f rN--l(1--r)2Ndr, (A10) 0 U .4 .L 0 ; } 11 I p, ' (a) u i ~ , 1 i .r J I i t - .vl .L I i , ' x (b) [ i , , , ' i ._v 2
Fig. 6. Evaluation of the disturbing overlap from adjacent Patterson functions in a lattice, depending on the relative spacing x. (a) The integration volume U is the limiting volume of the Patterson function (size of U - 1). (b) U is the limiting volume of the model (size of U = ~).
which involves a classical integral (e.g. Dwight, 1961) and finally
R =AN/C~N, ( a l l )
where C~N stands for the number of combinations of N objects among 3N.
The disturbance of the rotation function is easily evaluated, if the disturbance of the calculated Patterson function is taken as constant within the small volume A V
AR = Po(X).ZV.APc(x), (A 12)
and, substituting (A 1), (A4) and (A8):
AR = 2NAN(1 - x) 3N. (A13)
This gives for the relative disturbance of the rotation function:
A R / R = 2NC~N (1 - x) aN. (A 14)
A2. U - - limiting sphere o f the model
As can be seen (Fig. 6b), the relative linear overlap, within the integration volume U, has now an expression different to (A 2):
( t - - x). (A 15) with x in the range
[½,tl.
The homologous expressions of (A4), (A8) and
(A 10) are: AP" = (t - x) N (A 16) A V ' = 2NAN( i - x) N (A17) 1 / 2 R ' = A N N f rv-~(1--r)2Ndr. (A18) 0
R' can be expressed as a function of R:
)
R' = 1-- ~ C~N/23N R. (A19)
p = 0
Fig. 6(b) shows that in comparison with the preceding case, some dissymmetry now exists between the values of Po and Pc at the centre of the overlap region, leading for the disturbance of R' to
AR' = P o ( X - ~ t ) A V ' A P ' ( x ) (A20) and by substitution
AR' = 2NAN( t - x)2N(~ - X) s, (A21) giving for the relative disturbances of the rotation function:
A R ' / R ' = 2NC~N(]-- x)2N(~-- x)N
N - - I
1-- Z C~N/23N (A22)
A L A I N L I F C H I T Z 139
References
BERTHOU, J., LIFCHrrz, A., ARTYMIUK, P. & JOLLES, P. (1982).
Proc. R. Soc. London Ser. B. In the press.
BLAKE, C. C. F., MAIR, G. A., NORTH, A. C. T., PHILLIPS, D. C. &
SARMA, R. (1976). Proe. R. Soc. London Ser. B, 167, 365- 377.
BoTr, R. & SARMA, R. (1976). J. Mol. BioL 106, 1037-1046. BUEHNER, M., LIFCHITZ, A., BALLY, R. & MORNON, J. P. (1982). J.
MoL Biol. 159, 353-358.
BUERGER, M. J. (1959). Vector Space, pp. 239-249. New York: John Wiley.
COLMAN, P. M., DEISENHOFER, J., HUllER, R. & PALM, W. (1976).
J. Mol. Biol. 100, 257-282.
CRAVEN, B. M. (1975). Computer Programs ROTRAN for the Determination of Crystal Structures which Contain Rigid Body
Fragments of Known Structure. Crystallography Department,
Univ. of Pittsburgh, PA 15260, USA.
CROWTHER, R. A. (1972). The Molecular Replacement Method,
edited by M. G. ROSSMANN, pp. 174-177. New York: Gordon and Breach.
DWIGHT, H. B. (1961). Table of Integrals and Other Mathematical
Data. New York: MacMillan.
HAC~rtT, M. L., FORD, G. C. & ROSSM,~rN, M. G. (1973). J. Mol.
Biol. 78, 665-673.
HARADA, Y., LwcHrrz, A., BERTHOU, J. & JOLLES, P. (1981). Acta
Cryst. A37, 398-406.
HONER, R. (1970). Crystallographic Computing, edited by F. R. AHMED, pp. 96--102. Copenhagen: Munksgaard.
JOLLES, P. & BERTHOU, J. (1972). FEBSLett. 23, 21-23.
JOY'NSON, M. A., NORTH, A. C. T., SARMA, V. R., DICKERSON, R. E. & STEINRAtW, L. K. (1970). J. Mol. Biol. 50, 137-142. KITTEL, C. (1968). Introduction to Solid State Physics. New York:
John Wiley.
LATrMAN, E. E. (1972). Acta Cryst. B28, 1065-1068. LATTMAN, E. E. (1982). Private communication.
LATTMAN, E. E. & LOVE, W. E. (1970). Acta Cryst. B26, 1854-1857.
LIFCHITZ, A., HARADA, Y., MORRIS, F., LAURENT, A. & BERTHOU, J. (1977). Abstracts B. Fourth Eur. Crystallogr. Meet., Oxford. PII. 12, pp. 426-427.
NIXON, P. E. & NORTH, A. C. T. (1976). Acta Cryst. A32, 320-333.
PROTHERO, J. W. & ROSSMANN, M. G. (1964). Acta Cryst. 17, 768-769.
RAO, S. N., JIH, J. H. & HARTSUCK, J. A. (1980). Acta Cryst. A36, 878-884.
ROSSMAr~, M. G. & BLOW, D. M. (1962). Acta Cryst. 15, 24-31. SAS~A, Y. (1964). Acta Cryst. 17, 611-612.
SCHMIDT, W. C. JR, GmLn~G, R. L., HOUSTON, T. E., SPROUL, G. D., AMMA, E. L. & HUISMAN, T. H. J. (1977). Acta Cryst. B33, 335-343.
SHANNON, C. E. (1949). Proc. IRE, 37, 10-21. TAYLOR, C. A. (1954). Acta Cryst. 7, 757-763.
TOLL~, P., MAIN, P. & ROSSMAr~, M. G. (1966). Aeta Cryst. 20,
404--407.
TOLLn~, P. & ROSSMa_~, M. G. (1966). Acta Cryst. 21, 872-876. VAND, V. & PEPr~SKY, R. (1956). Z. Kristallogr. 108, 1-14. WHrrrAK~R, E. T. (1915). Proc. R. Soc. Edinburgh Sect. B, 35,
181-194.
A c t a Cryst. (1983). A39, 139-148
Conditions for Direct Structure Imaging in Silicon Carbide Polytypes
BY DAVID J. SMITH AND M. A. O'KEEFE
High Resolution Electron Microscope, University o f Cambridge, Free School Lane, Cambridge CB2 3R Q,
E n g l a n d
(Received 23 February 1982; accepted 19 August 1982)
A b s t r a c t
The conditions appropriate for direct structure imaging of silicon carbide polytypes in the high-resolution electron microscope have been investigated. Weak- phase-object calculations confirm that a resolution of better than 2.5 A is necessary before polytypic stacking sequences can be identified directly. Furthermore, resolutions closely approaching 1 A are required to resolve projected pairs of S i - C atoms, and considerably better than 1 A is necessary to differentiate between the two species. Extensive multi-slice calculations, based on both current and projected electron-optical charac- teristics, show that polytype stacking should be recognizable at 500 kV up to thicknesses of 4 5 - 7 5 A, but not at 100 kV, except possibly at the 'reversed' 0567-7394/83/010139-10501.50
Scherzer defocus position with extremely coherent illumination. The occurrence of Fourier images com- plicates recognition of the correct objective-lens defocus particularly for thin crystals of the 3C polytype. In thicker-crystal regions ( > 1 0 0 A), where linear image contributions are small, mutual interference between diffracted beams results generally in polytype images of apparently improved resolution and, at specific thickness and defoeus values, leads to images of 3C resembling the 'atom-pair' configuration. The latter are then explained by consideration of the image amplitude and intensity spectra. Finally, the problems of recover- ing specimen structure from crystals of intermediate thickness, as well as some of the factors affecting any quantitative experimental studies, are briefly dis- cussed.