HAL Id: inserm-02390138
https://www.hal.inserm.fr/inserm-02390138
Submitted on 2 Dec 2019
HAL is a multi-disciplinary open access
archive for the deposit and dissemination of sci-entific research documents, whether they are pub-lished or not. The documents may come from teaching and research institutions in France or abroad, or from public or private research centers.
L’archive ouverte pluridisciplinaire HAL, est destinée au dépôt et à la diffusion de documents scientifiques de niveau recherche, publiés ou non, émanant des établissements d’enseignement et de recherche français ou étrangers, des laboratoires publics ou privés.
nanoPaint: a Tool for Rapid and Dynamic Imaging of
Membrane Structural Plasticity at the Nano- Scale
Mariana Tasso, Thomas Pons, Nicolas Lequeux, Diana Zala, Zsolt Lenkei,
Julie Nguyen
To cite this version:
Mariana Tasso, Thomas Pons, Nicolas Lequeux, Diana Zala, Zsolt Lenkei, et al.. nanoPaint: a Tool for Rapid and Dynamic Imaging of Membrane Structural Plasticity at the Nano- Scale. Small, Wiley-VCH Verlag, 2019, 15 (47), pp.e1902796. �10.1002/smll.201902796�. �inserm-02390138�
1
nanoPaint: a Tool for Rapid and Dynamic Imaging
of Membrane Structural Plasticity at the
Nano-Scale
Mariana Tasso*, Thomas Pons, Nicolas Lequeux, Julie Nguyen, Zsolt Lenkei† and Diana Zala†*
Dr. M. Tasso
Instituto de Investigaciones Fisicoquímicas Teóricas y Aplicadas (INIFTA), Departamento de Química, Facultad de Ciencias Exactas, Universidad Nacional de La Plata - CONICET, Diagonal 113 y 64, 1900 La Plata, Argentina.
E-mail: [email protected] Dr. T. Pons, Prof. N. Lequeux
LPEM, ESPCI ParisTech, PSL Research University, CNRS UMR 8213, Sorbonne Universités, 10 rue Vauquelin, 75005 Paris, France.
J. Nguyen, Dr. Z. Lenkei, Dr. D. Zala
Brain Plasticity Unit, ESPCI ParisTech, PSL Research University, CNRS UMR 8249, Paris, France. Center of Neuroscience and Psychiatry, INSERM U894, Paris Descartes University, 102-108 rue de la Santé, 75015 Paris, France.
E-mail: [email protected]
† contributed equally to this work.
Keywords: super-resolution microscopy, quantum dots, cannabinoid receptor type 1, neuronal plasticity, synapses
Single-particle tracking with quantum dots (QDs) constitutes a powerful tool to track the nanoscopic dynamics of individual cell membrane components unveiling their membrane diffusion characteristics. Here, the nano-resolved population dynamics of QDs is exploited to reconstruct the topography and structural changes of the cell membrane surface with high temporal and spatial resolution. For this proof-of-concept study, bright, small and stable biofunctional QD nanoconstructs are utilized recognizing the endogenous neuronal cannabinoid type-1 receptor, a highly-expressed and fast-diffusing membrane protein, together with a commercial point-localization microscope. Rapid QD diffusion on the axonal plasma membrane of cultured
2
hippocampal neurons allows precise reconstruction of the membrane surface in less than one minute with a spatial resolution of tens of nanometers. Access of the QD nanoconstructs to the synaptic cleft enables rapid 3D topological reconstruction of the entire presynaptic component. Successful reconstruction of membrane nano-topology and deformation at the second time-scale is also demonstrated for HEK293 cell filopodia and axons. Named “nanoPaint”, this super-resolution imaging technique amenable to any endogenous transmembrane target represents then a versatile platform to rapidly and accurately reconstruct the cell membrane nano-topography, thereby enabling the study of the rapid dynamic phenomena involved in neuronal membrane plasticity.
1. Introduction
The surface topology of many cell types is continuously adapting to intracellular and extracellular cues. In neurons, rapid structural modification of the synapse, the relay of neuronal information, is one of the fundamental processes of learning and memory. This was shown in dendritic spines, the typical post-synaptic component in excitatory synapses, with tightly-linked structure and function.[1]
However, it is still unknown whether the presynaptic bouton adapts its shape during functional plasticity. Indeed, observation of the presynaptic bouton typically requires visualization methods based on Super-Resolution Microscopy (SRM). For dynamic studies, the major bottleneck of SRM techniques is the time required to obtain sufficient information to reconstruct membrane shapes with acceptable accuracy, which is usually of tens of minutes, precluding then the use of this technique to image more rapid events.
Single Molecule Localization Microscopy (SMLM) belongs to the recently-developed SRM modalities for fluorescent probes whose spatial and temporal resolution gives now access to domains and events of biological relevance.[2,3] At large, SMLM has been applied to the translation
of fluorescence emission intensities into spatial coordinates, thereby enabling single-particle tracking with unprecedented detail.[4] In cell biology, SMLM has found numerous applications
3
pathways,[13,14] among others. In particular, Point Accumulation for Imaging in Nanoscale
Topography (PAINT) modalities have emerged as a powerful and versatile technique to reconstruct super-resolved images of biomolecular structures and cell membranes.[15–18] This technique relies on
the super-localization of individual fluorophores bound to the target of interest. These will eventually photobleach and be replaced by a large pool of free, unbound fluorophores present in the solution. However, the dynamics of exchange between photobleached and new, unbleached probes is slow. This process can be accelerated by increasing the concentration of free probes in solution, though this increases the fluorescent background and eventually prohibits the detection of isolated bound fluorophores. In practice, fully reconstructed images often require several tens of minutes of acquisition, thereby preventing the study of fast dynamic events. This limitation may be lifted using FRET–based probes,[19] though at the expense of adding two fluorophores, complex antibody-DNA
constructs and finely-tuned complementary strands. Noteworthy, this technique has so far only been demonstrated for fixed cells.[20–22]
The use of quantum dot (QD) nanoparticles as alternative fluorescent probes in highly sensitive biological imaging has witnessed major advances, with the QDs becoming instrumental in several SRM techniques due to their intrinsic brightness, enhanced photostability, broad excitation, narrow and tunable emission wavelengths.[3,23–26] By combining SRM with brilliant and robust
fluorescent probes as the QDs, it is possible to follow the rapid dynamics of cell membrane components, like receptors or transporters, with high temporal and spatial resolution. Cumulative integration of the spatial localizations of rapid co-diffusing ligand-target pairs in the 3D-fluid cell membrane has the potential to enable the reconstruction of the plasma membrane morphology and the follow-up of its dynamic changes in nanoscopic cellular volumes. Such approach was recently used to create a diffusion and morphological map of the axonal initial segment[27] and of dendritic
spines.[9] However, these studies relied on probes that require the genetic expression of a GFP tag
on the target molecule followed by the addition of either QDs-streptavidin-anti-GFP(biotin) nanoconstructs[27] or a primary plus secondary biotinylated antibodies and then QDs-streptavidin.[9]
4
To our knowledge, the application of these methods to track an endogenous receptor, the use of nanoprobes suitable to label any cell membrane biomolecule without the need for transfection and the rapid (seconds) reconstruction of the cell membrane in 3D has not been demonstrated yet.
In this work, our previously-developed biofunctional QD nanoconstructs[28], now adapted to
target the type-1 cannabinoid (CB1) receptor, a rapidly-diffusing cell membrane protein,[29] are
utilized as 'painting' agents in SRM to rapidly draw the cell membrane in 3D with nanoscopic resolution. Named "nanoPaint", this method is amenable to track the dynamics of endogenous cell membrane biomolecules and has proved instrumental to map the topography and morphological changes of cell membranes. In opposition to DNA-PAINT methods, nanoPaint does not involve a transiently-bound association: the binding between antibody and protein is strong; the QD molecular pencils remain photostable and associated to the target even when the latter is internalized. Furthermore, theoretical modeling indicates that the extent of the topographic reconstruction of cell membranes throughout a defined time period depends upon the surface density of the nanoconstructs, which is easily controlled by tuning the concentration of the nanoprobes in the cell medium. Thanks to the capacity of the nanoconstructs to access and diffuse into the synaptic cleft, nanoPaint made it possible to rapidly draw (in less than 1 minute) a nanoscopic 3D map of the pre-synapses and of the synaptic cleft. Insights of spontaneous, nanometric membrane deformation lasting seconds in HEK-293 cells and in neurons add versatility to the nanoPaint method and highlight its potential as a precision tool for neuronal plasticity studies.
2. Results and Discussion
The red-emitting (em = 650 nm) CdSe/CdS/ZnS multishell quantum dots employed in this work
were synthesized following published protocols.[30,31] These inorganic nanoparticles are capped with
a vinylimidazole-sulfobetaine copolymer ligand that bears primary amine side chains to be used for bioconjugation.[28] These QD nanoparticles demonstrated: a) high colloidal stability and a conserved
5
and c) a remarkable colloidal stability in the cell cytoplasm after electroporation and follow-up for ~50 h.[28] Such properties are vital in proposing these nanoprobes as tools for biological/cellular
investigations as they ensure minimal non-specific interactions with the cell membrane and with non-targeted species. To render these nanoparticles bio-specific, the oriented immobilization of whole antibodies via an intermediate protein A layer was developed.[28] Once the protein A layer is
bound to the nanoparticles, the resulting QDs-pA nanoconstructs are kept in pH 7.5 buffer at 4ºC and utilized as needed to bind to selected antibodies (Ab) simply by mixing at a 1:4 QD:Ab molar ratio. These QD-pA nanoconstructs (Figure 1a) thus constitute a universal platform for the oriented immobilization of whole antibodies, thereby providing unrestricted versatility to the nanoPaint approach since Abs can be raised against most transmembrane proteins, cell receptors or other membrane-confined biomolecules.
For the proof-of-concept demonstration of the nanoPaint method, the type-1 cannabinoid (CB1) receptor was used as cell membrane target. The CB1 receptor, the brain target of marijuana and endocannabinoid ligands, is one of the most abundant G protein-coupled receptors in the brain, well recognized for its capacity to modulate synaptic plasticity and neuronal development.[32,33] The
CB1 receptor has been shown to constitutively cycle between cell membrane and cytoplasm via the endocytic pathway.[34] In simple terms, this cycling results in membrane receptors being
internalized over time and accumulating in cellular endosomes while others are re-cycled from the endosomes to the cell membrane. In neurons, this cycling is necessary for the axonal targeting of the receptor, which is first expressed in the somato-dendritic compartment, endocytosed and actively transported by transcytosis into the axonal compartment where it resides on the cell membrane.[35] As a result, the CB1 receptor has a highly-polarized distribution and is mainly found
in axons; it is therefore an excellent membrane marker of the axonal and pre-synaptic compartments. Both, single molecule tracking and Fluorescence Recovery After Photobleaching (FRAP) methods,[29,35] have indicated high membrane diffusion rates for the CB1 receptor, making it a
6
either the endogenous CB1 receptor or the heterogeneously-expressed FLAG-CB1-GFP (Green Fluorescent Protein, GFP) fusion protein[34,36] (Figure 1b). Expression of the fluorescently-tagged
CB1 receptor ensured facile recognition of receptor-expressing neurons and provided a control to evaluate the specificity of recognition of the CB1 receptor by the biofunctional QDs. On the other hand, the endogenous form allowed to confidently evaluate and monitor receptor behavior and its relationship with neuronal membrane plasticity without putative over-expression artifacts. We therefore started with the over-expressed receptor and moved towards the endogenous one. The FLAG-CB1-GFP and endogenous CB1 receptors were detected with anti-FLAG and anti-CB1 Abs, respectively (Figure 1b). The QD-Ab bioconjugates resulting from binding of the anti-FLAG Ab to QD-pA nanoconstructs had an overall diameter of ~27 nm and possessed 1–2 fully functional Abs per dot.[28] Noteworthy, the size of the nanotools can be modulated by decreasing the size of the
target-recognition species (e.g. using antibody fragments instead of whole antibodies) or avoiding the use of protein A and directly binding the target-recognition species to the QD ligand.
Throughout this work, typical experiments involved the exposure of primary cultures of rat hippocampal neurons to diluted (1–3 nM) suspensions of QD bioconjugates followed by microscopic monitoring either on a wide-field epifluorescence microscope (Figure 1) or on a commercial point-localization microscope (Figures 2–4). One of the first insights of the notorious difference between single-particle tracking observations with QDs compared to GFP-expressing receptors was obtained by tracing kymographs depicting the temporal movement of both, QD nanoconstructs bound to FLAG-CB1-GFP receptors and the GFP receptor's tag (Figure 1b and
Figure S1). Kymographs, which depict the position and signal intensity variations of an emitter as a
function of time, highlight distinct patterns (Figure 1d): QDs produce trace patterns of receptor movement that are sharp, oscillatory and well contrasted compared to the surrounding areas thanks to QDs’ salient brilliance and to the fact that, at short times after the addition of the nanoconstructs, only a subpopulation of the membrane CB1 receptors is bound to the QDs (Figure 1c and VideoS1, QD panel as opposed to the FLAG-CB1-GFP panel). Being able to tune the QD concentration in the
7
cell medium results in a subpopulation of the receptor to be tracked, thus facilitating single-particle analysis. GFP-related kymographs, on the other hand, highlight only GFP clusters present in endosomes since the green GFP signal is homogeneous and widespread on the cell membrane (Figure 1c, FLAG-CB1-GFP panel) and can therefore not be identified as a single-particle object by current analytical tools. Finally, the maximal projection of the 2-min long recording (Figure 1c) showed that the majority of neurites have been completely covered by the QD localizations, suggesting that the PAINT (Point Accumulation for Imaging in Nanoscale Topography)[15] method
using over-expressed CB1 receptors can efficiently draw the membrane surface in less than two minutes.
Having previously demonstrated the specific recognition of the CB1 receptor by the QD bioconjugates[28] and the high diffusion of the QDs bound to receptors at the plasma membrane in
the wide-field epifluorescence experiments above, we moved to super resolution microscopy for single-particle tracking at high spatio-temporal resolution. The aim was to go beyond single-particle tracking by exploiting its wealth of particle trajectories to reconstruct the cell membrane in nearly real time, in 3D and with nano-scale resolution. Noteworthy, since the QD solution is not removed from the cell medium, there is a continuous availability of QD nanoconstructs to newly-exocytosed CB1 receptors. This allows to follow receptor population dynamics over sufficiently long periods of time (~hours) without photobleaching as well as to tune the surface density of QDs over time by adjusting the QD solution concentration. Importantly, the experiments reported here were carried out under highly-inclined thin illumination (HILO),[37] implying that the excitation of the QDs can
be tuned to thin sections containing the structure to be reconstructed. In addition, the fast acquisition rate of 16 ms per frame ensured that only receptor-bound QDs displaying a slower diffusion coefficient (as compared to the free QDs in the medium) will be recognized as single particles by the detection algorithm.[16]
With the nanoPaint approach and by superimposing QD's localizations, a sequential reconstruction of the cell membrane as ‘explored’ by the nanoconstructs can be rapidly obtained
8
(Figure 2). Increasing the acquisition time (i.e. the number of 16 ms frames whose individual spatial localizations are superimposed) substantially increases surface coverage, allowing to reconstitute the shape and location of entire filopods or synaptic boutons, as demonstrated below. This wealth of information is independent of the ad-hoc optimization of fluorescent probes (such as those required for PALM microscopy), the reliance on cell fixation or on very laborious techniques like TEM, both prone to introduce artifacts,[38,39] or the need for pre-incubation steps with
antibodies prior QDs’ introduction.[9] The nanoPaint method uniquely relies on the use of QD
nanoconstructs of tunable fluorescence emission bioconjugated to primary antibodies. These very bright fluorescent nanoconstructs permit a lateral resolution below 55 nm as measured by Fourier ring correlation[40] (Figure S5) and an axial resolution of 85 nm as measured by fiduciary markers
(QDs unspecifically bound to the coverslip). Consequently, the nanoPaint method may thus serve both single-particle tracking as well as surface reconstruction purposes.
The efficacy of cell surface reconstruction depends both, on the number of QDs whose trajectories are being followed and on the acquisition frequency (number of frames per second). In our experience, in particular for transfected cells, surface coverage also depends on the transfection rate and the specific cellular sub-compartment imaged (soma, dendrites or axons). Finally, surface coverage also depends on the total area to be reconstructed: as observed in Figure 2, there are areas on the full field of view that appear less well reconstructed than others depending on whether the cell membrane itself and/or the QD nanoconstructs that are possibly “painting” that area are close to the focal plane or not. In general, assuming a random, uncorrelated motion of QDs, the reconstructed area fraction f is given by Equation 1, where d is the QD surface density and A1 is the
area reconstructed by one QD.
9
Assuming a 2D Brownian motion of the QDs on the cell surface, simulations show that the reconstructed area A1 depends on the diffusion coefficient D and on the time (Figure S2a,b). For
slowly diffusing QDs, A1 initially increases with D, then saturates when the mean-square
displacement between two consecutive images becomes larger than the resolution of the reconstructed trajectory (Figure S2b). After reconstructing diffusion trajectories of single anti-FLAG QDs targeting anti-FLAG-CB1-GFP transmembrane receptors, we obtained an average diffusion coefficient D ≈ 0.19 µm2s-1 (165,000 reconstructed displacements). This is consistent with a
previous estimation of 0.175 µm2s-1 obtained by single-particle tracking in cultured neurons.[29]
With this diffusion coefficient, simulations predict that the reconstructed fraction should follow an exponential law with time (Figure S2c, Equation 2). The characteristic reconstruction time depends on the QD density, d, with d− (s·m2) assuming a 20 nm reconstruction resolution
and a 16 ms time lag between two consecutive acquisitions.
𝑓(𝑡) ~1 − 𝑒−𝑡/𝜏 (2)
In both ROIs presented as examples in Figure 2, the QD density was approximately 0.2 µm-2. These
membrane surfaces should then be theoretically reconstructed at 50% in about 185 s (Figure S2d). As shown in Figure 2, this theoretical estimation is consistent with experimental observations. While these simulations enable the estimation of the average reconstruction time for a given target density, the final membrane reconstruction speed relies on random QD blinking and on stochastic Brownian motion in each specific ROI. We can predict that, at this reconstruction resolution, faster diffusion coefficients would not strongly improve the reconstruction speed (Figure S2b). However, increasing the QD density strongly does (Equation 1; Figure 2c,d) and, assuming that target density is not a limiting factor, this is easily implemented by increasing QD concentration in the cell medium. As an example, with a diffusion coefficient of 0.19 µm2s-1 and a QD density of 1 µm-2, on
10
20 nm reconstruction resolution and 16 ms time lag between two consecutive acquisitions). Nevertheless, in practical terms, QD density can't be increased indefinitely with the intention to reconstruct faster. The limit is single particle tracking, i.e. the capacity of the tracking algorithms to identify QDs as single emitters.
Once the cell surface reconstruction capacity of the nanoPaint method was demonstrated and the effect of the reconstruction parameters was theoretically analyzed, we investigated whether QDs-anti-FLAG bound to over-expressed FLAG-CB1-GFP receptors were able to access and explore the synaptic cleft area (Figure 3). The localization of the synaptic region was confirmed by the expression of tdTomato-Bassoon. Bassoon is a large multi-domain protein of the presynaptic active zone that identifies the presynaptic component.[41,42] Super-resolution point accumulation of
QD trajectories around the areas of high Bassoon expression reveals a high frequency of visit for the QD nanoconstructs accessing the synaptic cleft (note the brighter regions at the active zones) as well as a remarkable reconstruction of the contours of presynaptic boutons (Figure 3a). With the addition of a cylindrical lens, it is possible to generate in 5 min a 3D image of the synaptic boutons and the synaptic cleft that matches other representations of the same areas obtained by more laborious techniques, such as transmission electron microscopy[43] (Figure 3b and VideoS2). Since
surface reconstruction of a given cell membrane region is dependent on its effective surface 'exploration' by the biofunctional QDs during live cell imaging, it is noteworthy that our ~27 nm in diameter QD nanoconstructs appropriately accessed and explored the synaptic cleft. In a pioneering work, Dahan et al. demonstrated that slightly larger QD bioconjugates (QD-streptavidin bound to a secondary plus primary antibody) targeting glycine receptors could be detected in the synaptic cleft, where they possessed smaller coefficients of diffusion as compared to the extra-synaptic QDs.[5] On
the other hand, a recent study comparing different sizes of nanoconstructs recognizing the post-synaptic AMPA receptor (which has an extracellular domain of 12 nm) showed that steric impairment hampers the accessibility and diffusion of large QD-streptavidin nanoconstructs (> 20 nm in diameter) into the synaptic cleft.[44] Recognizing the relatively small extracellular domain of
11
the CB1 receptor, our biofunctional QDs appear to be small enough to access and effectively map the entire topography of presynaptic boutons in mature synapses.
Since rapid, 3D cell surface reconstruction can be obtained with nanoPaint, we tested the method for its capability to record structural plasticity at a nanoscale level and with a time resolution below 1 minute, a relevant scale for rapid cytoskeletal changes. At first, we tested nanoPaint in a model cell line (HEK-293 cells) expressing the FLAG-CB1-GFP[36] receptor and for
which we had previously demonstrated the binding specificity of the QDs-pA-anti-FLAG nanoconstructs.[28] We recorded filopodia (small organelles known to display a highly dynamic
behavior) close to the glass surface and obtained deformation profiles as those illustrated in
Figure4a by a 320 s time projection. The higher magnification shows two consecutive
reconstructions of 16 s (1,000 frames) in green and in magenta of a filopodium, with a cross-section of 200 nm as measured by the distance between the two peaks of intensity of the plasma membrane. Moreover, the y-z cross section indicates that the membrane reconstruction was also efficient in 3D since the reconstruction is covering almost the entire depth of the filopodium; only the bottom is not visited by the QDs, probably due to their difficulty to access this region which is close to the coverslip. The overlay of the two consecutive 16 s reconstructions reveals that the filopodium is elongating and bending at the tip during this time period. To quantify the structural modification, we measured the distance between both reconstructions by tracing a line scan profile and recorded a 85 nm shift of the tip between the two consecutive 16 s recordings. The nanoPaint method is thus able to rapidly and accurately measure nanoscopic deformations of plasma membrane-delimited organelles such as filopodia.
Next, we evaluated the membrane surface mapping capacity of the nanoPaint method by targeting the endogenous CB1 receptor in non-transfected hippocampal neurons. It was a requirement to prove at first the specificity of binding of the QD-pA-anti-CB1 nanoconstructs to the endogenous CB1 receptor. As observed in Figure S3a, the endogenous receptor is highly enriched in axons although it is also ubiquitously present in the plasma membrane of the somato-dendritic
12
compartment, as previously reported.[35] The same can be confirmed for the QD-pA-anti-CB1
nanoconstructs (Figure S3b), with an overlap coefficient of 0.85.[45] By employing QDs recognizing the endogenous CB1 receptor, spontaneous membrane deformations could be recorded in hippocampal neurons with nanometric precision and methodological simplicity (Figure 4b). Interestingly, the comparison of 4 consecutive reconstructions of 80 s time frames revealed several topological changes. The enlargements on the right show a progressive shift of the plasma membrane (Figure 4b1); the formation of a protrusion that could represent the genesis of a new branch (Figure 4b2); and deformations of two protrusions (Figures 4b3 and 4b4). Finally, we could also observe phototoxicity-induced cell surface topological changes in cultured hippocampal neurons by exposing the cells to high laser powers (50% of max. intensity) at 405 nm, a wavelength know to induce phototoxicity. The appearance and steady growth of blebs was evidenced in axons (Figure 4c), with a deformation rate of around 400 nm in 242 s (or 1.65 nms-1) as computed from
the intensity profiles (Figure S4).
Finally, to demonstrate the versatility of the nanoPaint method, we used QDs bound to a protein named “cholera toxin B" (CTB), which is known to bind preferentially to lipid ganglioside GM1 that is enriched in the axonal compartment.[46] With these QD-CTB nanotools, we
reconstructed surface topography in 3D as done with the anti-CB1 QDs (Figure S6). The image in Figure S5 corresponds to a reconstruction time of 34 s, 2100 frames and a 500 nm depth.
3. Conclusions
Together, these results show that QD bioconjugates recognizing epitopes present at the extracellular space of the plasma membrane are effective and simple tools to rapidly (seconds) reconstruct, in conjunction with super resolution microscopy, the topology and dynamics of the cellular plasma membrane in 3D at a nanoscopic level with high temporal-spatial resolution and long-term imaging potentiality. Given the capability of the bioconjugates to access and explore the synaptic cleft, a road of opportunities opens up to explore nano-structural neuronal plasticity with nanoPaint.
13
4. Experimental Section
Materials. The materials required for the synthesis of the QD nanoparticles and of the QD ligand
and the chemicals used for QD bioconjugation were as detailed in Tasso et al.[28] Recombinant
protein A (45 kDa) was purchased from ProSpec as a solution without additives. Bis(sulfosuccinimidyl)suberate (BS3) linker and Rabbit polyclonal anti-CB1 N-Ter antibody (PA1-743) were from Thermo Scientific. Mouse monoclonal anti-FLAG (IgG2) antibody was purchased from Sigma-Aldrich. Neurobasal™, B-27 and Lipofectamine®2000 Transfection Reagent, DMEM
(Dulbecco’s Modified Eagle Medium, high glucose, GlutaMAX without sodium pyruvate), L-glutamine, Fetal Bovine Serum (FBS), penicillin-streptomycin (10,000 U mL-1) and Trypsin-EDTA
(0.05 %) phenol red were obtained from Life Technologies. Rabbit anti-N-terminal-CB1 antibody was produced by Double-X program (Eurogentec) as detailed in Leterrier et al.[34] High precision
coverglasses (1.5H) were from Marienfeld Superior. Ludin Type 1 chambers were purchased from Life Imaging Services (Switzerland).
Quantum dot synthesis and ligand exchange. Red-emitting (em = 650 nm) CdSe/CdS/ZnS
multishell quantum dots were synthesized following published protocols.[30,31] Core/multishell QDs
in hexane (4 nmol) were precipitated by ethanol addition followed by centrifugation (16,000 g, 5 min, unless otherwise stated). After supernatant’s removal, QDs were mixed with 3-mercaptopropionic acid (MPA, 500 µL) using a sonicating bath and then stored at 60°C for 6–12 h. MPA-capped QDs were resuspended in 1 mL chloroform and thereafter precipitated by centrifugation. The obtained QDs were dissolved in ~1 mL DMF and precipitated by addition of ~50 mg of potassium tert-butoxide. The suspension was afterwards centrifuged to remove the basic organic supernatant and the nanoparticles washed twice with ethanol before redispersion in 400 µL of 100 mM sodium bicarbonate buffer (pH = 10.8). Thereafter, the block copolymer ligand (4 mg) was resuspended in 100 mM sodium bicarbonate buffer (200 µL) and added to the MPA-QDs
14
dispersion. The nanoparticles were left overnight at room temperature to complete the cap exchange. Free ligands were removed by two rounds of ultrafiltration (16,000 g, 10 min) in Vivaspin 100 kDa membrane filter units (buffer = 100 mM NaCl). Polymer-capped QDs were thereafter purified by ultracentrifugation (268,000 g, 25 min) in a 10%–40% sucrose gradient in 100 mM NaCl. The QD band was collected and sucrose removed by several rounds of ultrafiltration (100 kDa Vivaspin filter, 16,000 g, 10 min). The ligand-exchanged nanoparticles were finally resuspended in 600 µL of 50 mM HEPES, 100 mM NaCl, pH 7.5 and stored at 4°C in the dark.
Bioconjugation of the QD nanoparticles. Ligand-capped QDs (0.4 nmol) in 100 µL of 50 mM
HEPES, 100 mM NaCl, pH 7.5 buffer were reacted for 30 min with 0.42 µmol of BS3 (50 mg mL-1
stock solution in DMSO; BS3 molar excess to QDs ~1,000) under mixing in a rotating platform. Unreacted BS3 was afterwards removed via three rounds of membrane filtration (50 kDa Vivaspin filter, 16,000 g, 7 min) in 50 mM HEPES, 100 mM NaCl, pH 7 buffer and the linker-modified QDs resuspended in 100 µL of pH 7.5 buffer. Covalent binding of an intermediate protein A layer to the linker-modified QDs was performed by adding a 10× molar excess of protein A to the QD suspension and by letting the reaction proceed for 1 h under mixing in a rotating platform. Here, the total volume was adjusted to yield final QD concentrations of 3–4 µM. After incubation, unreacted protein A was removed via two ultracentrifugation cycles (151,000 g, 25 min). QD-protein A (QD-pA) samples were thereafter resuspended in 100 µL of pH = 7.5 buffer and mixed with ~100 µL of buffer-exchanged antibody (Ab) (rinsing buffer = 50 mM HEPES, 100 mM NaCl, pH = 8.5 adjusted with 2 M NaOH aqueous solution) at a 1:4 QD:Ab ratio. The antibody binding reaction to the QD-pA nanoconstructs was left to evolve for 1h under mixing in a rotating platform. Mouse anti-FLAG (IgG2) and rabbit anti-CB1 N-Ter antibodies were used. Unbound Ab was not removed and the QD-pA-Ab conjugates (~1–1.5 µM) were stored at 4°C until use without the addition of preservatives or other compounds.
15
Supporting Information
Supporting Information is available from the Wiley Online Library or from the corresponding authors. The remaining of the Experimental Section together with Video S1 (Time-lapse of hippocampal neurons expressing FLAG-CB1-GFP (green) incubated for 5 minutes with biofunctional QD-pA-anti-FLAG nanoconstructs) and Video S2 (3D projection of temporal integration (5 min) of QD localizations around a presynaptic terminal) are provided as Supporting Information.
Acknowledgements
The authors wish to acknowledge Maureen McFadden for help with cell culture, Rémi Delaunay for his dedicated research in the follow-up of this project, and Jérémy Ferrier and Renata Santos for critical reading of the manuscript. M. Tasso acknowledges CONICET for funding destined to research and international mobility. This work was supported by the NanoCTC (ANR-10-Nano-05) grant managed by the French Agence Nationale de la Recherche and by the PSL Nanopaint grant (Aux Frontières des Labex) from PSL Research University. Dr. Z. Lenkei and Dr. D. Zala contributed equally to this work.
References
[1] M. Segal, Neurobiol. Learn. Mem. 2017, 138, 3.
[2] T. J. Lambert, J. C. Waters, J. Cell Biol. 2016, jcb. 201610011.
[3] D. Jin, P. Xi, B. Wang, L. Zhang, J. Enderlein, A. M. van Oijen, Nat. Methods 2018, 1.
[4] H. Shen, L. J. Tauzin, R. Baiyasi, W. Wang, N. Moringo, B. Shuang, C. F. Landes, Chem. Rev. 2017, 117, 7331. [5] M. Dahan, S. Lévi, C. Luccardini, P. Rostaing, B. Riveau, A. Triller, Science (80-. ). 2003, 302, 442.
[6] D. S. Lidke, P. Nagy, R. Heintzmann, D. J. Arndt-Jovin, J. N. Post, H. E. Grecco, E. A. Jares-Erijman, T. M. Jovin, Nat. Biotechnol. 2004, 22, 198.
[7] O. Kovtun, D. Sakrikar, I. D. Tomlinson, J. C. Chang, X. Arzeta-Ferrer, R. D. Blakely, S. J. Rosenthal, ACS
16
[8] N. L. Andrews, K. A. Lidke, J. R. Pfeiffer, A. R. Burns, B. S. Wilson, J. M. Oliver, D. S. Lidke, Nat. Cell Biol. 2008, 10, 955.
[9] I. Izeddin, C. G. Specht, M. Lelek, X. Darzacq, A. Triller, C. Zimmer, M. Dahan, PLoS One 2011, 6, e15611. [10] Y. Wang, E. Cai, T. Rosenkranz, P. Ge, K. W. Teng, S. J. Lim, A. M. Smith, H. J. Chung, F. Sachs, W. N.
Green, P. Gottlieb, P. R. Selvin, Bioconjug Chem 2014, 25, 2205.
[11] A. R. Lowe, J. J. Siegel, P. Kalab, M. Siu, K. Weis, J. T. Liphardt, Nature 2010, 467, 600.
[12] R. Jungmann, M. S. Avendaño, M. Dai, J. B. Woehrstein, S. S. Agasti, Z. Feiger, A. Rodal, P. Yin, Nat.
Methods 2016, 13, 439.
[13] S.-L. Liu, Z.-L. Zhang, E.-Z. Sun, J. Peng, M. Xie, Z.-Q. Tian, Y. Lin, D.-W. Pang, Biomaterials 2011, 32, 7616.
[14] D. Bhatia, S. Arumugam, M. Nasilowski, H. Joshi, C. Wunder, V. Chambon, V. Prakash, C. Grazon, B. Nadal, P. K. Maiti, L. Johannes, B. Dubertret, Y. Krishnan, Nat. Nanotechnol. 2016, 11, 1112.
[15] A. Sharonov, R. M. Hochstrasser, Proc. Natl. Acad. Sci. 2006, 103, 18911 LP.
[16] G. Giannone, E. Hosy, F. Levet, A. Constals, K. Schulze, A. I. Sobolevsky, M. P. Rosconi, E. Gouaux, R. Tampé, D. Choquet, L. Cognet, Biophys. J. 2010, 99, 1303.
[17] R. Jungmann, M. S. Avendano, J. B. Woehrstein, M. Dai, W. M. Shih, P. Yin, Nat Meth 2014, 11, 313. [18] A. Aloi, N. Vilanova, L. Albertazzi, I. K. Voets, Nanoscale 2016, 8, 8712.
[19] A. Auer, M. T. Strauss, T. Schlichthaerle, R. Jungmann, Nano Lett. 2017, 17, 6428.
[20] W. R. Legant, L. Shao, J. B. Grimm, T. A. Brown, D. E. Milkie, B. B. Avants, L. D. Lavis, E. Betzig, Nat.
Methods 2016, 13, 359.
[21] J. Lee, S. Park, W. Kang, S. Hohng, Mol. Brain 2017, 10, 63.
[22] N. S. Deußner-Helfmann, A. Auer, M. T. Strauss, S. Malkusch, M. S. Dietz, H.-D. Barth, R. Jungmann, M. Heilemann, Nano Lett. 2018, 18, 4626.
[23] X. Michalet, F. F. Pinaud, L. A. Bentolila, J. M. Tsay, S. Doose, J. J. Li, G. Sundaresan, A. M. Wu, S. S. Gambhir, S. Weiss, Science (80-. ). 2005, 307, 538.
[24] T. Pons, H. Mattoussi, Ann. Biomed. Eng. 2009, 37, 1934.
[25] H. Mattoussi, G. Palui, H. Bin Na, Adv. Drug Deliv. Rev. 2012, 64, 138. [26] K. D. Wegner, N. Hildebrandt, Chem. Soc. Rev. 2015, 44, 4792.
[27] D. Albrecht, C. M. Winterflood, M. Sadeghi, T. Tschager, F. Noé, H. Ewers, J. Cell Biol. 2016, 215, 37. [28] M. Tasso, E. Giovanelli, D. Zala, S. Bouccara, A. Fragola, M. Hanafi, Z. Lenkei, T. Pons, N. Lequeux, ACS
Nano 2015, 9, 11479.
17 [30] W. W. Yu, X. Peng, Angew. Chemie Int. Ed. 2002, 41, 2368.
[31] J. J. Li, Y. A. Wang, W. Guo, J. C. Keay, T. D. Mishima, M. B. Johnson, X. Peng, J. Am. Chem. Soc. 2003, 125, 12567.
[32] P. E. Castillo, T. J. Younts, A. E. Chávez, Y. Hashimotodani, Neuron 2012, 76, 70. [33] A. L. Gaffuri, D. Ladarre, Z. Lenkei, Pharmacology 2012, 90, 19.
[34] C. Leterrier, D. Bonnard, D. Carrel, J. Rossier, Z. Lenkei, J. Biol. Chem. 2004, 279, 36013.
[35] A. C. Simon, C. Loverdo, A.-L. Gaffuri, M. Urbanski, D. Ladarre, D. Carrel, I. Rivals, C. Leterrier, O. Benichou, P. Dournaud, B. Szabo, R. Voituriez, Z. Lenkei, J. Mol. Cell Biol. 2013, 5, 250.
[36] C. Leterrier, J. Laine, M. Darmon, H. Boudin, J. Rossier, Z. Lenkei, J Neurosci 2006, 26, 3141. [37] M. Tokunaga, N. Imamoto, K. Sakata-Sogawa, Nat. Methods 2008, 5, 159.
[38] B. N. G. Giepmans, T. J. Deerinck, B. L. Smarr, Y. Z. Jones, M. H. Ellisman, Nat. Methods 2005, 2, 743. [39] U. Schnell, F. Dijk, K. A. Sjollema, B. N. G. Giepmans, Nat. Methods 2012, 9, 152.
[40] R. P. J. Nieuwenhuizen, K. A. Lidke, M. Bates, D. L. Puig, D. Grünwald, S. Stallinga, B. Rieger, Nat. Methods 2013, 10, 557.
[41] S. tom Dieck, L. Sanmartí-Vila, K. Langnaese, K. Richter, S. Kindler, A. Soyke, H. Wex, K. H. Smalla, U. Kämpf, J. T. Fränzer, M. Stumm, C. C. Garner, E. D. Gundelfinger, J. Cell Biol. 1998, 142, 499.
[42] E. D. Gundelfinger, C. Reissner, C. C. Garner, Front. Synaptic Neurosci. 2016, 7, 19.
[43] A. Burette, F. Collman, K. D. Micheva, S. J. Smith, R. J. Weinberg, Front. Neuroanat. 2015, 9, 100.
[44] S. H. Lee, C. Jin, E. Cai, P. Ge, Y. Ishitsuka, K. W. Teng, A. A. de Thomaz, D. Nall, M. Baday, O. Jeyifous, D. Demonte, C. M. Dundas, S. Park, J. Y. Delgado, W. N. Green, P. R. Selvin, Elife 2017, 6.
[45] S. Bolte, F. P. Cordelières, J. Microsc. 2006, 224, 213.
[46] B.-Q. Lai, X.-C. Qiu, K. Zhang, R.-Y. Zhang, H. Jin, G. Li, H.-Y. Shen, J.-L. Wu, E.-A. Ling, Y.-S. Zeng,
18
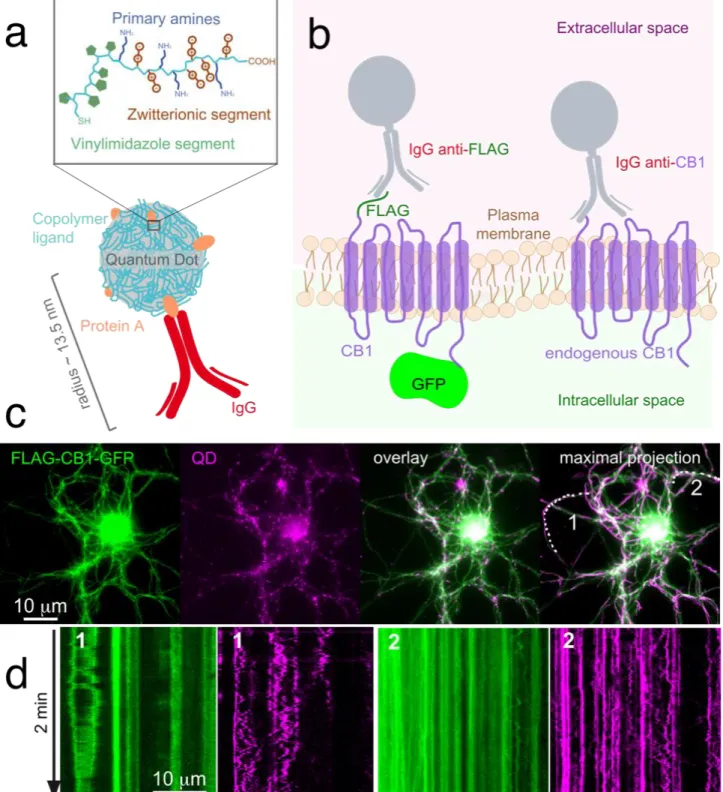
Figure 1. QD-pA nanoconstructs are versatile nanoprobes for the study of the dynamics of cell membrane proteins. (a) Schematic representation of the biofunctional, fluorescent QD
nanoconstructs employed to ‘paint’ the cell membrane. The nanoconstructs are composed of an inorganic core (quantum dot) surface-covered by a vinylimidazole-sulfobetaine copolymer ligand. QD-pA nanoconstructs are obtained by reaction of ligand primary amines and protein A, which in turn enables the oriented immobilization of target-recognition IgG antibodies. (b) Illustration of the
19
two cases considered in this work: QDs-anti-FLAG used to target the extracellular FLAG tag corresponding to the over-expressed CB1 transmembrane receptor with intracellular GFP fluorescent terminus (left) and QDs-anti-CB1 employed to target the endogenous CB1 receptor (right), both in live cell experiments. (c) Wide-field epifluorescence images of the FLAG-CB1-GFP and QD channels, their overlay and the maximal projection over a 2-min acquisition time (0.5 fps). Note that biofunctional QDs allow visualization of the majority of neurites with only 2 minutes of acquisition. (d) Two neurites from panel c (labeled 1, 2) were selected for the kymographs on the GFP (green) and QD (magenta) channels. The Brownian diffusion of QDs is clearly visible in the kymographs, while GFP kymographs are blurrier and appear more static.
20
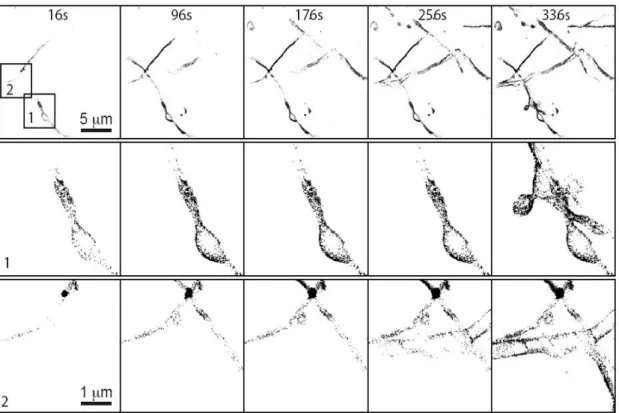
Figure 2. Dissecting the nanoPaint principle: superposition of QD localizations over time
generates gradual reconstructions of the cell membrane topology. In this example, 21,000 frames (336 s) were sufficient to satisfactorily reconstruct the cell membrane in areas 1 and 2 (rows labeled 1 and 2, respectively). QD-pA-anti-FLAG nanoconjugates labeling FLAG-CB1-GFP expressing neurons were employed.
21
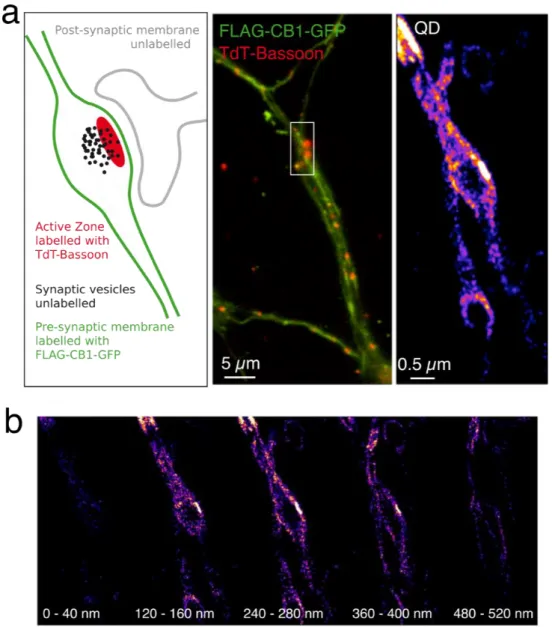
Figure 3. From 2D to 3D cell membrane reconstruction with nanoPaint: by using a cylindrical
lens, temporal integration (5 min) of QD localizations around a presynaptic terminal enabled cell membrane reconstruction, both in 2D (a, right) and in 3D (b). (a) A schematic representation of the synaptic bouton and the synaptic cleft (the gap between pre- and post-synaptic areas) is presented (a, left) together with the post- and pre-synaptic regions. The localization of the synaptic region is confirmed by the presence of tdTomato-Bassoon (a, middle), a presynaptic marker of the active zone. (b) Membrane reconstruction at different z planes with a depth of 40 nm. For a whole 3D image, see VideoS2. Transfected neurons expressing FLAG-CB1-GFP and tdTomato-Bassoon and QD-pA-anti-FLAG nanoconjugates were employed.
22
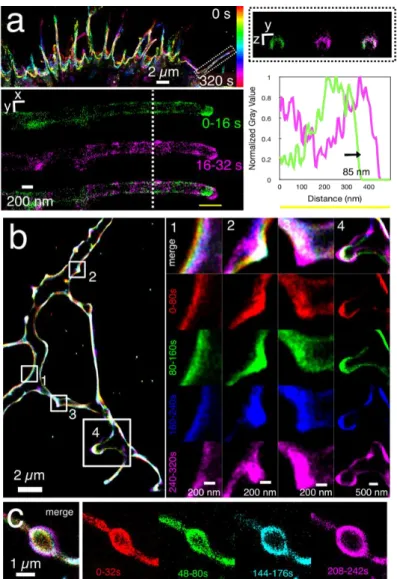
Figure 4. Nanoscopic structural plasticity of the cell membrane as revealed by nanoPaint. (a)
Dynamic reconstruction of the plasma membrane of HEK-293 cells expressing the FLAG-CB1-GFP receptor "nanoPainted" with QDs-pA-anti-FLAG nanoconjugates. On the top left, the color code encodes the temporal reconstruction over 320 s. The filopodium on the dashed box is reconstructed in the lower left panel at a higher magnification during the first 16s (green) and the following 16–32 s (magenta). The dashed white line represents the plan of orthogonal y-z view showed in the upper right panel. The profile intensity (down right) indicates a shift of the filopodium tip of 85 nm. (b) nanoPaint with QDs-pA-anti-CB1 on DIV50 hippocampal neurons that were reconstructed and color-coded into 5 time-lapses of 80 s each. The merged image shows different regions in which spontaneous structural changes have occurred. Four regions were selected for a higher magnification. (c) Cell membrane deformation due to phototoxicity in
23
hippocampal neurons exposed to high laser power excitation. Four non-consecutive time lapses of 32 s each are presented (right) together with a merged image (left).
24
nanoPaint: a Tool for Rapid and Dynamic Imaging of Membrane Structural Plasticity at the Nano-Scale
M. Tasso*, T. Pons, N. Lequeux, J. Nguyen, Z. Lenkei, D. Zala*
A new method to rapidly "paint" the membrane topology of cells is reported that relies on biofunctional quantum dot (QD) nanoconstructs recognizing highly-diffusing membrane proteins (the neuronal receptor CB1 in this example) and on single molecule localization microscopy to enable the rapid visualization of cell membrane structural modifications at the nano-scale and in 3D.