HAL Id: hal-00583109
https://hal.archives-ouvertes.fr/hal-00583109
Submitted on 4 Apr 2011
HAL is a multi-disciplinary open access
archive for the deposit and dissemination of
sci-entific research documents, whether they are
pub-lished or not. The documents may come from
teaching and research institutions in France or
abroad, or from public or private research centers.
L’archive ouverte pluridisciplinaire HAL, est
destinée au dépôt et à la diffusion de documents
scientifiques de niveau recherche, publiés ou non,
émanant des établissements d’enseignement et de
recherche français ou étrangers, des laboratoires
publics ou privés.
Non-negative Matrix Factorization: a blind sources
separation method applied to optical fluorescence
spectroscopy and multiplexing
Anne-Sophie Montcuquet, Lionel Herve, Jean-Marc Dinten, Jerome Mars
To cite this version:
Anne-Sophie Montcuquet, Lionel Herve, Jean-Marc Dinten, Jerome Mars. Non-negative Matrix
Fac-torization: a blind sources separation method applied to optical fluorescence spectroscopy and
mul-tiplexing. Proceeding to Biomedical Optics BIOS congress, Jan 2010, San Francisco, United States.
Proceeding SPIE-OSA Biomedical Applications of Light Scattering IV, Vol. 7573, 757314.
�hal-00583109�
Non-negative Matrix Factorization: a blind sources
separation method applied to optical fluorescence
spectroscopy and multiplexing
Anne-Sophie Montcuquet
a,b, Lionel Herv´
e
a, Jean-Marc Dinten
aand J´
erˆ
ome I. Mars
b aCEA-L´
ETI, Minatec, 17 rue des Martyrs, Grenoble, France;
b
GIPSA-Lab, DIS, Rue de la houille blanche BP46, Saint Martin d’H`
eres, France
ABSTRACT
Fluorescence optical imaging use one or several (in multiplexing) injected fluorescent markers which specifically bind to targeted compounds. Near infrared light illuminates the region of interest and the emitted fluorescence is analyzed to localize fluorescence sources. A spectroscopic approach and a separation source method (Non-negative matrix factorization) are explored to separate different fluorescence sources and remove the unwanted biological tissues autofluorescence. We present unmixing results on overlapping spectra of interest, and show that autofluorescence removal improves Fluorescent Diffuse Optical Tomography.
Keywords: Fluorescence spectroscopy, autofluorescence, blind source separation, Fluorescent Diffuse Optical Tomography
1. INTRODUCTION
Fluorescent imaging in diffusive media is an emerging imaging modality for medical applications: injected fluo-rescent markers (in multiplexing, several specific markers are used) bind specifically to targeted compounds, like carcinoma. The region of interest is illuminated with near infrared light and the emitted back fluorescence is analyzed to localize the fluorescence sources.
For medical diagnostic application, thick media have to be investigated: as the fluorescence signal gets exponentially weak with the light travel distance, any disturbing signal – such as biological tissues intrinsic fluorescence (called autofluorescence) – may be a limiting factor. To remove these unwanted contributions, or to separate different fluorescent markers, a spectroscopic approach and a blind source separation method (Non-Negative Matrix Factorization (NMF)) are used.
In this article, we present results on experimental spectrally resolved fluorescence acquisitions. First, we show how an unmixing preprocessing eradicates the autofluorescence signal and allows to get more accurate 3-D reconstructions of specific markers by Fluorescence Diffuse Optical Tomography (FDOT). Finally, we underline the efficiency of NMF on overlapping fluorescence spectra by presenting unmixing results of two different specific markers.
2. THEORY
The NMF method separates a non-negative signal into a set of non-negative components, which makes it suitable for spectroscopic measurements. Its mathematical translation is:
Given a non-negative matrix X ∈ RNx×Nλ, find non-negative matrices A ∈ RNx×P and S ∈ RP ×Nλ such
that:
X ' AS (1)
All matrices factors are non-negative and P is the number of specific fluorescence sources considered. We usu-ally choose P equal to the number of different specific markers used, plus one when the medium is autofluorescent (for in vivo measurements, or data obtained on optical phantoms that simulate autofluorescence).
The NMF decomposition applied on a spectrally resolved acquisition X (first introduced in this domain by Gobinet1) returns two non-negative matrices A and S: the lines of S contain the P fluorescence spectra, while the columns of A contain the weights of these spectra for each spatial position.
Here, the NMF decomposition is obtained by minimizing F , the square of the Euclidean distance between X and AS2:
F = kX − ASk2 (2)
At first, both matrices A and S are initialized with non-negative coefficients (S is initialized with non-negative tabulated fluorescent sources spectra). Then Lee and Seung3 multiplicative rules minimize F by alternatively
updating matrices A and S, with respect to (A, S) ≥ 0: aip= aip (XSt) ip (ASSt) ip and spj = spj (AtX) pj (AtAS) pj , p ∈ (1, P ), i ∈ (1, NX), j ∈ (1, Nλ) (3)
3. INSTRUMENTATION AND METHODS
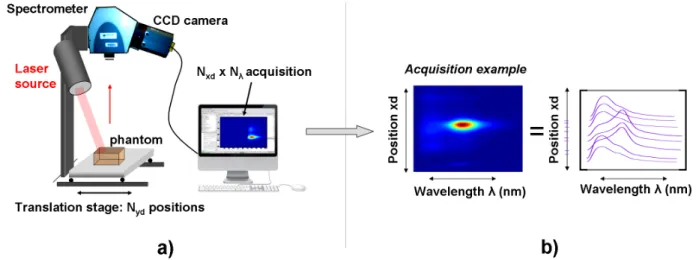
To acquire spectrally resolved measurements of a phantom (or small animal), the latter is illuminated along a line with a planar laser, and the emitted back fluorescence signal is measured. The fluorescence signal is collected along a line of Nxd detectors by a spectrometer coupled with a charge-coupled device camera (Andor
Technologies) as depicted in figure 1-a: a Nxd× Nλacquisition is measured (See figure 1-b). A translation stage,
covering Nyd steps, is then used to get a scan of the whole object: Nyd acquisitions are obtained, each of size
Nxd× Nλ.
Figure 1. a) Scheme of the experimental set-up b) Example of an Nxd× Nλacquisition
4. NMF PREPROCESSING TO IMPROVE FDOT
4.1 Experiment
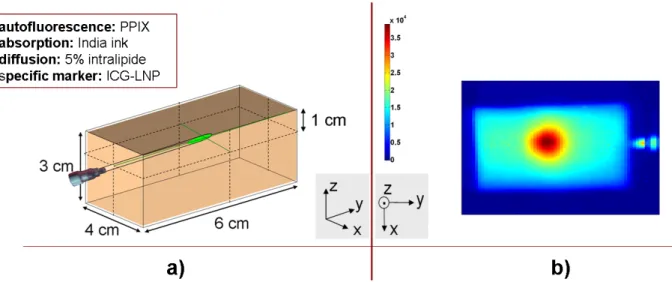
A first feasibility experiment is performed on an optical phantom (µa' 0.04 cm−1, µ0s' 10 cm−1) : a capillary
tube filled with 5 µl Indocyanine Green loaded into Lipid Nanoparticules (ICG-LNP)4at 1 µMol/l is inserted 1
cm deep (See Figure 2-a) to simulate a marked tumor.
Protoporphyrin IX (PPIX) has homogeneously been added to the optical phantom to simulate the autofluo-rescence of tissues: PPIX emission peak is different from the ICG-LNP one but their spectra are overlapping.
The phantom is illuminated along a line with a planar laser at 690 nm and the translation stage is used to get a scan of the whole object: the intensity data obtained are presented figure 2-b.
Figure 2. a) Scheme of the optical phantom with a 1cm deep capillary tube filled with ICG-LNP b) Result of the scan : autofluorescence (PPIX) plus specific fluorescence (ICG-LNP)
4.2 Results
We process the NMF algorithm on our data (Figure 2-b), reorganized as one 2-D array of size (Nyd× Nxd, Nλ).
Two distinct fluorescence spectra are obtained (Figure 3-a): they are correctly separated despite their overlap. On the same figure, the autofluorescence (b)) and ICG-LNP (c)) separated intensities contributions are presented.
Figure 3. a) Fluorescence spectra obtained (matrix S) : initialization (dotted lines), and results of NMF (continuous lines) b) Autofluorescence intensity contribution c) Specific fluorescence (ICG-LNP) intensity contribution
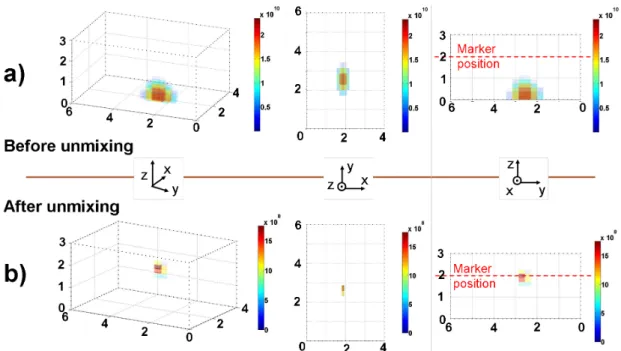
Finally, we get a 3-D reconstruction of the specific marker in the optical phantom. The phantom is discretized into a 21 × 31 × 16 dots mesh and the forward model is solved using the finite volume method. Reconstruction is obtained by simply selecting voxels of the mesh whose fluorescence signal best matches the measured data.
Reconstructions taking or not the autofluorescence signal into account (that means with or without the NMF preprocessing) have been performed. Results are presented figure 4: autofluorescence removal allows to get an accurate reconstruction of the fluorescence marker, 1cm deep (4-b). On the contrary, if the whole fluorescence signal is considered (with the autofluorescence) the reconstruction is not correct (4-a) : the marker is placed 3 cm deep.
Figure 4. 3D reconstruction results: a) results obtained on the original data, before the NMF algorithm (see figure 2-b); b) results obtained on the unmixed data, after the NMF algorithm (see figure 3-c)
5. MULTIPLEXING
5.1 Experiment
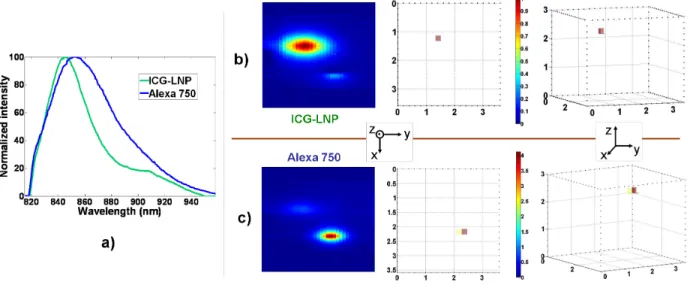
A second experiment is run here, to unmix two specific fluorescent markers, whose emission spectra are overlap-ping, and more in that case than autofluorescence and ICG-LNP spectra in the first experiment (see figures 3-a and 6-a). Capillary tubes filled with two fluorescent markers (ICG-LNP and Alexa750) are inserted inside an optical phantom (See figure 5-a). The phantom is illuminated at 785 nm along a line with a planar laser. The resulting intensity data is presented figure5-b.
Figure 5. a) Scheme of the optical phantom with two capillary tubes filled with specific markers ICG-LNP or Alexa 750 b) Result of the scan : two fluorescent contributions, one for each specific marker used
5.2 Results
One more time the NMF algorithm is run on the reorganized scan data (Figure 5-b). Spectra attributed to ICG-LNP and Alexa 750 are obtained (Figure 6-a) – correctly unmixed despite their overlap – and their separated intensities contributions are presented figure 6-b and 6-c.5 Associated 3-D reconstructions are presented on the
same figure: the algorithm used was the same than previously (see 4.2).
Figure 6. a) Fluorescence spectra obtained (matrix S) b)-c) Respective ING-LNP and Alexa 750 intensities contributions and their associated 3-D reconstructions
6. CONCLUSION
We found that spectrally resolved acquisitions combined to NMF processing successfully separate different fluo-rescent markers or filter different fluorescence contributions of interest from measurements impaired by autoflu-orescence. A first feasibility experiment has been performed on an autofluorescent optical phantom, in which ICG-LNP markers have been placed to simulate a marked tumor. The NMF preprocessing allowed to remove autofluorescence and get a correct 3-D reconstruction of the specific marker fluorescent distribution. On a second experiment, also performed on an optical phantom, and using two specific markers – ICG-LNP and Alexa 750 – we showed that the NMF decomposition allowed to unmix close and overlapping specific markers spectra.
Finally, the NMF method appears to be a useful method to select specific fluorescent contributions and eradicate the autofluorescence signal that disturbs acquisitions and skews FDOT reconstructions of the specific fluorescent markers distributions.
REFERENCES
1. Gobinet, C., Perrin, E., and Huez, R., “Application of nonnegative matrix factorization to fluorescence spectroscopy,” Eusipco, Technische Universit¨at (2004).
2. Paatero, P., “Least squares formulation of robust non-negative factor analysis,” Chemometrics and Intelligent Laboratory Systems 37(1), 23–35 (1997).
3. Lee, D. and Seung, H., “Algorithms for non-negative matrix factorization,” Advances in neural information processing systems 13, 556–562 (2001).
4. Navarro, F. P., Berger, M., Goutayer, M., Guillermet, S., Josserand, V., Rizo, P., Vinet, F., and Texier, I., “A novel indocyanine green nanoparticle probe for non invasive fluorescence imaging in vivo,” Reporters, Markers, Dyes, Nanoparticles, and Molecular Probes for Biomedical Applications 7190(1), 71900L (2009).
5. Montcuquet, A.-S., Herv´e, L., Guyon, L., Dinten, J.-M., and Mars, J., “Non-negative matrix factorization: A blind sources separation method to unmix fluorescence spectra,” Proceedings of First IEEE Workshop on Hyperspectral Image and Signal (2009).