HAL Id: halshs-01018594
https://halshs.archives-ouvertes.fr/halshs-01018594
Preprint submitted on 4 Jul 2014HAL is a multi-disciplinary open access archive for the deposit and dissemination of sci-entific research documents, whether they are pub-lished or not. The documents may come from teaching and research institutions in France or abroad, or from public or private research centers.
L’archive ouverte pluridisciplinaire HAL, est destinée au dépôt et à la diffusion de documents scientifiques de niveau recherche, publiés ou non, émanant des établissements d’enseignement et de recherche français ou étrangers, des laboratoires publics ou privés.
Income versus Sanitation; Mortality Decline in Paris,
1880-1914
Lionel Kesztenbaum, Jean-Laurent Rosenthal
To cite this version:
Lionel Kesztenbaum, Jean-Laurent Rosenthal. Income versus Sanitation; Mortality Decline in Paris, 1880-1914. 2014. �halshs-01018594�
WORKING PAPER N° 2014
– 26
Income versus Sanitation;
Mortality Decline in Paris, 1880-1914
Lionel Kesztenbaum
Jean-Laurent Rosenthal
JEL Codes: I14, I15, N33, N93
Keywords: Differential mortality, Wealth, Urbanization, Paris, Sanitation
P
ARIS-
JOURDANS
CIENCESE
CONOMIQUES48, BD JOURDAN – E.N.S. – 75014 PARIS
TÉL. : 33(0) 1 43 13 63 00 – FAX : 33 (0) 1 43 13 63 10
www.pse.ens.fr
Income versus Sanitation;
Mortality Decline in Paris, 1880-1914.
Lionel Kesztenbaum (Ined and PSE) Jean-Laurent Rosenthal (Caltech)
Abstract
After 1850, mortality began its long-term fall in most industrialized countries, a process that has been linked to rising incomes and improved water infrastructure. The problem, however, is that these contribution are jointly determined and feedback into each other. Here we estimate their impact using a longitudinal data set on mortality and income for each of Paris’ 80 neighborhoods. Income and sanitation both contributed to the decrease in mortality, a standard deviation increase in either variable produces a two years gain in life expectancy. These results give insights on the determinants of the health transition but also on the long-term evolution of health inequality.
Keywords: differential mortality, wealth, urbanization, Paris, sanitation. JEL codes: I14, I15, N33, N93
The authors would like to thank Leah Brooks, Jonathan Chapman, Tracy Dennison, Edward Glaeser, Timothy Guinnane, Philip Hoffman, Samantha Myers, Jim Oeppen, Paula Scott, and William Summerhill and the participants at seminars at All-UC Huntington conference, Ined, Michigan, PSE, Stanford, UCLA, Université Paris-Dauphine, and Yale for helpful comments.
Introduction
The growth in life expectancy over the past two centuries is one of the most striking accomplishments of economic development. Humans born today in high income economies can expect to live twice as long as their forebears of two centuries ago. This gain results from the growth of both private resources (such as the direct effect of income on life expectancy through better nutrition) and public investment (such as the building of water and sewer networks). Evaluating the impact of private and public contributions is necessary if one is to consider how best to reduce mortality in developing economies. The problem, however, is that these contributions are jointly determined and feedback into each other. A society or locality with low income is unlikely to be able to afford the expensive investments required to procure clean water and to dispose of soiled water. Conversely, a population with access to good sanitation will lose fewer work-days to illness and thus enjoy higher private incomes. Moreover, inequality affects the distribution of both private income gains and infrastructure. Given that local infrastructure is an excludable local service (not a pure public good), it is clear that income inequality may play an important role in shaping conflicts over the extent of redistributive policies that provide or deny health-improving infrastructure access to the poor.1 For instance, faced with significant connection fees, the poor will not take advantage of the most valuable benefits of this infrastructure (Devoto et al. 2012). Finally income and sanitation affect both current health status and human capital. For instance, nutrition in childhood matters over the whole life course, while sanitation networks are built over time and older building are usually grandfathered into a regime of voluntary connection.
The slow diffusion of health-improving infrastructure such as clean water and sanitation remains an important problem in large parts of the world today (Banerjee and Duflo 2007, Baisa et al. 2010) just as it was a hundred years ago in Europe and North America. In cities of the developing world in particular, the diffusion of these technologies is highly uneven though they improve health and reduce water-related expenses (Galiani, Gertler, and Schargrodsky 2009). In fact, an important part of the debate today (as in the nineteenth century) involves who should pay for expanding infrastructure: landlords, users of water, or the rich more generally (Galiani, Gertler, and Schargrodsky 2005). The same was true for Paris between 1880 and 1914. The city proved to be a unique and valuable observatory to disentangle all these effects. Its administration bequeathed us good data about mortality, income, and
1 Some authors even suggest economic inequalities by themselves contribute to increased mortality (Wilkinson 1996) but this view has been challenged (Deaton 2003).
sanitation for each of its 80 neighborhoods and its particular institutional history allows us to resolve endogeneity issues.
Paris is unique among large cities in that its administration steadfastly collected critical and detailed information for 80 fixed neighborhoods but its mortality and sanitation experience is actually commonplace. The decline of mortality between 1870 and 1914 was widespread in large cities across the North Atlantic economies. The sharp reduction of mortality occurred in the U. S.(Cutler and Miller 2005, Troesken 1999), in Germany(Brown 1989), and in the U. K. (Szreter 1988) among other countries. This decline initially allowed urban mortality to reach parity with that of rural areas, which had long enjoyed a health advantage. Urban mortality then continued to fall, finally giving cities the life expectancy advantage over rural areas they currently enjoy. Time and again scholars have pointed to income growth (Birchenall 2007, McKeown 1976) and to the diffusion of water infrastructure–piped, filtered, and chlorinated water on one side and sewers on the other (Cutler and Miller 2005, Ferrie and Troesken 2008)–to explain why mortality fell so sharply and quickly throughout the North Atlantic region. The central issue is thus to measure the impact of these different factors on mortality decline. Scholars have tried to evaluate the role of income or wealth by charting the differential adoption of new water infrastructure across cities (Brown 1988). To evaluate the value of clean water they have looked at specific improvements that diffused quickly (e.g. chlorination) after the infrastructure had been put in place (Cutler and Miller 2005). In each case scholars looked at the impact of these measures city-wide–in effect treating it as a public good. These are informative approaches but they also have some limitations, the first being the elision of the huge variations that occurred
within cities. In each of the major cities (New York, London, or Paris) mortality was both
high and uneven (the inter-quartile range among districts ranges between 25 and 30% of the mean).2
Given these historical and the contemporary experiences, we use Paris’ unmatched detailed data to explain the variation in death rates over time. They also allow us to show that both changes in wealth or income and large-scale public investment contributed to the reduction of mortality. Since the impact of moving from the bottom quartile of the wealth distribution to the top one is about the same as that of the adoption of water or sewer infrastructure, it is not surprising that scholars that look at settings where one source of variance (income or infrastructure) is small attribute all improvement to the other. Moreover,
2 London, New York and Paris all reported aggregate death rates by neighborhood (General Register Office 1881-1901, US Census Office 1894). Only in Paris are neighborhood boundaries fixed in space.
once we consider the endogenous diffusion of infrastructure we find that income, clean water, and sewers were interrelated. Indeed, most investments that prolong life are goods that involve some user charges that, initially at least, only the wealthiest part of the population is willing to pay. Health innovation thus first brings benefits to the rich.
There are, of course, different kinds of health innovations. Some can be simply bought while others require knowledge rather than riches. In their pure form innovations requiring income and those requiring knowledge are quite distinct. Higher income allows individuals to purchase goods and services that prolong life (e.g. better nutrition, clothing, and housing). Save for possible epidemiological effects, the better food or housing of one family has little effect on the life expectancy of another. At the other extreme, we can place pure knowledge effects say for example the benefits of home cleanliness or boiling milk. Once the value of such techniques is known, they can be adopted by everyone because their costs are low. Of course other innovations lie in between: Some are expensive but have economies of scale and, as a result, their benefits are greatest if they are adopted by everyone. This is the case with sanitation which relies on expensive networks of pipes to distribute clean water and collect waste water.3 Although expensive, large scale investments are likely to have been important around 1900, since most of the mortality decline have come from reducing the impact of infectious diseases (Omran 1971). However, it is important not to reduce clean water or sanitation to a public good because, although they have externalities, they are excludable services whose provision occurs under a variety of schemes. Sanitation, for instance, can of course be provided uniformly at public expense, it can also be mandated as part of rebuilding programs, or, as is most often the case, it can be left to a fee-for-service public or private provider. In few of these cases can water infrastructure be reduced to a public good.
Scholars have long known that the correlation between income (or wealth) and health is positive, both between (Preston 1975, Pritchett and Summers 1996) and within countries (Hummers, Rogers, and Eberstein 1998, Ferrie 2003). The relationship has been observed and commented upon for two centuries (Villermé 1828). Many recent studies have tried to break down the impact of higher income into the kinds of consumption that it enables: better nutrition, housing, hygiene, or access to medical resources (Harris 2004, Fogel 1986, 1992, Soares 2007). But at the same time, there is little evidence that affluence per se improves health (Cutler, Deaton, and Lleras-Muney 2006). In fact the relationship between economic growth and life expectancy is not one way. There are advances and retreats in the evolution of
both health and income that are unrelated to each other, whether from the historical record (Easterlin 1999) or in contemporary analyses (Deaton and Paxson 2004). It seems clear that
“there is no presumption that economic growth will improve health without deliberate public action” (Cutler, Deaton, and Lleras-Muney 2006, Drèze and Sen 2002).
On the other side, many scholars emphasize infrastructure and local conditions. These can simply be urban disamenities (Szreter and Mooney 1998, Woods 2003, Cain and Hong 2009). Scholars have also looked at large scale improvements such as clean water (Cutler and Miller 2005, Ferrie and Troesken 2008, Szreter 1988). As a rule these studies argue that the link between income and mortality improvements is weak and instead favor changes in local conditions due to infrastructure investments. Such studies, however, focus on settings where the variance in income is relatively small and the variance in the environment is relatively large (for instance looking across U.K. or U.S. cities). Our contribution focuses on a very specific environment (one of the largest cities in Europe) where the range of economic circumstances was particularly broad.
This paper has three goals. The first is to establish that the debate over income versus infrastructure is to a large extent a false one: both are very important mechanisms for reducing urban mortality. Our second goal, is to document the long-term evolution of life expectancy in Paris and its extraordinarily marked spatial and temporal variation–something Paris shares with every other large city. It is no great surprise that the poorest neighborhoods were also those where life was shortest, but both the extent of the mortality gradient and its evolution over time are striking. Third, we demonstrate that the advent of sanitation (direct connection
of a building’s wastewater pipes to the sewers) did reduce mortality. However, the
fee-for-service nature of the diffusion process led to early adoption by rich neighborhoods and thus a temporary increase in differential mortality. To take both into account at once, we use an instrument for connection to sewers to deal with their endogenous diffusion, and show that income growth and the diffusion of sewers were about equally beneficial. Throughout the paper we focus on life expectancy and mortality risk from age one or older because Parisian records do not allow the reconstruction of infant mortality–but in the absence of this omission, our results would likely be stronger as it is commonly accepted that much of the benefits of income gains or public infrastructure come to the very young. Our findings of a very steep life expectancy-income profile and a very large benefit of sewer adoption are thus likely to be downward-biased relative to what the population actually experienced.
I. Paris as a laboratory
Paris is a very good laboratory to study differential mortality: first, because administrative boundaries within the city have not changed since 1860; and second, because the municipal statistical office was staffed by individuals obsessed with collecting and publishing detailed demographic and infrastructure data. Their efforts allow us to track the evolution of mortality between 1880 and 1913 for each of the 80 neighborhoods (quartier) of the city.4 On the demographic side, the statistical office published death totals by sex, broken down into six age categories for each year and neighborhoods, starting in 1880 as well as a series of detailed abstracts for the city drawn from the national population censuses from 1881 to 1911. Taken together these two datasets allow us to compute mortality rate and life expectancy at the neighborhoods level (see appendix B. for details). Unfortunately we cannot compute infant mortality because middle- and lower-class Parisians very frequently employed wet nurses who lived some distance from the capital until late in the nineteenth century (Rollet-Echalier 1982, Preston and van de Walle 1974).
On the income side we do not have access to a panel data for income at the neighborhood level but we do have excellent data on the distribution of rents across the city. Indeed, the city carried out and we computerized four real estate censuses (1876, 1890, 1900, and 1910). For each neighborhood, the censuses distribute housing units in two dozen categories of rent levels, including two for those dwellings below the threshold of the taxe mobilière (a direct
tax assessed on the basis of occupation and of the rental value of the household’s dwelling).
The top category in 1890 comprised 521 dwellings each assessed at more than 16,000 francs in rent.5 Although these data provide ample evidence of the correlation between rent and life expectancy, they are too infrequent for our purposes. So to supplement the censuses we collected neighborhood level fiscal data for every five years from 1876 to 1911 from the summary registers of the taxe mobilière in the archive of the finance ministry. These data include the number of households who paid a rent above the fiscal threshold and the total rent they paid.
Since the average rent reported by the tax authorities is a varying fractile of the underlying rent distribution, we need to prove that it can be a good statistic for neighborhood income. This demonstration involves two steps, the average fiscal rent must be a good
4 The city was divided into twenty administrative districts (arrondissements) that were each split into four
quartiers or neighborhoods.
5 With per capita income below 600 francs in that year (Lévy-Leboyer and Bourguignon 1990), such rents would correspond to housing units with rentals values of 1 million dollars or more in the U.S. today and 650,000 Euros or more in France.
statistic for average rent and then rents must be good proxies for income. The first step is easy. We compute the average rent paid by households above the threshold, this average rent isvery closely correlated with the average rent for the total population reported in the four real estate censuses (the correlation between the two measures in the same year is never less than 0.97). Though truncated, the fiscal rent data are an effective statistic for average rents at the neighborhood level.
They are also a good proxy for income, both for theoretical and empirical reasons. On the theory side, it seems logical that housing is a normal good and hence housing expenditures (rents) will be correlated with income. More precisely, let us start by assuming that households devote a fixed fraction of their consumption to housing and that the individual household heterogeneity averages out within neighborhoods so that the budget-share of housing can be taken as constant across neighborhoods. To be sure there are some worries with this framework. The most notable is that the budget-share of housing might well be increasing with total consumption (housing being, in effect, a luxury good). In this case using rents as a proxy for consumption would overstate the rate of growth of consumption. The second is that household structure is likely to be directly related to budget share of housing (with larger households devoting relatively more of the budget to housing for a given total consumption). Moreover if household structure is related to aggregate consumption there are likely to be systematic differences in the budget share of housing across neighborhoods. In the absence of finer-grain data, however, we cannot address these issues in the statistical analysis. Yet measurement error due to household heterogeneity is likely to create attenuation bias. Increasing budget shares for housing will also tend to understate the income effect (because a doubling of rent expenditures is associated with a less than doubling of income). Thus both biases work against rather than in favor of the argument that income improves life expectancy. It seems reasonable to take rents to proxy consumption (leaving aside the issue of whether this consumption was funded out of current or future income or out of savings).
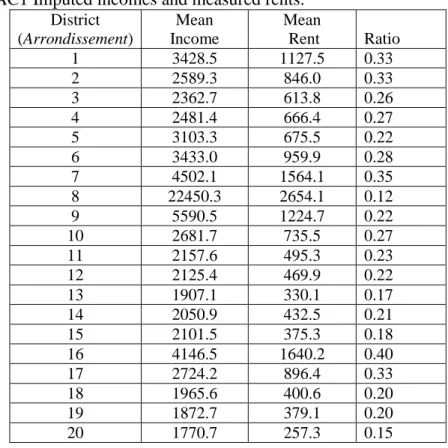
On the empirical side, we can test this argument in 1890s Paris. Indeed although there is no regular source for incomes by neighborhood, we produce an estimate of income for the early 1890s at the district (arrondissement) level. To do so we combine information on wealth from estate documents (for capital income), information on labor income from the industrial survey of 1896 and information on district level occupational distribution to produce a cross section of Parisian incomes (see Appendix C). As the appendix details, the procedure involves some assumptions but whatever choices we make always produce a set of average incomes that are very are strongly correlated with average rents. Indeed the
correlation is at least 0.8, despite the fact that we had to omit a lot of the within occupation wage variations. Overall, it seems clear that rents are a good statistic for income.
What do rents tell us about the variation in consumption? The real estate census of 1876
provides a striking image of the city’s inequality (Figure II). The wealthy (paying annual rents
over 1000 francs) comprised less than 10% of households. The poor (who paid less than 300 francs rents) made up 68% of households. These different groups lived in different places and rents reflect these contrasts: Rents in the Champs Élysées neighborhood averaged 3,200 francs, nearly twenty times the 179 francs of the rents in Charonne. This difference in rents in part reflects the massive differences in the quality of the housing units (the size of apartments, amenities like running water, toilets within the apartment rather than in the hallway or on the ground floor, in air quality) but it is also likely that there were pure location rents. Indeed the high rent districts were clustered around the financial center (the Bourse) and its political counterpart (the Élysée). It is also not surprising that life expectancy for the privileged few in the west was almost 8 years longer than in the poor neighborhoods in the east.
[Figure II about here]
We also have information on access to clean water and how dirty water was dealt with. Although, as elsewhere in Europe or the U.S., clean water did play a role in decreasing mortality, especially infant mortality (Preston and van de Walle 1978), we lack the data to analyze its impact within Paris. Indeed, by 1885 two-thirds of Parisian buildings were
connected to the city’s water supply (Cebron de Lisle 1991: 547) and by then the vast
majority of homes received pure (spring) water brought in by aqueduct (Deligny 1883: Annexe n°1, p. 49). After that date differential access to clean water was not an issue (Goubert 1986: 90-92, Bocquet, Chatzis, and Sander 2008). But the diffusion and increased use of clean water (for whatever purpose) raised a new problem: removing the soiled water.
At the same time, the effect of improvements in water infrastructure may also be long-lasting, the so-called Mills–Reincke phenomenon (Ferrie 2008). Indeed, as Preston and van de Walle (1978) show, the mortality decline in Paris featured strong cohort effects, but they cannot establish if these effects were connected with water infrastructures, better nutrition, or any other factors. Here we narrow the focus to variation within Paris and concentrate our analysis on the thirty years at the turn of the century. It is the period when we can observe precisely variations in mortality, income (rents), and the water infrastructure. To do so, we take advantage of annual reports on the fraction of buildings that had a direct connection to the sewer by neighborhood. But our time frame precludes any cohort analysis.
The halcyon days of the statistical office ended abruptly in 1913. Afterwards, and despite a massive increase in the city’s involvement in sanitation, it curtailed its detailed reports. After WWI some data were only given by district, the city ceased publishing its abstracts from the population censuses or any real estate information, and even the treasury striped its internal reports of their useful information. So we limit our analysis to the period before 1914, when the most important improvements occurred.
Studying mortality within Paris poses serious complications. The most obvious of these is that, like every large city, its population is not closed. In fact, at the end of the nineteenth century, six out of ten people living in Paris had not been born there or in the suburbs (census results from 1886 to 1901) and this proportion varies little between districts.6 Migrants to Paris are also not a random sample of the world or of France’s population. In fact migrants
choose to move to Paris, and the city’s residents chose which neighborhood to live in. Indeed,
changes in the mortality of Parisians could be simply attributed to changes in rates of
migration or in migrants’ characteristics. Yet in prior work we established that migrants from
the countryside to cities were positively selected. Shortly after migrating, they had lower mortality than either those who stayed behind, or those whom they joined in cities. After a decade of urban residence, however, migrants’ mortality converged to that of individuals who were born and resided in cities (Kesztenbaum and Rosenthal 2011). Our analysis will take advantage of these results by examining differences in mortality rates by age because both youth and older groups will not be so sensitive to in-migration rates.
The second selection effect, residential sorting, also complicates the analysis. Indeed, consider two reasons for a neighborhood to have higher life-expectancy: income buys a longer life and some neighborhoods are healthier than others. These two effects need not be connected. Suppose that high income buys a longer life span and that high-income individuals want to live near each other because they value similar cultural amenities or economic networking. Moreover these high income neighborhoods have no attributes that affect life expectancy. Conversely, it could be that income is irrelevant in itself but that some neighborhoods have attributes that make them healthier places to live. Households with high income might well seek to live in such better neighborhoods and thus bid up the rental price of housing. In both cases we would observe a positive relationship between income and life span and a positive association between rich neighborhoods and life span. In the first case, the
6 The information is available only at the district level: all districts except for three have between 57 and 70% of their population not born in Paris or the Seine department. The three remaining have 50, 51 and 74% respectively at both extremes of the distribution.
neighborhoods are good because they are rich and in the second the neighborhoods are rich because they are good. In a cross section identifying causation is virtually impossible to resolve, and empirically Paris seems to fit both phenomena. On the one side, Paris’s rich neighborhoods are in the west, upwind from the poorer east and thus with less polluted air. On the other, the rich also hired many female servants, whose work (cleaning the home, washing clothes and linens, preparing food) reduced mortality. While we cannot precisely disentangle these two chains of causation, it seems that the pure geographical characteristics of the neighborhoods were far less important than either their infrastructure or the income of their denizens. Indeed Paris is compact with limited variation in its environment. Rich neighborhoods include both the 7th and 1st districts along the Seine and the higher altitude 16th and 8th districts. The poor 5th is actually upstream from the rich 7th. Save for air quality, the
rich did not congregate in ‘naturally’ healthy environments, though they did congregate a lot.7 We estimate the role of income and infrastructure from changes in mortality over time within neighborhood. To do so we deploy year fixed effects to net out any common demographic shocks (as well as the general trend of improvement in mortality) and neighborhood fixed effects to eliminate the permanent differences between different parts of Paris. Such an approach helps resolve migration issues because the structure of migration across Paris was very stable. Overall, the share of Parisian residents born elsewhere was 62, 59, and 61% respectively in 1886, 1896, and 1901. More importantly, the share of migrants by district was stable. Indeed, the ranking of districts in term of the share of non-Parisian residents does not vary at all over time.8 Second, fixed effects eliminate most natural variations between neighborhoods and allow us to focus on what changes over time, like the diffusions of sanitation. People moved within Paris but migration was both very local and
less frequent than one might have expected (Farcy and Faure 2003: 370). If males’
migrations aged 20 to 45 are any indication, 30% of within Paris moves occurred within the same neighborhood, 40% within the same district and 78% within the same area –center or periphery (Farcy and Faure 2003: 345-346). In fact, the ranking of neighborhoods changes little over time for either wealth or life expectancy (see Appendix B.). So most of the changes occur within neighborhoods (and over time), which is the part of the variation we intend to exploit. One might still worry such a direct statistical approach. Because rich neighborhoods
7 The case of London is slightly different because the rich West End is both upstream and upwind of the poor East End.
8 Of course, they may be variations over time in the characteristics of the migrants (e.g. their health advantage towards living conditions in Paris). But such a variation would have to be very large to modify the differences in life expectancy between neighborhoods we observe.
adopted direct connection, it might seem that the statistical impact of sewer adoption overstates its real impact because it includes an income effect. Landlords, however, might adopt direct connection where it reduces mortality most. There are good economic reasons to believe that these problems are not severe, in particular because the inclusion of income in a regression with sewer connection rates has little impact on the sewer coefficient. Nevertheless, as a robustness check we implement an IV approach which produces quite similar results in magnitude even though standard errors are much larger.
II. Mortality and wealth inequality in time and space
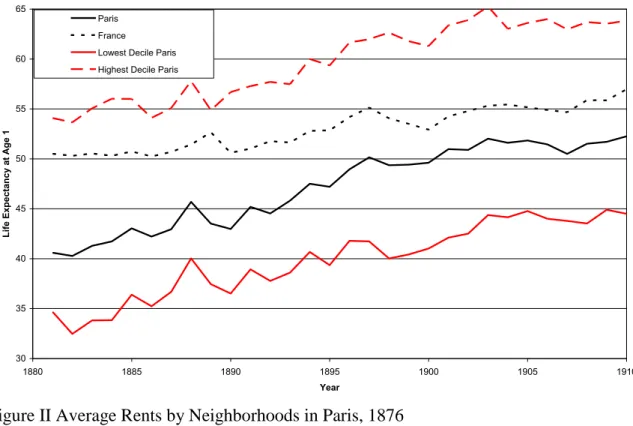
Figure I presents the average life expectancy for Paris (the black line) and for France (the dotted line).9 The figure also shows the life expectancy for the worst eight (the red line) and the best eight (the dotted red line) neighborhoods in the capital. The variation within Paris dwarfs the difference between in Paris and France. In fact individuals in the worst neighborhoods in Paris always had a life span about seven years below the city average and ten to fifteen years less than French people as a whole (a difference that is echoed in age at death differentials across the wealth distribution, see Piketty, Postel-Vinay, and Rosenthal 2006). In contrast, in the early 1880s in the best neighborhoods life expectancy was thirteen year higher than the rest of the city and a four year more than the rest of France with their excess mortality driven mainly by infectious diseases (Kuagbenou and Biraben 1998). Over the next three decades life expectancy in the best districts rose quickly and neared 65 years, extending their lead over the rest of France and Paris. The last decade before WWI saw somewhat more rapid gains at the bottom than at the top.
While even today differences in lifespan based on wealth or neighborhood remain, they are tiny relative to a century ago. Increased longevity, it seems, has been one of the more widely distributed benefits of long-term economic growth (Peltzman 2009, Becker, Philipson, and Soares 2005). As noted above, while its timing is specific, Paris’ mortality decline was part of the general epidemiological transition in North Atlantic countries during which the fall in infectious diseases erased the urban penalty (for the US, see Haines 2001, for UK, see Woods 2003, for the debate about contemporary rural-urban differences, see Bocquier, Madise, and Zulu 2011).
[Figure I about here]
The relatively poor performance of Paris’s worst neighborhoods is not for lack of
economic or urban growth. Indeed the French economy, despite a difficult decade in the 1880s due to low agricultural prices, grew steadily up to World War I and Paris was a major
beneficiary. The capital city’s share of France’s population and wealth was at an all time high
in 1913. In contrast to France as a whole (Bonneuil 1997), economic growth did not readily translate into a reduction of life expectancy inequality in Paris. The huge heterogeneity in life expectancy within Paris is not the product of neighborhoods having tiny populations with unusual life circumstances. Even in the 1880s each rich neighborhood had at least 20,000 inhabitants (and 40,000 on average) and the poor ones almost 30,000 (and 60,000 on average). An average Paris neighborhood would have had around 57,000 inhabitants in the 1880s and 68,000 in the 1900s. The massive range of life expectancy comes instead from deep differences in living conditions.
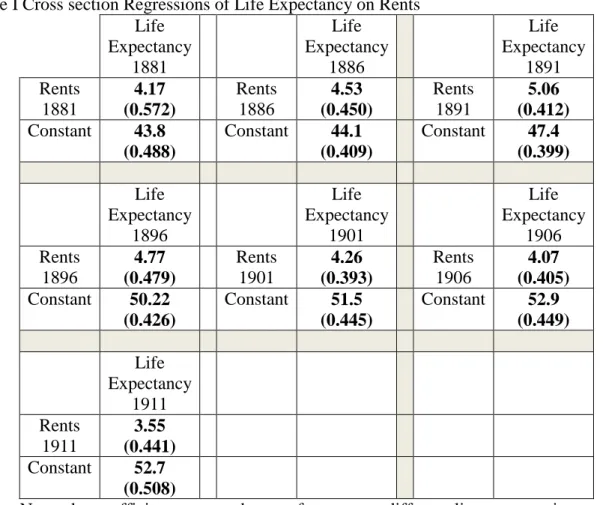
Let us start with the cross sectional correlation between income and mortality. We estimate a simple linear relationship between average fiscal rent and life expectancy at age 1 once every five years from 1881 to 1911.10 The first regression for 1881 shows a strong association between life expectancy and average fiscal rent. The relationship increases in each subsequent cross section to 1891, in part because of an increase in life expectancy in high rent neighborhoods. The second cause of the growing sensitivity of life expectancy to fiscal rent is that the fraction of poor households tended to decline everywhere even though their mortality patterns did not change much. The coefficient for fiscal rent is largest for 1891. Surprisingly, the role of income then declines and the coefficient we estimate for 1911, though still large is in fact lower than that of 1881 (and statistically different from that of 1891). The constant term (which estimates the mean life expectancy for each year) is increasing throughout, evidence of large city-wide gains in life expectancy (it grows from 44 to just under 53years). We estimated the same cross section regressions for mortality by age group and by sex in regressions we do not report. They show a similar pattern of increase in the impact of income on mortality to 1891 followed by a decline. Across age groups the magnitude of the coefficients increases, but because mortality risk is increasing in age, the proportional impact is similar across ages (these results should allay fears that changes over time were driven by changes in selective migration). Finally, we found no statistical
10 We also estimated other specifications–log-linear and log-log–of that relationship (not reported). The general pattern and the conclusion we draw from it remain identical.
differences between sexes: living in a wealthier neighborhood reduced mortality risk in quite similar ways for men and women.
[Table I about here]
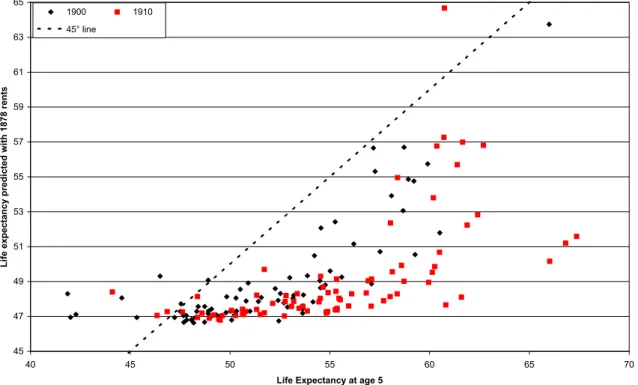
This general improvement suggests something other than simple income growth improved life expectancy. Given the steep life-expectancy to rent profile in 1881 we might imagine that even small gains in income would have had a large effect on life expectancy. To evaluate the hypothesis that all the changes that follow 1881 are simply income effects we ask, what would life expectancy have been in 1900 and 1910 if the rent to life expectancy link had been constant? We simply apply the coefficients of the 1881 regression to the rent distribution in later years (see Figure III). When we do so, we find systematic errors across the range of rents in 1900 and 1910. And the errors are nearly all one way, realized life expectancy was significantly higher than what was predicted by the effects of income growth alone and the gap is increasing in rent. One cannot blame inflation or other shocks since this was a period of limited price changes and of increasing prosperity. It seems longer life had become cheaper to buy.
[Figure III about here]
Clearly then, we can reject the idea that the relationship between consumption and life expectancy was fixed (the coefficients change over time in important and systematic ways). Moreover, for Paris in particular, both the evolution of aggregate rents and of business taxes are consistent with steady economic growth from 1880 to 1914. As others have shown, wealth accumulation was not very sensitive to economic downturns, either the one that followed the Franco-Prussian war or the agricultural crisis of the 1880s (Lévy-Leboyer and Bourguignon 1990). Moreover although one might see the divergence 1880 to 1891 as caused by increasing inequality (Piketty, Postel-Vinay, and Rosenthal 2004), the convergence that follows occurs under the same regime of high inequality that prevailed until WWI. The convergence, therefore, requires some innovation that reduced the impact of income on life span. In the next section, we argue that the development of water infrastructure was responsible for the convergence. Overall, life expectancy in Paris was very unequal, with large differences among neighborhoods (and much larger than among French departments) and closely related to income.
III. Sanitation and wealth
Clearly then, income first became more valuable over time for prolonging life, with a peak around 1891, and then a bit less valuable over time. Our hypothesis is that this evolution
is driven by the spatial diffusion of sanitation and by the more rapid implementation of direct connection to sewers in rich neighborhoods. Sanitation is generally seen as a major public health improvement, something that requires huge investment but benefits the whole population. It is thus a standard example of a public good. A closer look however, reveals that sanitation, and indeed most public health infrastructure, has to be laid out spatially and, as a result, benefits those neighborhoods that adopt first. Nor surprisingly these tend to be the toniest ones. Such processes are then exacerbated when there are significant connection fees, because the rich will be early adopters within each neighborhood.
Before addressing the issue of the relationship between wealth and access to sanitation, we briefly review the history of sanitation in Paris. The major sewers lines, which had been installed in most of Paris by the 1860s, could only accommodate liquid waste (Chevallier 2010: 244-246). Buildings were then equipped with a variety of waste disposal systems. In the most basic type, residents had to empty their waste water into pits or tanks that would later be taken away by night soil companies. More often buildings were equipped with waste pipes (these were often installed at the same time as running water) that emptied either into tanks or into filtering tanks (akin to septic systems) that captured solids and let the liquids drain to sewers or the street. These tanks then had to be emptied regularly. In either case, the residents of buildings were exposed to contaminants of waste water. In 1886 the city first allowed
landlords to connect their buildings’ waste water pipes directly to the sewer (Jacquemet 1979:
517). Thus landlords had to decide whether to retrofit their buildings and pay an annual fee of 60 francs per downpipe that was connected to the sewer. Given an average rent of 300 francs per apartment in 1876 this fee was sizeable. To encourage owners of buildings in poor neighborhood to connect, buildings that rented for less than 500 francs faced a reduced fee of 30 francs. The fee remained substantial if rents did not respond to this improvement: in the poorest neighborhoods, more than 90% of the household paid less than 300 francs in rent. Then in 1894 the city made connection mandatory, but the law was selectively enforced. Older buildings were in effect grand-fathered and their owners decided whether or not to connect. For new construction, however, the law was binding. In fact, by the end of 1904, ten years after connections were mandated, only 37,342 buildings were directly connected to the sewers, half the total number of buildings in Paris. Nearly all structures built after 1894 were directly connected to the sewer; but connections in the old arrondissements where there was nearly no new construction show no sharp jump after that date.
Beyond its own efforts at improving the worst areas of Paris (Ilots insalubres), and the price discounts detailed above, the city did little to promote sewers (Jacquemet 1979).
Nevertheless sewer connections grew with two inflections, an early acceleration in the mid
1890s and then a slowdown in the mid 1900’s (Figure IV). In fact by 1906, the rate of sewer
adoption seems to have settled into some long-term process (slightly faster in the poorer, less connected neighborhoods; slightly slower in the richer ones). As a result there were steady gains. By 1913 almost 70% of the buildings were connected, although the 20th, 13th and 12th districts on the eastern edge of the city had yet to pass 60%. By 1928 when the detailed reports end, the connection rate topped 85% in the quartile of most favored districts and ranged between 67 and 77% in the bottom quartile. Hence sewers were a technological change whose endogenous adoption favored rich neighborhoods over poor ones for some time and thus actually furthered the spatial inequality within the city well past World War I.
[Figure IV about here]
Figure IV shows clearly that the most affluent neighborhoods in the city had the highest rate of connection at any point in time. A simple linear regression confirms that wealth was a strong determinant of the rate at which buildings were connected to sewers (Table II).11 Beyond the obvious idea that those who pay for it will get it first, we need to be more specific about the mechanisms that explain why the wealthiest neighborhoods get access to sanitation much earlier. A little theory helps frame the decisions of three sets of actors. First, each renter must decide how much to bid up rents for an apartment in a building directly connected to the sewers. Second, each landlord must choose whether to provide a direct connection to
the sewer. Third, the city’s sanitation department has to prioritize the extension of the
sewer-pipe system.12
[Table II about here]
Consistent with our assumption that rents can stand as a good proxy for consumption, let us assume that the willingness of Parisian households to pay for a direct sewer connection increases with income. In effect, direct connection to the sewers is a luxury good: the rich are more willing to pay for the service than the poor. And there will be a threshold income above which households are willing to pay at least the average cost of connecting to the sewer.
Now let us turn to building owners and the way real estate was owned in Paris prior to WWI. As the 1900 real estate census reports, the 883,871housing units in the city were divided among 74,025 buildings. In this period, (before condominium associations), each
11 Given the fast increase in sewer connection rates, it is clear that we need to use the full yearly sample from 1885 to 1913 if we are to understand the phenomenon. To do so, we linearly interpolate fiscal rents between census years (every five years). The data on the fiscal rents available yearly at the district level allow us to control that it is quite a good approximation.
12By 1894 each arrondissement had at least 65% of the sewers it would have in 1911 and for the city as a whole 80% of the sewers’ extant at the end of the period had been put in place before connections became mandatory)
building had at most one owner. Thus, at the very least 82% of the households were renters. The real proportion was no doubt higher given that many buildings in poor neighborhoods were owned by individuals who were renters in other nicer buildings and that, if the estate tax data are any indication, the very rich owned multiple buildings. Thus, the decision to connect to the sewer was made by landlords who wanted to maximize rental income—but their decision depended on how much their tenants would bid up rents if units were directly connected to the sewer.
As long as the demand for sewer connection is an increasing function of income, rent will increase more in absolute value for an expensive apartment than for a cheap one. Thus
landlords’ incentives to provide the improvement will increase with the quality of their
buildings. The initial 30 or 60 francs per connected down pipe fee made it a costly investment–by some account double the costs of traditional septic tanks. Thus it is not surprising that connections rose more quickly in richer than in poorer areas–and that income and infrastructure were correlated. As long as the connection decision was left within private hands, there was bound to be a delay in the take up of poor neighborhoods.
One might think that the city could have levied a tax (on buildings or consumption) and connected all buildings in short order. Yet in a highly unequal society political economic considerations will get in the way of any such scheme. Indeed, any such compulsory scheme would feature either a subsidy from landlords to poor tenants or from the top part of the income distribution towards the bottom. Because the size of the subsidy rises with inequality,
the rich’s opposition to any such scheme also grows with the level of inequality. In any case,
Parisian landlords were publicly opposed to any legal requirement that they connect their buildings to the sewer. They waged a long judicial and political battle to delay the passage and implementation of the 1894 ordinance that made connection to sewer mandatory (Jacquemet 1979). Owners of buildings in the Champs Élysées neighborhood did adopt the new technology with great alacrity, because doing so led tenants to bid up the value of their rents by more than the cost of implementing the new technology. In poorer neighborhoods, tenants would still desire the improvements but, with a smaller budget, they could only offer much smaller increases in rent to landlords–not enough to induce them to retrofit buildings.
Now we can step back to the city planners’ decisions. Let us assume they knew that
water-borne diseases were a major contributor to the city’s mortality, and that mortality was particularly high in poor neighborhoods and thus wanted to maximize the diffusion of the sewers. To pay for additional infrastructure, they could borrow as long as user charges covered interest and maintenance. In this case, it would make sense to equip richer
neighborhoods faster than poorer ones, and indeed the correlation between rents and the ratio of street to sewer length per arrondissement is positive. It is largest early on (0.65 in 1880) and then declines over time as more and more neighborhoods become better equipped (0.47 by 1906). In fact, the increase in sewers’ length was much faster than building connections: as the city were pushing for adoption, it did its part of the job by swiftly implementing new sewers (to be sure main sewers existed for centuries in the old part of the city and were all completed before the end of the 19th century in the periphery). In all cases, sewer equipment was in no way a binding constraint on adoption–even in the poorer neighborhood–as most of the needed underground infrastructure was completed even before the 1894 ordinance. It also makes sense to price discriminate and charge high-rent buildings more than low-rent buildings and use the proceeds to expand the network. This is precisely the mechanism used by the city with variations over time. In 1888, when connection was voluntary, owners faced 30 or 60 francs fees per connected pipe. But by the end of the century, with mandatory connection, a more complex schedule was in place: the schedule had twelve different fee levels ranging from 10 to 1500 francs annually per building (Préfecture de la Seine 1899: 9). Capturing the fees available from expensive housing units would thus be a priority and the system would expand there first. Overall, however, diffusion was slow because as noted above there were relatively few rich housing units available to subsidize the vast number of housing units rented by the poor. It was also slow due to the hostility of building owners and the political obstacles the city encountered in enforcing the 1894 ordinance (Jacquemet 1979: 535-545).
IV. Sanitation, income and mortality
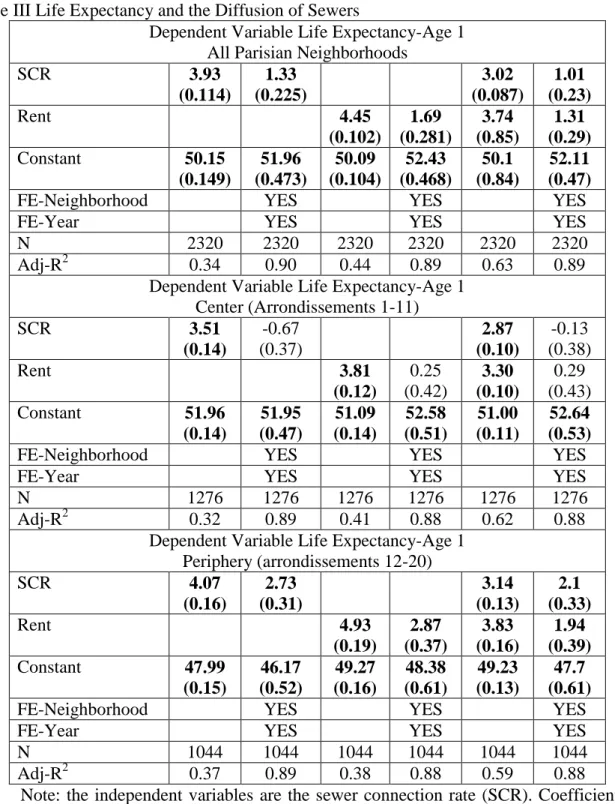
Let us now look at life expectancy, sewers, and income directly, temporarily leaving aside the sewer-rent relationship. Table III below reports regressions of life expectancy on, first, the fraction of buildings connected to the sewers and, second, the average rents by neighborhood; both with and without fixed effects. The dataset includes one observation per neighborhood per year. We begin with a straightforward correlation taking in all neighborhoods and without fixed effects. Sewers seem to have had significant positive
benefits, adding nearly four years to Parisians’ life expectancy. The impact of increasing
sewers by one standard deviation (28%) is a bit less that doing the same for rents, and it is robust to including rents. Overall, neighborhoods that are one standard deviation below the mean in either rents or sewers have a life expectancy three years lower than those at the mean.
The results are robust to splitting the sample between the center (where most building were old and connecting to the sewers involved a retrofit) and the periphery (where new construction drove connection). Although the impact of both rent and sewer connection fall by about two thirds when we add the full set of fixed effects, they remain highly statistically significant. The effects of sewers and rents are also economically significant since in the periphery a standard deviation increase in either rents or sewer connection increases life expectancy by two years. The decline in magnitude of the coefficients when we add fixed effects is clearly linked to the fact that all three phenomena we observe (decline of mortality, sewer connection, and increase in income) changed monotonically over time, so much of their variance is absorbed by the fixed-effects. But the fixed effects also net out local characteristics, annual demographic shocks and trends and so forth. In these conditions, it is all the more remarkable that the coefficients on sewers and rents remain well identified, for both Paris as a whole and for the periphery. For the center of Paris, where the built environment is much older, the process of change is not differentiated enough over time and space to allow us to identify parameters with the full set of fixed effects. More importantly, the explanatory power of the regression that includes both variables is significantly higher than with either one variable, which suggests each has an independent effect (in the models without fixed-effects). Similarly, in the models that include fixed-effects the coefficient of sewers changes little when the rent variable is included (and the same is true for the coefficient of rents when we include sewers) and remains statistically significant. Overall, sewers do seem to have had an important and significant impact in prolonging life.
[Table III about here]
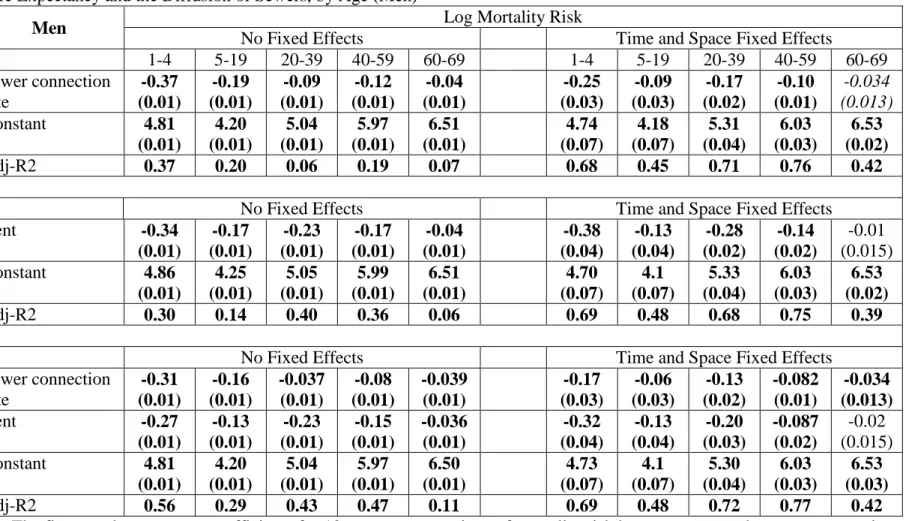
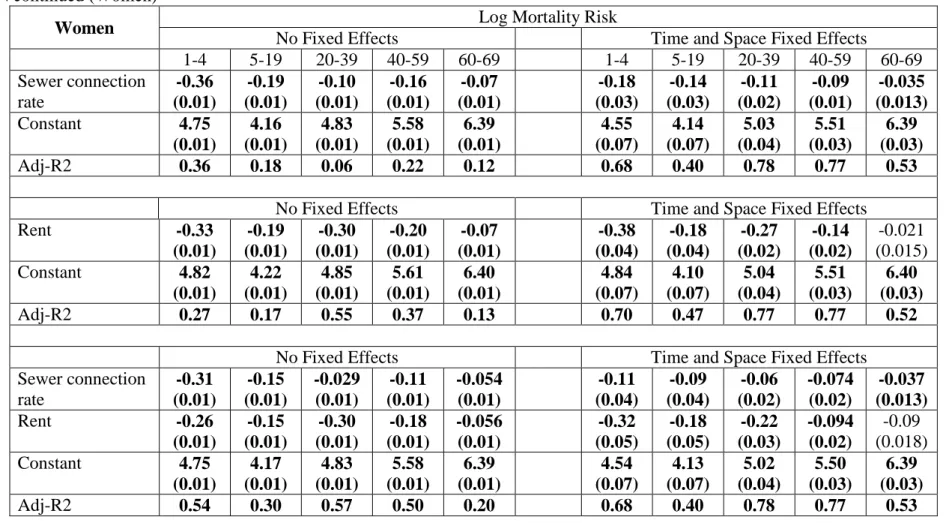
One can also examine the impact of sewers and rents on mortality by age group and by sex. There are two reasons to do so. First, one might imagine that women who bore the burden of the washing, cooking, cleaning, and childrearing would be more likely to benefit than men from sewers because they came in closer contact with soiled water. Second, if one were worried about the results being driven by migration, looking at older ages provides a robustness check since these groups were relatively less affected by in migration. To do so we look at age specific mortality risk as dependent variables, thus a negative coefficient implies lower risk and higher life expectancy. Table IV mirrors Table III for mortality risks, presenting first sewers alone, then rents alone, and finally both variables in the same regression. The first striking finding is that there are no statistical differences by sex. Men seem to have slightly larger gross benefits but because their mortality risk is higher on average, the proportional reductions are very similar. The mortality risk reduction from
sewers is highest at younger ages. What is surprising, though, is that the effect persists even past age 60: it remains statistically significant even if we include fixed effects. Again, sewers offered substantial declines in mortality risk.
[Table IV about here]
Nevertheless it is clear both from principles and from the spatial pattern of diffusion that sewer adoption is related to income. In that case, our direct regressions would clearly overstate the effect of sanitation, which in part results from wealthy neighborhoods’ early adoption. Similarly any regression of life expectancy on income would overstate the impact of income gains over time. As a first pass, we included both rent and sewer in the regressions and although the coefficients for both variables decline by about one third when included together, they are both still large and statistically significant, and of similar magnitude.
Yet despite these strong results one might be concerned that even if sewer adoption is not a proxy for income growth, it is endogenous. Thus we face both an identification and an endogeneity challenge. The identification challenge is to insure that sewers effects are not just a pass through of income gain effects. The endogeneity challenge is that the neighborhoods that adopt sewers first might do so because omitted factors make sewers most efficacious there. It should be noted that such factors would need to vary over time within a neighborhood (since either spatial or time invariant factors would be neutralized by our space and time fixed-effects). Among those possible factors we might think that the wealthy may be more prone to adopting sewers, increasing their cleanliness, and using new medical knowledge. While it is unlikely that these concerns are significant, an instrumental variable approach would be a good robustness check.
We thus need an instrument that is correlated to sewer adoption but not to a
neighborhood’s income. We also need that variable to pass the exclusion restriction, namely
that it does not act on its own to improve life expectancy. Most candidate instruments for sewer adoption fall by the wayside either because there are correlated with income or with mortality directly. We use the cumulated building permits starting in 1896 interacted with location. The ordonnance of July 1894 that mandated connection to sewer for new buildings applied to those building permitted in 1895 and occupied in 1896. Additionally, we divide
Paris into its old ‘center’ and the new ‘periphery’. The center (districts 1 to 11) had a very
stable population (about 1.2 million between 1881 and 1911) and an equally stable stock of buildings. In the center the ratio of building permits issued between 1882 and 1913 to the stock of buildings in 1913 is 0.32; and the stock of building in 1896 represented 97% of the
stock of 1913. In the center new buildings accounted for a tiny fraction of connections: our instrument is not valid.
In contrast, in the periphery (districts 12 to 20), population grew by more than 60% from 1881 to 1913 and most buildings were erected after 1880. The ratio of building permits issued between 1882 and 1913 to the stock of buildings in 1913 is 0.77. More importantly the stock of buildings in 1896 was only 79% of the stock of 1913. While new constructions were of much better quality than the initial buildings (rents increased much more on the periphery than in the center) the growth of the stock is clearly related to the growth of the city overall and not nearly so much to rents. In fact, the correlation between rents in 1876 (or any subsequent year through 1900) and the ratio of building permits to total buildings is negative overall. More importantly it is very close to zero (e.g. -0.03 in 1876, and 0.06 in 1900) for the periphery. Because building permits vary over time we can afford to include fixed effects in the regression when we use them as an instrument.
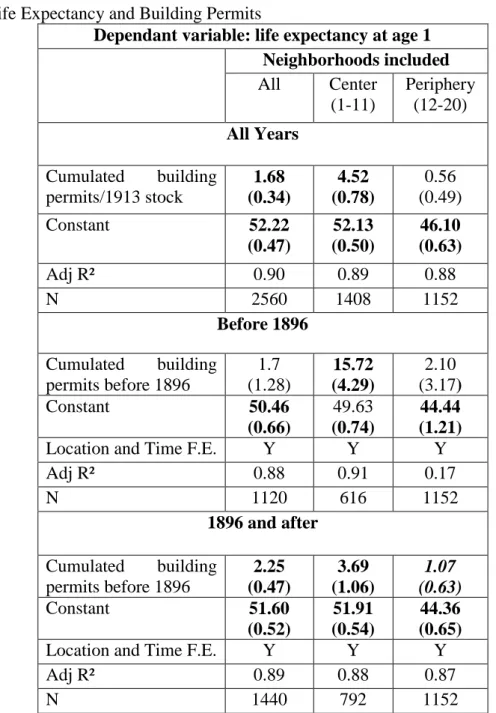
Clearly then, in the periphery, building permits were related to sewer connections but not to rents. They allow us to identify effects other than income on mortality. Yet they have a serious potential disadvantage: new buildings are typically better than old ones, and thus building permits might fail the exclusion restriction. In this view, the problem is that new buildings, although connected to the sewer, are likely to have had other life-prolonging attributes. Thus the building permits are markers of other investments that improve life expectancy. There is an alternative view that suggests that new construction was good in rich neighborhood and not very good in poor ones and that the mandate for direct connection was the most important element in improving buildings. Hence new constructions would have improved life expectancy much more after 1896 (the earliest date when buildings covered by the mandate were completed and occupied). Because our data run for 15 years before and after that date, we can test this hypothesis. Table V shows that, overall, the cumulative number of building permits has a strong positive effect on life expectancy–a necessary condition if we are to have a useful instrument. When we break the data down into two sub periods (one before 1896 and one after), the difference in impact is striking. As the second panel of Table V shows we cannot identify any direct effect of building permits on life expectancy before mandatory connection to sewers was implemented (1896), both overall and in the periphery. After 1896, however, both samples show a positive effect of cumulated building permits on life expectancy. For the center where the number of new buildings was tiny, the regressions give huge coefficients that are clearly not credible–the small number of new buildings cannot have any meaningful impact. In sum, looking at building permits
before and after sewer connections were mandatory suggests that the exclusion restriction is satisfied for the periphery.
[Table V about here]
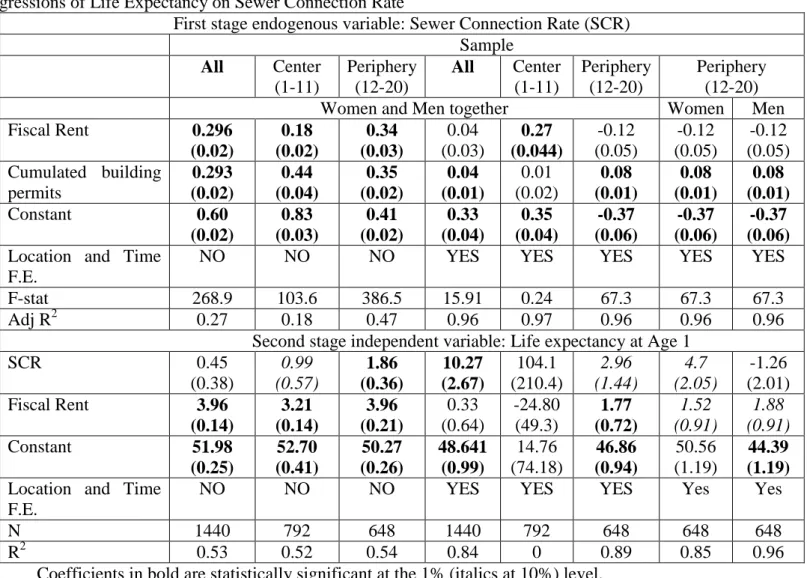
We estimate the effects of both income and sewers on life expectancy using building permits after 1896 as instruments for Paris as a whole, as well as for the center and the periphery for completeness sake. The key results come from the peripheral neighborhoods. We ran both the two stage least squares and generalized method of moments (GMM) regressions. The two methods produce startlingly close results. Accordingly we only report the two stage least squares results (see Table VI and VII).
The first half of Table VI reports regression results without fixed effects. These can be compared with the results in Table III where we did not instrument. For Paris as a whole and the center the variables have the same sign but only income is significant. For the periphery, where we think the instrument is valid, the impact of sewers is smaller with 2SLS than if estimated directly but it remains well-identified and socially significant (one standard deviation increase in sewer connections increases life expectancy by two years). The income coefficient remains almost unchanged. When we add fixed effects the results are equally dismal for the center and for Paris as a whole. In the periphery however, the 2SLS estimate coefficient is not very different from what we estimated without instruments and fixed effects, or with fixed effects and without instruments: one standard deviation increase in sewers adds between two and three years of life expectancy. Interestingly, the coefficient of rents suggest a roughly similar effect: a standard deviation increase in income also increases life expectancy by two to three years. Where our instrument is supposed to work, the results suggest that neither identification nor endogeneity are major problems. The 2SLS and the OLS results are equivalent. We find the same thing if we examine different impact by sex, again focusing solely on the periphery, it seems that income gains were equally important for reducing the mortality of women and men (the estimated coefficients at 1.52 and 1.88 are statistically very close). The effect of sewers, however, diverges a bit for men and women. For men the results are robust to including neighborhood fixed effects. For the very young sewers have a statistically significant and large effect. At other ages once we include time fixed effects, we can no longer identify the coefficients on sewers (suggesting that men’s mortality decline has a very strong time component). For women, sewers were very important at all ages (a
standard deviation increase in sewer connection raises women’s life expectancy by nearly five
was in the home it is not surprising that we can identify the effects for them better than for men.
[Table VI about here]
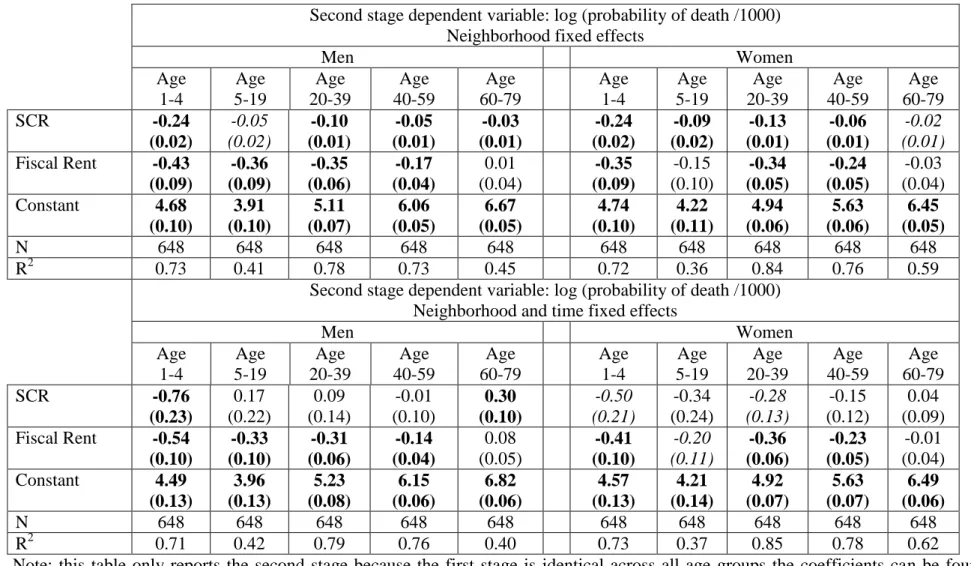
One last concern remains, however, that is the extensive migration, both immigration and residential mobility within Paris, and the selection it may induce. As a robustness test, we estimate two stage least square regressions as in Table VI but replace life expectancy with age specific mortality for different ages and sex (for simplicity we present only result for the periphery). We do not report the first stage again since it does not vary by age and is already reported in the previous table. Table VII reports the results for ages 1-4, 5-19, 20-39, 40-59 and 60-79 and includes only the peripheral neighborhoods. Each regression includes the full set of location and year fixed effects. Repeating the findings of Table VI, females from age 1 to 40 seem to receive significant benefits from the extension of sewers. Male infants seem to experience very large benefits, but sewers seem not to matter at all for other ages (and in fact for men over 60 the coefficient suggests sewers are a bad thing). Rent always has a negative coefficient and its magnitude is the same for both men and women. These results suggest that women, who came into contact with wastewater much more frequently than men because of their homemaking activities, were more sensitive to sewers than income. Nevertheless, the ubiquity of a negative impact on mortality risk of both income and sewers suggests that these effects are unlikely to be driven by migration into Paris, since the large majority of migrants were young adults.
[Table VII about here]
We can take the estimates from Table VII and consider what they imply for Paris as a whole. To begin they offer an explanation of the divergence followed by convergence of life expectancy in the city. The residents of the eight high income neighborhoods we began with had long benefited from their high income: they had low mortality and it was declining as they were gaining income. Then, in the 1890s and early 1900s they got an additional boost from their early adoption of sewers. In contrast our twelve poor neighborhoods likely experienced smaller income gains (since this was a period of increasing wealth inequality) and they had to wait until 1927 to reach the level of sewer connection that the wealthy eight had achieved by 1906. It is not surprising then that life expectancy diverged in the early days of infrastructure investment.
IV. Conclusion
The increase in longevity that began in the mid-nineteenth century in North-Atlantic countries and spread over the next century to the rest of the world is linked to income growth. When looking at the process in more detail, though, it is clear that longer lives were not evenly distributed in the population. This was especially true in densely crowded cities with bad living conditions. In the past urban dwellers experienced a huge mortality penalty. Nowadays inequality in income or wealth within cities is still high. But while cities in the developed world have reduced inequality in life expectancy (in Paris today such differences are a third of what they were a century ago) thanks to infrastructure improvements, most cities of the developing world still face the extraordinary range of living conditions that once characterized Paris. In these places to be poor is to die younger, not only because of low income but also because the poor areas of cities lack basic infrastructure.
This paper documents a very close connection between life-expectancy inequality and economic inequality. It also measures the contribution of public infrastructure to mortality decline. To disentangle the effects of income and infrastructure on life expectancy we examine the pace at which sewers were adopted across Parisian neighborhoods between 1885 and 1913. Once controlled for all invariant neighborhoods features and all time trends, the effect of sewers and income are roughly comparable, with one standard deviation of either variable increasing life expectancy at age one by two years, or five percent.
As a robustness check on this result, we use an IV strategy to instrument for sewer connection. Building permits in the periphery give us an instrument for the rate at which buildings were connected to the sewers that is not correlated with income or rents. To validate this instrument we examine its impact on life expectancy before sewers were adopted and show that although new buildings were probably better than older ones they did not contribute directly to improvements in life expectancy in the peripheral part of Paris. It is only after sewer connection became mandatory that life expectancy gains became substantial in the poorer neighborhoods of Paris. One might want to exploit variation in the impact of sewers on different diseases or groups of individuals. Computing mortality risks for finer and finer subgroups of the population, however, raises ever greater problems of endogeneity.
In thinking about differential mortality, scholars tend to stress the responsibility of either income or location. For instance, the rich live longer because they can afford life enhancing activities–better and more food, private health care, cleaner clothes, isolation from the sick and so on. Conversely, tropical areas have high mortality because the disease environment is severe. When thinking about increasing life span, one tends to contrast private consumption
(of food or medicine) with public goods like sanitation and cleanliness which are assumed to benefit everyone. However, it is important to take sanitation and many other investments that prolong life, for what they are: network goods that involve some user charges. This was true historically in North Atlantic countries and remains true nowadays in developing countries.
The high user fees imposed a long delay between the initially availability of sewers and their adoption in the poorer districts of the periphery. That delay had significant social cost. As an illustration, we estimate a counterfactual: what would the life expectancy of these districts have been had they achieved in 1900 the sewer connection rate that they experienced in 1928. This would have tripled their connection rates from just about a quarter of buildings connected to more than three quarters. Using our smallest coefficients (Table VI) the gain in connections would have raised life expectancy by four years. There are three ways to consider how substantial this gain might have been. First, this jump would have been enough to propel life expectancy in the worst decile of neighborhoods all the way to the level experienced by the median neighborhoods for Paris as a whole. Second, had one wanted to achieve the same effect by increasing income (or rents) one would have had to double them; at 2% growth (which is twice the rate of growth of rents and likely exceeds the growth of wages in Paris) that would have taken 35 years. Finally, since the life expectancy at age 1 was about 47, the increased life span coming from sewers would have mostly involved extra years of work. Two factors conspired to keep life span remained massively unequal in Paris on the eve of World War One. First income gains were concentrated at the top; second the non-trivial user charges on sanitation also concentrated benefits towards the top. In sewers, as in many other things, the trickle down is slow.