HAL Id: hal-01573004
https://hal.archives-ouvertes.fr/hal-01573004
Submitted on 8 Aug 2017
HAL is a multi-disciplinary open access archive for the deposit and dissemination of sci-entific research documents, whether they are pub-lished or not. The documents may come from teaching and research institutions in France or abroad, or from public or private research centers.
L’archive ouverte pluridisciplinaire HAL, est destinée au dépôt et à la diffusion de documents scientifiques de niveau recherche, publiés ou non, émanant des établissements d’enseignement et de recherche français ou étrangers, des laboratoires publics ou privés.
S. M. Ramos, E. N. Hering, G. Lapertot, F. Wilhelm, A. Rogalev, et al.. XMCD measurements under pressure confirm ferromagnetism in YbCu2Si2 but find none in YbRh2Si2. International Conference on Strongly Correlated Electron Systems (SCES), Jul 2014, Grenoble, France. 6 p., �10.1088/1742-6596/592/1/012015�. �hal-01573004�
XMCD measurements under pressure confirm
ferromagnetism in YbCu
2Si
2but find none in
YbRh
2Si
2S M Ramos1,4, E N Hering1,4, G Lapertot1, F Wilhelm2, A Rogalev2, F Baudelet3, D Braithwaite1
1
Univ. Grenoble Alpes, INAC-SPSMS, F-38000 Grenoble, France CEA, INAC-SPSMS, F-38000 Grenoble, France
2
European Synchrotron Radiation Facility (ESRF), CS40220, 38043 Grenoble Cedex 9, France.
3 Synchrotron SOLEIL, LOrme des Merisiers, St Aubin BP48, 91192 Gif-sur-Yvette cedex, France.
E-mail: ramos.scheilla@gmail.com
Abstract.
YbCu2Si2 and YbRh2Si2 have a similar phase diagram above 8GPa. While YbCu2Si2 is a well-known valence fluctuating compound that orders probably ferromagnetically above Pc=8GPa, in YbRh2Si2 the nature of the magnetic order at high pressure remains unclear.
However, the fact that ferromagnetic (FM) fluctuations are found at low pressure leads to a robust speculation that the high pressure order could be FM. In this work, we have investigated the magnetic order induced by pressure in both compounds, by means of XMCD spectroscopy. Our measurements have confirmed the ferromagnetism in YbCu2Si2 through a clear saturation in the magnetization for pressures above Pc. On the other hand, the XMCD signal for YbRh2Si2
remains weak even at 25 GPa, pointing out a clear difference between the high pressure ordered phase of these compounds, and suggesting that FM order is unlikely if not completely excluded.
1. Introduction
In the last three decades, heavy fermion (HF) compounds have been extensively used to investigate quantum critical phenomenon, as they can be relatively easily tuned through a quantum phase transition[1]. These intermetallic compounds are situated between the classical rare-earth ones, with well localized f electrons, and the intermediate-valence ones, for which a strong mixing of f and conduction electrons is observed. In the HF systems, the f shell occupation number weakly deviates from integer value, leading to an ambiguous character of the f electrons (itinerant versus localized) at low temperatures, with strong low energy magnetic and/or valence fluctuations.
At least for Ce and Yb based HF systems, the Doniach picture can be used as starting point to understand their behavior at low temperature. In the Kondo lattice model, the magnetic moments, coming from the 4f electrons, form a regular sublattice that can present nonmagnetic or magnetically ordered ground states due to the competition between on-site Kondo and
4 Science without borders fellowship, CNPq, Brazil
in the quantum criticality, since applied pressure is expected to induce larger changes of the valence[2]. As an example, valence instability was directly observed in the tetragonal YbCu2Si2
compound under pressure by Resonant Inelastic X-ray Scattering measurements[3]. This is an ideal prototype Yb system, presenting a moderate γ = 135mJmol−1K−2[4], that obeys Doniach’s phase diagram. With pressure, the system evolves from a paramagnetic state to an ordered one[5, 6], reached at the critical pressure Pc ≈ 8GPa. The nature of the ordered
phase was investigated by AC susceptibility[7] and magnetization[8, 9] measurements, that strongly suggest that the induced magnetic order is ferromagnetic (FM). The phase transition close to Pc may be of first order, as pointed out by M¨ossbauer measurements[10, 11], that
have found a spectrum with two well-separated non-magnetic and magnetic components (Yb magnetic moment≈ 1.25µB), although transport measurements close to the critical pressure find
a behavior very similar to the predicted effects of a second order quantum phase transition[6].
ac T ( K ) (P-P c ) 3/4 C ac T L T ( K ) P(GPa) YbRh 2 Si 2 p* T H
Figure 1. Adaptation from the literature [3, 13] of the phase diagrams of YbRh2Si2and YbCu2Si2compounds,
showing a clear similarity between the shape of magnetic phases above 8GPa. In contrast to an abundant number of
antiferromag-netic (AF) Kondo lattice systems, for which the AF quan-tum critical point (QCP) has been intensively investi-gated, until recently there was no good equivalent exam-ple for a direct transition from a FM to a paramagnetic ground state. Another interesting compound that may help to find a reason for the scarcity of systems with FM QCPs is the intensively studied system YbRh2Si2. Its
phase diagram at low pressures is quite complex, however at high pressures it is rather similar to YbCu2Si2[12](see
figure 1), showing also a clear anomaly in the specific heat above 8GPa at a temperature which reaches about 4K at 12 GPa[13]. In this compound, both FM and AFM fluc-tuations were found to coexist[14]. However, above 5GPa, FM coupling seems to play the dominant role[13]. Hence, investigations of ferromagnetism in these compound, us-ing a direct probe are highly desirable.
The objective of this work is to investigate the high pressure phase in both compounds by means of X-ray Magnetic Circular Dichroism (XMCD) spectroscopy in order to shine some light over the nature of the ordered state in YbRh2Si2. XMCD spectroscopy is
a very powerful element specific and orbital-selective magnetometry technique[15]. Its great advantage lies in the possibility to determine both the spin and the orbital
magnetic moments in amplitude and direction of the absorbing atom. The combination of this technique with recent advances in high pressure technology has offered unique possibilities in understanding the physics of magnetic materials under extreme conditions. XMCD spectroscopy under high pressure has become now a well established technique, and contrary to macroscopic measurements, it does not suffer from spurious magnetic traces coming either from the sample environment, such as the cell and gasket, or magnetic impurities in the sample itself.
2. Experimental details
The measured X-ray absorption spectra of atoms in magnetic solids depend on sample orientation, X-ray polarization and external magnetic field. The dichroism effect is given by the difference of the X-ray absorption intensities, measured for photons with positive and negative angular momentum aligned along the fixed magnetization direction of the sample. It can be measured either by changing the photon circular polarization or by switching the magnetization direction. Our approach is to apply XMCD spectroscopy under pressure to probe the magnetism of the Yb via the L3 absorption edge, instead of M4 one, which is usually
selected when investigating rare-earth based compounds. The strong hybridization between f and d electrons (Yb3+ - 2p64f135d1) creates an equivalence between measuring the Yb L3 edge
and the Yb M4 one. The last would be preferable but it is not possible to perform XMCD
measurements under pressure in that edge because of the diamond absorption. For rare-earth elements, the L3 absorption edge consists of two separated contributions, mainly due to electric
dipole transitions (E1: 2p→5d) but also due to electric quadrupole transitions (E2: 2p→4f ). In the case of Yb, these two contributions are well separated in energy ( 7eV), as shown in Fig 2 a, although it remains very difficult to quantitatively estimate directly the 4f magnetic moments without a reference sample. Further, even after separating the two contributions, the application of the sum rules to the E1 contributions yields a wrong sign of the 5d magnetic moments due to a spin-dependence of the transitions matrix[16]. Nevertheless, the intensity of the XMCD signal at the E2 transitions is directly proportional to the magnetization of the 4f magnetic moments.
left circularly polarized XMCD signal x10 Yb L 3 -edge Cu K-edge 2.7K 2Tesla 8.4GPa b) YbCu 2 Si
2 Figure 2. a) X-ray
absorp-tion spectra (XAS) recorded in partial fluorescence yield mode (PFY) at 7K for YbCu2Si2,
showing the quadrupolar peak E2[17]. b) XANES (X-ray ab-sorption near edge structure) for right and left circularly po-larized beams and the XMCD signal, recorded at 2.7K and 8.4GPa with field along c-axis. By using XMCD measurements we expected to be able to see a clear difference between the signals of two phases of the YbCu2Si2 compound, below and above Pc, if the ordered state
is indeed FM. And by comparing those two signals with the one obtained for YbRh2Si2, we
expected to obtain a relative value for the magnetization of that compound, also above and below Pc.
Both samples were prepared by In-flux method described in the literature[6]. In the case of YbCu2Si2, the high value of the residual resistivity ratio (RRR >200) of the samples used
indicates a very high crystal purity, implying no (or only extremely limited) indium substitution on the Si or Cu sites[3]. For the YbRh2Si2 case, the measured RRR of the crystals [13] was
about 300 and the residual resistivity ρ0 <1µΩcm.
Two synchrotron beam lines were used on this work. At the European Synchrotron Research Facility (ESRF) ID 12 beamline[18], a single crystal YbCu2Si2 sample was installed into a
membrane driven variable pressure cell loaded with He gas as the pressure medium[19]. The cell was mounted on a4He constant flow cryostat cooling the sample down to a constant temperature
of 2.7K. The pressure was changed in situ and measured by the fluorescence of a ruby chip placed inside the pressure chamber. A 6T superconducting split-coil was used to magnetize the sample. The external magnetic field was aligned parallel with the YbCu2Si2 sample’s easy
used to achieve a temperature of 4.1K. This time, the magnetic field direction was reversed, while the beam helicity remained constant.
3. Results
Considering that the intensity of the XMCD signal at the E2 transitions is proportional to the magnetization of the 4f magnetic moments on rare-earth elements, we have measured the field dependence of the XMCD signal in order to probe directly the magnetic state of the Yb atoms on YbCu2Si2. The obtained XMCD spectra were determined as the direct difference between the
normalized x-ray absorption spectrum for Yb L3 edge recorded with right circularly polarized
beam and the spectrum recorded with left circularly polarized beam. The order of magnitude of the XMCD signal normalized to the edge-jump of unity was nearly 2% . Figure 2 b shows an example of absorption spectrum obtained and the XMCD signal for a field of 2T. The element specific magnetization curves up to 2T, applied along c-axis, for different pressures at 2.7K are presented in figure 3. An almost linear dependence on magnetic field can be seen at 5.7GPa, while signs of saturation start at 7.6GPa. A strong increase in signal amplitude can also be seen above Pc. At 10.7GPa there is a clear change of slope with a start of saturation at about
0.2T, typical behavior of a FM. We did not measure YbRh2Si2 in similar conditions as the single
crystals grow in thin platelets making it almost impossible to measure with the field in the easy (a,b) plane. Instead both compounds were measured in powder form.
0.0 0.5 1.0 1.5 2.0 0.00 0.01 0.02 5.7GPa 6.5GPa 7.5GPa 7.6GPa 8.4GPa 10.7GPa -X M C D M a x a t Y b L 3 -e d g e Magnetic Field (T) 2.7K YbCu 2 Si 2 single crystal H//c//k
Figure 3. The element specific magnetization, measured at 2.7K and different pressures, for YbCu2Si2.
The saturation tendency at high pressures confirms the FM nature of the ordered phase above Pc.
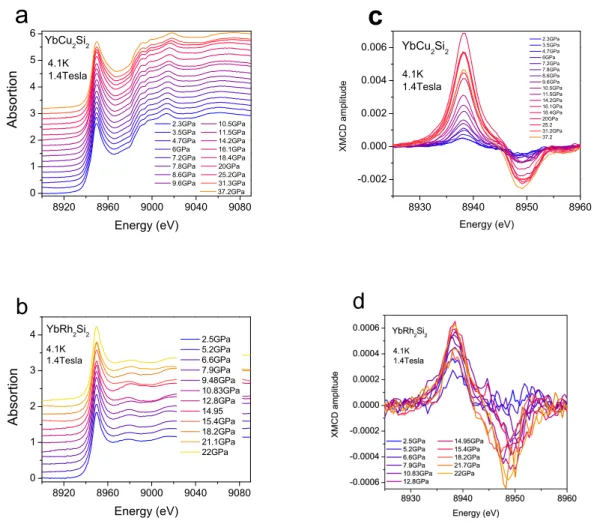
Spectra obtained for both compounds on the SOLEIL ODE beam line, by dispersive X-ray absorption spectroscopy (DXAS), can be seen in figure 4, where the XMCD signal is also displayed. At ambient pressure the intensity of the signals for both compounds is almost the same. However, when the pressure is increased, the signal for YbCu2Si2 starts to increase slowly
and at 5.7GPa it is already much stronger then the one for a pure paramagnet signal (figure 5). Above this pressure the signal increases drastically pointing out the proximity of a ferromagnetic phase. As for the YbRh2Si2compound, the XMCD signal remains weak and roughly constant for
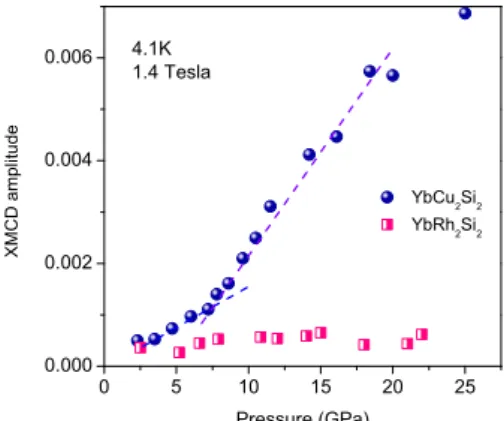
the whole pressure range. At the highest pressure achieved its signal is one order of magnitude smaller than the YbCu2Si2 one.
4. Discussion and conclusion
We know that the XMCD amplitude is directly proportional to the magnetic moment at the saturation condition. In YbRh2Si2, above 8.5GPa, the valence of the Yb ion is near three,
and valence fluctuations are completely suppressed [13]. On the other hand, for the YbCu2Si2
compound the valence of the Yb varies continuously without reaching the fully trivalent state at least until 22GPa [3]. In principle, if the high pressure phase for both compounds was FM, measurements at the same conditions would give XMCD signals that behave similarly. The simple and most likely explanation is that the high pressure order in YbRh2Si2 is AF. The
sensitivity of the measurement would not permit to observe decrease of susceptibility when going from the paramagnetic (PM) to AF state.
We must however take into account two points: first, we are not completely sure to be in the ordered state in YbRh2Si2. The SOLEIL measurements were made at 4.1K, slightly above the
highest ordering temperature measured for YbRh2Si2(3.6K at 12GPa), although the slope of the
phase boundary strongly suggests that, at pressures achieved in this experiment (up to 22GPa), the ordering temperature would easily exceed 4.1K. Futhermore, both the a.c. susceptibility and magnetization measurements on YbCu2Si2 show a strong increase several Kelvins above the
ordering temperature, which addictionally should be enhanced with field for a FM. So, a FM phase with a similar ordered moment as YbCu2Si2 (more than 1µB) can almost certainly be
ruled out for YbRh2Si2.
8920 8960 9000 9040 9080 0 1 2 3 4 5 6 4.1K 1.4Tesla A b so r t i o n Energy (eV) 2.3GPa 10.5GPa 3.5GPa 11.5GPa 4.7GPa 14.2GPa 6GPa 16.1GPa 7.2GPa 18.4GPa 7.8GPa 20GPa 8.6GPa 25.2GPa 9.6GPa 31.3GPa 37.2GPa YbCu 2 Si 2 a 8930 8940 8950 8960 -0.002 0.000 0.002 0.004 0.006 4.1K 1.4Tesla X M C D a m p l i t u d e Energy (eV) 2.3GPa 3.5GPa 4.7GPa 6GPa 7.2GPa 7.8GPa 8.6GPa 9.6GPa 10.5GPa 11.5GPa 14.2GPa 16.1GPa 18.4GPa 20GPa 25.2 31.2GPa 37.2 YbCu 2 Si 2 c 8920 8960 9000 9040 9080 0 1 2 3 4 A b so r t i o n Energy (eV) 2.5GPa 5.2GPa 6.6GPa 7.9GPa 9.48GPa 10.83GPa 12.8GPa 14.95 15.4GPa 18.2GPa 21.1GPa 22GPa YbRh 2 Si 2 4.1K 1.4Tesla b
Figure 4. DXAS spectra (a, b) and XMCD signal (c, d) for YbCu2Si2 and YbRh2Si2,
0 5 10 15 20 25 0.000
Pressure (GPa)
Figure 5. XMCD amplitude as a function of pressure.
and the moment detected from M¨ossbauer results (1.25µB) in the system, that 0.1µB is about the limit
of detection in our experiment. So, a FM phase with a weak ordered moment at high pressure cannot be completely ruled out.
Anyway these results point out a clear difference between the high pressure ordered phase of these compounds, and showing that FM order at high
pressure in YbRh2Si2 is finally unlikely if not excluded. XMCD measurements at lower
temperatures and higher magnetic fields must be performed to exclude, without doubts, the possibility of ferromagnetic order on the YbRh2Si2 compound above 8.5GPa.
Acknowledgments
We thank Georg Knebel for providing the YbRh2Si2 phase diagram presented in the
Introduction. This work was supported by the french ANR project PRINCESS and the Science without Borders, CNPq Brazil.
References
[1] L¨ohne H v, Rosch A, Vojta M and W¨olfle P 2007 Reviews of Modern Physics 79, 1015 [2] Flouquet J and Harima H 2009 arXiv:0910.3110
[3] Fernandez-Pa˜nella A, Baldent V, Braithwaite D, Paolasini L, Verbeni R, Lapertot G and Rueff J P 2012
Physical Review B 86 125104
[4] Sales B C and Viswanathan R 1976 J. Low Temp. Phys. 23 449 [5] Alami-Yadria K, Wilhelm H, and Jaccard D 1998 Eur. Phys. J. B 6 511
[6] Colombier E, Braithwaite D, Lapertot G, Salce B, and Knebel G 2009 Phys. Rev. B 79 245113
[7] Fernandez-Paella A, Braithwaite D, Salce B, Lapertot G and Flouquet J, 2011 Physical Review B 84 134416 [8] Tateiwa N, Haga Y, Matsuda T D, and Fisk Z 2012 Review of Scientific Instruments 83 053906
[9] Tateiwa N, Matsuda T D, Haga Y, and Fisk Z 2014 Journal of Physics, Conference Series 500 142032 [10] Winkelmann H, Abd-Elmeguid M M, Micklitz H, Sanchez J P, Vulliet P, Alami-Yadri K, and Jaccard D 1999
Phys. Rev. B 60 3324
[11] Sanchez J and Abd-Elmeguid M 2000 Hyperfine Interact. 128 137
[12] Yuan H Q, Nicklas M, Hossain Z, Geibel C, and Steglich F 2006 Physical Review B 74 212403
[13] Knebel G, Boursier R, Hassinger E, Lapertot G, Niklowitz P G, Pourret A, Salse B, Sanchez J P, Sheikini I, Bonville P, Harima H and Flouquet J 2006 Journal of the Physical Society of Japan 75 114709G
[14] Ishida K, Okamoto K, Kawasaki Y, Kitaoka Y, Trovarelli O, Geibel C and Steglich F 2002 Phys. Rev. Lett.
89 107202
[15] Beaurepaire E, Bulou H, Scheurer F, Kappler J P (Eds.) 2010 Magnetism and Synchrotron Radiation (Springer Proceedings in Physics vol 133)
[16] Ankudinov A L et al 2004 Europhys. Lett. 66 441
[17] Fernandez-Paella A, Baldent V, Braithwaite D, Paolasini L, Verbeni R, Lapertot G, and Rueff J P 2012
Physical Review B 86 125104
[18] http://www.esrf.eu/home/UsersAndScience/Experiments/Beamlines/content/content/id12.html
[19] http://www.esrf.eu/home/UsersAndScience/Experiments/SciInfra/SampleEnvironment/high-pressure.html [20] http://www.synchrotron-soleil.fr/Recherche/LignesLumiere/ODE
[21] Lausberg S, Steppke A, Syeinke L, Gruner T, Pedrero L, Krellner C, Klingner C, Brando M, Geibel C and Steglish F 2013 arXiv:1210.1345v2
![Figure 1. Adaptation from the literature [3, 13] of the phase diagrams of YbRh 2 Si 2 and YbCu 2 Si 2 compounds, showing a clear similarity between the shape of magnetic phases above 8GPa.](https://thumb-eu.123doks.com/thumbv2/123doknet/13042703.382541/3.892.535.756.563.902/figure-adaptation-literature-diagrams-compounds-showing-similarity-magnetic.webp)