HAL Id: hal-03147012
https://hal.archives-ouvertes.fr/hal-03147012
Submitted on 19 Feb 2021
HAL is a multi-disciplinary open access
archive for the deposit and dissemination of
sci-entific research documents, whether they are
pub-lished or not. The documents may come from
teaching and research institutions in France or
abroad, or from public or private research centers.
L’archive ouverte pluridisciplinaire HAL, est
destinée au dépôt et à la diffusion de documents
scientifiques de niveau recherche, publiés ou non,
émanant des établissements d’enseignement et de
recherche français ou étrangers, des laboratoires
publics ou privés.
In-situ assessment of the emissivity of tungsten plasma
facing components of the WEST tokamak
J Gaspar, M.-H Aumeunier, M Le Bohec, F Rigollet, S Brezinsek, Y Corre, X
Courtois, R Dejarnac, M Diez, L Dubus, et al.
To cite this version:
J Gaspar, M.-H Aumeunier, M Le Bohec, F Rigollet, S Brezinsek, et al.. In-situ assessment of the
emissivity of tungsten plasma facing components of the WEST tokamak. Nuclear Materials and
Energy, Elsevier, 2020, �10.1016/j.nme.2020.100851�. �hal-03147012�
Nuclear Materials and Energy 25 (2020) 100851
In-situ assessment of the emissivity of tungsten plasma facing components
of the WEST tokamak
J. Gaspar
a,*, M.-H. Aumeunier
b, M. Le Bohec
a, F. Rigollet
a, S. Brezinsek
c, Y. Corre
b,
X. Courtois
b, R. Dejarnac
d, M. Diez
b, L. Dubus
b, N. Fedorczak
b, M. Houry
b, V. Moncada
b,
P. Moreau
b, C. Pocheau
b, C. Talatizi
b, E. Tsitrone
b, the WEST team
1 aAix Marseille Univ, CNRS, IUSTI, Marseille, FrancebCEA Cadarache, IRFM, F-13108 St Paul lez Durance, France
cForschungszentrum Jülich, Institut für Energie- und Klimaforschung Plasmaphysik, 52425 Jülich, Germany dInstitute of Plasma Physics, The Czech Academy of Sciences, 182 00 Prague 8, Czech Republic
A R T I C L E I N F O
Keywords:
W emissivity Infrared thermography Heat flux decay width In-situ measurement
A B S T R A C T
In this paper, a method was developed to estimate in-situ the emissivity of the W-coated graphite divertor tiles in the WEST tokamak. This method is based on the double heating method and take advantages of the divertor temperature increase after successive plasma experiments due to the inertial behavior of the plasma facing components. Photonic calculations have been used to disentangle the emitted and the reflected parts in the measured radiances from the infrared system. The uncertainty as well as the robustness of the method have been investigated thanks to the wide IR and thermocouple coverage in the WEST divertor. The results show strong variation of the emissivity along the divertor W surfaces with a factor 4 variation after the experimental cam-paigns including 18.3 GJ and about 21 000 s of cumulated injected energy and duration, respectively. Finally, the implication of a non-uniform emissivity on heat flux estimation from IR measurements is discussed, showing that non-uniform emissivity must be considered to obtain an accurate heat flux decay width.
1. Introduction
Infrared (IR) thermography is widely used in fusion research to study the heat load distribution on the plasma facing components (PFC) [1–3]
as well as ensuring their protections [4–7]. To these ends, assessing the emissivity of tungsten (W) components, as foreseen for the ITER divertor
[8,9], is necessary to derive accurate surface temperature from radiation measured by infrared PFC monitoring systems. As a first step, a dedi-cated setup has been developed at CEA/IRFM to measure the emissivity of W samples representative of the WEST lower divertor, including W- coated and bulk W samples with different damage levels generated by electron gun (micro-cracks and crack network) [10]. The experimental results show that emissivity is strongly dependent on the wavelength and the temperature as well as the surface conditions (roughness, cracks, pollution by impurities). For the same wavelength and temperature, it was found for example that the presence of micro-cracks and cracks network resulted in an increase of emissivity by a factor 4. However, the
samples used in this study did not see plasma operation that could have modified the surface state through plasma surface interaction (erosion, deposition and possible damages) [11–14]. In the meantime, first observation of non-uniform emissivity of the W-coated PFC has been done during the 2018 experimental campaign [15]. Non-uniform emissivity has strong implication for plasma wall protection and for physical issues when assessing scrape off layer (SOL) width from infrared measurements for example.
An in-situ method is therefore needed to monitor the emissivity evolution in the tokamak. Several methods have been applied in different fusion device based on single heating method with simple consideration of the reflected flux (single reflection model). These methods used the baking phase [16,17] or dedicated heated tile with a heating wire [18]. In this paper we propose to take advantage of the WEST tokamak unique divertor settings (including optical and embedded thermal diagnostics) and the inertial behavior of the W- coated graphite PFC (temperature increase after successive plasma * Corresponding author.
Contents lists available at ScienceDirect
Nuclear Materials and Energy
Nuclear Materials and Energy 25 (2020) 100851
2
experiments) [19,20]. The method is based on the recording, by IR camera, of the IR radiance coming from isothermal divertor at several temperature levels, measured by embedded sensors before each pulse. Thanks to considerations on the reflected part of this collected radiance computed with photonic simulations, the radiance maps can be easily converted into emissivity maps. This paper presents the emissivity dis-tribution (poloidal and toroidal) of divertor PFCs estimated the last day of the 2019 experimental campaign (called C4) on the outer and inner W-coated graphite PFCs. For the PFCs considered in this study, the coating thickness is about 12 µm with a roughness Ra = 2 µm. Section 2
describes the IR system and the embedded thermal measurements as well as the emissivity calculation methodology using these diagnostics.
Section 3 shows the detailed processing of emissivity calculation in both toroidal and poloidal directions with error analysis. The comparison between two IR views looking at the same PFCs is also presented. Finally, section 4 presents the implication of the emissivity distribution on the heat flux estimation from IR measurement and especially for the heat flux decay width estimation.
2. Methodology of the in-situ emissivity measurement 2.1. WEST lower divertor thermal measurements
The WEST lower divertor is monitored by a set of thermal diagnostics composed by IR thermography [1,2], 20 embedded thermocouples (TC) located at 7.5 mm from the surface [21] and 4 fiber Bragg grating [22]
embedded at 3.5 and 7 mm from the surface and symmetric toroidal location with TC. The WEST IR system used in this analysis consists of several different actively cooled endoscope located at the top of the chamber looking down the lower divertor. An endoscope provides 2 views covering 2 divertor sectors of 30◦(toroidally with some overlap)
as shown in Fig. 1b). The endoscopes are equipped with IR cameras specially developed for WEST environment, which collect the radiance map at the wavelength of 3.9 ± 0.1 µm. The frame size is 640 × 512 pixels with projected pixel size from 2.3 to 5.8 mm/pixel depending on the PFC location in the field of view. The IR system is calibrated and translate the collected radiance into blackbody temperature, therefore
assuming surface emissivity equal to 1, of the wall elements as illus-trated in Fig. 1b) and c). The Fig. 1c) shows the blackbody temperature measured by the IR system on two tiles instrumented by 4 TC, one at the outer strike point region (solid lines) and one at the inner strike point region (dotted lines). These tiles are located at the toroidal positions where the ripple modulation of the incidence angle of magnetic field lines provides the maximum deposited heat flux in each region (PFC #21 and #31 as shown in Fig. 1). Poloidal profiles of blackbody temperature are extracted at the toroidal center of the tiles for two pulses of the same day. The data are average over the 2 s preceding the pulse start when the PFCs are isothermal thanks to the duration in between pulse (higher than 10 min). One can note the temperature increase over the day (70 ◦C
before the first pulse) and the non-uniform blackbody temperature of the divertor PFCs illustrating the emissivity variation along the poloidal direction. This variation is in good agreement with the surface state variation seen during the visual inspection after the end of the campaign, see Fig. 1a) and observations made after the previous campaign [23].
The temperature of the inertial W-coated graphite PFCs increases over the day due to the repetition of energetic pulses while the rest of the vacuum vessel is maintained at 70 ◦C thanks to the water cooling loop.
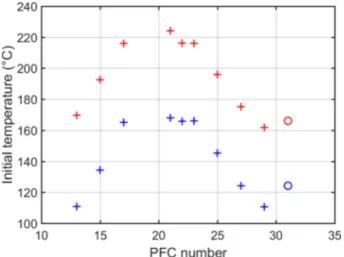
The Fig. 2 shows, for the pulses #55946 and 55963, the toroidal dis-tribution of the initial temperature for the 10 instrumented PFCs that follows the ripple modulation. This sector is called Q6A and it is monitored by 2 IR views called IRQ6B and IRQ6A.
2.2. Emissivity estimation with the double heating method
The collected radiance is composed of two terms. The first one is the emitted radiance depending on PFC’s temperature and its emissivity, the second one is the reflected radiance coming from the surrounding and self-reflection of the divertor on itself due to multiple reflection in the metallic high reflective environment. There are a number of possibilities for processing the collected radiance at various temperatures to deduce the surface emissivity [24–26]. An efficient method for emissivity measurement especially for low emissivity sample in complex reflective environment, as in the metallic environment of the WEST Tokamak, is
Fig. 1. (a) Picture of the sector Q6A
(studied here) after the 2019 campaign (C4). A total of 9 W-coated graphite PFCs were equipped with TCs which are indicated by their tile number on (a) and (b). (b) Blackbody temperature measured by the IR view called IRQ6B before the pulse #55963 start. (c) Blackbody temperature pro-files along the outer and inner PFCs located at the maximal heat flux location (for the tiles #21 and #31) due to the ripple modulation for two pulses #55946 and #55963 in blue and red, respectively. The PFCs tem-perature measured by the TCs are given in the figure caption. (For interpretation of the references to colour in this figure legend, the reader is referred to the web version of this article.)
the double heating method. The radiance is measured twice when the PFC is at the two different but uniform temperatures T1 and T2. The
measured radiances by the IR system can be written as follows:
Lm1=εLBB1+Lr1=Le1+Lr1 (1)
Lm2=εLBB2+Lr2=Le2+Lr2 (2)
where ε is the emissivity (supposed unchanged or with negligible
vari-ation for the two temperatures), Lm1 and Lm2 are the measured radiances at the PFC’s temperatures T1 and T2, LBB1 and LBB2 are the blackbody radiances computed with the temperatures T1 and T2 measured by the
TCs, Le1 and Le2 are the emitted radiances at T1 and T2, Lr1 and Lr2 are the reflected radiances when the PFC temperatures are at T1 and T2. A
common assumption is to consider Lr1 =Lr2, in this case the resulting emissivity is calculated by:
ε2T=
Lm1− Lm2 LBB1− LBB2=
ΔLm
ΔLBB (3)
In the WEST tokamak this assumption cannot be made due to the high reflective environment provided by metallic surfaces. In this configuration the reflected radiances variation must be calculated, and the emissivity is finally given by:
ε=(Lm1− Lm2)− (Lr1− Lr2) (LBB1− LBB2) = ε2T 1 + rwithr = ΔLr ΔLe (4)
where ΔLe=Le1− Le2 is the variation of emitted radiance. If (3) is used instead of (4) to compute the emissivity, the relative error Δε/ε on
emissivity is equal to the ratio r = ΔLr/ΔLe. It is then relevant, first, to track the magnitude of this ratio along the PFCs. Then, if it is non negligible, one has to check if this ratio profile depends on the thermal configurations (the two temperature levels T1 and T2) to finally define a
simple rule of correction, if any, of ε2T by 1 +r thanks to Eq. (4).
Pho-tonic simulations have then been performed using the Monte Carlo raytracing code SPEOS CAAV5 [27] to calculate the variation of re-flected radiance ΔLr=Lr1− Lr2 and compare it to the variation of emitted radiance ΔLe in typical configurations encountered in WEST. The code reliability and its ability to correctly reproduce reflections features have been proved on different configurations with the modeling of the wide-angle IR system in JET-ITER like [28] and the antenna viewing of Tore Supra [29]. The model used for this study is presented in
Fig. 3(a) with an example of PFCs surface temperature and emissivities used as input to describe the thermal environment (#55940 highest initial PFC temperature during C4). The second set of temperature used in the photonic calculation consider the divertor at a temperature be-tween 95 and 70 ◦C. Fig. 3(b) shows the result of the photonic
simula-tions. The ratio between the reflected and emitted radiance variations r = ΔLr/ΔLe=Δε/ε has been found non negligible with a toroidal
variation corresponding to the ripple modulation from 11 to 63% in the high and low temperature area, respectively. This ratio corresponds to the emissivity relative overestimation Δε/ε made by using the Eq. (3). A
fast radiosity modelling [30] has been also used to study the behavior of the ratio ΔLr/ΔLe with the divertor temperature increment. The results have shown a negligible dependence of this ratio to the divertor tem-perature increment in comparison to the uncertainty on the TC and IR data (discussed in the next section). These results allow us to use the ratio plotted in Fig. 3(b) in the Eq. (4) for all divertor temperature increment available in WEST. These ratios have been calculated with a uniform emissivity of 0.1 for the divertor, but the next section will show radial emissivity variations on the divertor with a factor up to 4 between its lowest and highest values for a given PFC, on outer side for instance. These radial variations imply that the ratio r should also vary with space which is not taken into account here. A more detailed photonic modelling is required to evaluate the radial variations of r and its impact on the emissivity accuracy (typically, on higher emissivity area, r is likely to be overestimated in this paper, leading to underestimated emissivity values). To reduce the influence of this assumption, the most part of the paper deals with the emissivity of the PFCs at the maximal heat flux location on the outer and inner side where the r value is minimum, about 11 and 14% respectively. In that locations, error on the r calculation will have lower impact on the emissivity values and the discussions.
Fig. 2. Toroidal distribution of the temperature measured by TC before the
pulses #55946 (blue) and #55963 (red) for the 9 OSP PFCs (cross) and the ISP PFC (circle) shown in Fig. 1. (For interpretation of the references to colour in this figure legend, the reader is referred to the web version of this article.)
Nuclear Materials and Energy 25 (2020) 100851
4
3. In-situ emissivity measurement for a pair of pulses from the last day of the 2019 campaign
Using the Eq. (4) and the ratio ΔLr/ΔLe obtained from photonic simulation (Fig. 3(b)) the emissivity map (poloidal and toroidal di-rections) of the instrumented PFCs can be assessed. For clarity, only the poloidal profile of the emissivity taken at the PFC center will be dis-played. In this section we will focus on the emissivity profile for the pair of pulses #55946 & #55963 from the last days of the C4 campaign. The confidence interval displayed in the figures is calculated with the Monte Carlo error propagation method [31] in regard to TC and IR accuracy. The emissivity calculation is repeated (>1000 times) varying randomly the TC and IR measurement within their accuracy limits. Then the sta-tistics of the corresponding calculated emissivity is examined, to finally obtain the confidence interval. The input data are randomly defined with 2*σTC =1.5 ◦C and 2*σ
IR decreasing with the radiance level from
16% down to 8% of the measured radiance in the range used in this study (2*σ corresponding to the 95% accuracy level). The confidence interval plotted in all figures are the standard deviation of the calculated emissivity corresponding to the 68% confidence interval.
3.1. Emissivity distribution along the divertor and uncertainty calculation
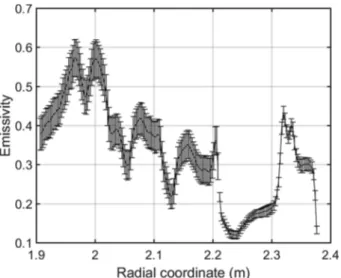
Fig. 4 shows the large variation of the emissivity along the two PFCs at the maximal heat flux location (not the same toroidal location: PFCs #21 and #31 as shown in Fig. 1). In the outer side (R > 2.21 m), the emissivity goes from 0.12 ± 0.01 at the maximal heat flux location up to 0.18 ± 0.013 in the plasma wetted area (R < 2.31 m) corresponding to a 50% increase. The emissivity is at his highest level in the magnetic shadowed area induced by the baffle that is located above the divertor. In this area which is prone to material deposition the emissivity goes from 0.43 ± 0.017 at the entrance of th shadowed area down to 0.3 ± 0.015 far from it. One can note that the minimal emissivity of 0.12 ± 0.01 obtained in the plasma wetted area (therefore prone to erosion) is close to the one measured on W-coated sample equal to 0.122 ± 0.006
[10]. Similar behavior is found in the inner side (R < 2.21 m) with higher emissivity value from a minimal value of 0.22 ± 0.03 at the maximal heat flux location and an increase up to 0.58 ± 0.05 far from it. The emissivity pattern exhibits also a non-uniform variation with bumps and hollows. As the visual inspection did not reveal any damage for these PFCs the emissivity variation can be correlated to impurities on the PFCs surface that will be further analyzed during post-mortem analysis.
3.2. Comparison of two different IR views
Thanks to the wide IR coverage of the lower divertor the instru-mented PFCs in the sector Q6A are viewed by two different IR endo-scopes IRQ6B and IRQ6A. Fig. 5 shows the good agreement of the emissivity calculated with the two IR views. Similar distribution and level are found with a discrepancy mostly in the confidence interval except for a part of the inner side for 1.95 < R < 2.05 m. This discrep-ancy could be due to higher angle dependence in this area induced by the important impurity accumulation here. As the main contributor in the confidence interval is the IR measurement due to low temperature for the IR calibration, the good agreement between the two IR views brings confidence in the estimated emissivities. In the rest of the paper we will present only the IRQ6B results.
3.3. Toroidal distribution over the ripple modulation
Fig. 6 shows the emissivity distribution on the OSP area only calculated for the 9 instrumented outer PFCs (see Fig. 1) for the pair #55946 & #55953 displayed without (a) and with (b) confidence in-terval. Equivalent poloidal distribution is observed for all PFCs with low emissivity in the wetted area and higher emissivity in the far SOL or shadowed area (below the baffle). One can note that the emissivity de-creases at the maximal heat flux location (R = 2.245 m) is stronger for PFCs located at the maximal heat flux location in the ripple modulation where the incidence angle is higher. The PFCs (#13, #15, #25, #27 and #29) in the low heat flux area (smaller incidence angle) exhibit quite uniform emissivity in the wetted area. On the other hand, PFC #13 exhibits a higher emissivity in comparison to the other PFCs, higher than his confidence interval (see Fig. 6(b)). Post-mortem analysis is required to confirm this behavior. It is important to stress that without the correction of the reflected flux variation with the PFC shown in Fig. 3(b) the emissivity would exhibit more pronounced toroidal variation only due to reflection.
4. Implication of emissivity distribution on heat flux calculation The consideration of non-uniform emissivity is necessary to derive accurate surface temperature from IR measurement for plasma wall protection and for physical studies as assessing heat flux decay width on the targets. For illustration, the blackbody temperatures measured by the IR system, on the PFC#21, during the pulse #55953 are converted into surface temperatures with different emissivity assumptions. The pulse #55953 is an He plasma in L-mode with Ip = 300kA, BT = 3.7 T, PLH = 3.7 MW and ne = 4.1⋅10−19 m−2. As the temperature dependence
of the emissivity in material deposition area is unknow, we did not consider the temperature dependence of the W coating emissivity which is lower (about 7⋅10−5 ◦C−1) than the observed spatial variation (up to a
Fig. 4. Emissivity distribution with uncertainty interval along the lower
divertor for the pair of pulses #55946 and #55963 (IR data from Q6B view).
Fig. 5. Emissivity distribution along the lower divertor obtained with the two
IR views IRQ6B (black) and IRQ6A (red) looking at the instrumented PFCs. (For interpretation of the references to colour in this figure legend, the reader is referred to the web version of this article.)
factor 4). Then the surface temperature is calculated for the different emissivity values: blackbody temperature ε =1 (black), ε(R) estimated with Eq. (4) (blue) and emissivity equal to 0.12 minimal value of ε(R) (red). The surface temperature at t = 24 s are plotted in Fig. 7. Considering uniform emissivity of 0.12 induces errors of about 100 ◦C
(23% of the heating) in the wetted area few cm away from the maximal heating location and up to 150 ◦C (70% of the heating) in the shadowed
area (R > 2.315 m). As a consequence, this overestimation of the surface temperature in the cold region implies high error on heat flux decay width derived from heat flux calculation based on IR measurement.
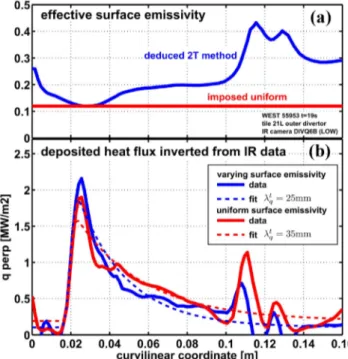
induces a 40% wider heat flux derived with IR measurement. This higher heat flux decay width is due to the overestimation of the temperature and consequently of the heat flux in the cold region as well as a bumpier heat flux distribution where the emissivity evolves rapidly from 0.12 to 0.18 (R ≈ 2.25 m). It is important to stress that in the current version of TEDDY, the non-uniform emissivity is considered but the IR treatment uses constant reflected radiance equal to the one derived at the pulse start. This can imply also error in cold region due to multiple reflection of the PFC heating during the pulse as depicted in [27].
Fig. 6. Emissivity distribution for the 9 outer PFC distributed in the ripple modulation (a) without and (b) with uncertainty interval. , , , ,
, , , , .
Fig. 7. Surface temperature calculated with IR measurement at t = 24 s for the
pulse #55953 with different assumptions on emissivity: (black) ε =1, (blue) ε(R) estimated with double heating method and (red) ε =0.12 minimal value of ε(R). (For interpretation of the references to colour in this figure legend, the reader is referred to the web version of this article.)
Fig. 8. (a) Input emissivities for TEDDY calculations (b) Heat flux profiles
calculated with TEDDY for the pulse #55953 around the outer strike point. Averaged heat fluxes between 18 and 20 s with uniform emissivity equal to 0.12 (red) and non-uniform emissivity (blue). (For interpretation of the references to colour in this figure legend, the reader is referred to the web version of this article.)
Nuclear Materials and Energy 25 (2020) 100851
6
50% has been found in few cm distance even in the wetted area of the outer side. This spatial distribution can induce an error ranging from 20 to 70% on the surface heating assessed by the IR measurement during the pulse and close to 40% on the heat flux width at the target obtained with IR measurements as illustrated with the TEDDY code. Emissivity value close to the W-coated sample equal to 0.122 [10] has been only found in the outer side, consistently with the net erosion assumption for this area.
These observations were made possible because of the development of an in-situ methodology for the emissivity assessment. This method takes advantage of the divertor temperature increase during the plasma operation and use photonic calculation to disentangle the emitted and reflected parts in the measured radiance. The emissivity uncertainty with the TC and IR measurements has been evaluated from 4 to 14%. The method has been applied on two independent IR views providing equivalent emissivity, therefore showing the robustness of the method. This method could be considered for the so-called WEST phase 2, when the whole divertor will be equipped with actively cooled ITER-like components, with the only condition of being able to modify the tem-perature of the divertor cooling loop only without modification of the other cooling loops (vacuum vessel, bumper, IR endoscopes). An alter-native method is also currently explored in [33] to identify the emis-sivity profile on the divertor PFCs by solving an inverse problem. In that method, the temperature of all the components inside the tokamak (on divertor and on all other walls) are known. The emissivity profile is then identified by solving a least squares problem that minimizes iteratively the difference between the measured infrared image and a modelized image built with a forward radiative model in which all reflections are taken into account.
Declaration of Competing Interest
The authors declare that they have no known competing financial interests or personal relationships that could have appeared to influence the work reported in this paper.
Acknowledgments
This work has been carried out within the framework of the EURO-fusion Consortium and has received funding from the Euratom research and training programme 2014–2018 and 2019-2020 under grant agreement No 633053. The views and opinions expressed herein do not necessarily reflect those of the European Commission and ITER Organization.
References
[1] M. Houry, et al., Fusion Eng. Des. 146 (2019) 1104–1107.
[2] B. Sieglin, et al., Plasma Phys. Control. Fusion 55 (2013), 124039.
[3] B. Sieglin, et al., Fusion Sci. Technol. 69 (2016) 580–585.
[4] X. Courtois, et al., Fusion Eng. Des. 146 (2019) 2015–2020.
[5] I. Balboa, et al., Rev. Sci. Instrum. 83 (2012) 10D530.
[6] G. Arnoux, et al., Rev. Sci. Instrum. 83 (2012) 10D727.
[7] M. Jakubowski, et al., Rev. Sci. Instrum. 89 (2018) 10E116.
[8] T. Hirai, et al., Nucl. Mater. Energy 9 (2016) 616–622.
[9] R.A. Pitts, et al., Nucl. Mater. Energy 12 (2017) 60–74.
[10] J. Gaspar, et al., Fusion Eng. Des. 149 (2019), 111328.
[11] T.K. Gray, et al., J. Nucl. Mater. 415 (2011) S360–S364.
[12] R.P. Doerner, et al., Phys. Scr. T167 (2016), 014054.
[13] A. Puig Sitjes, et al., Fusion Sci. Technol. 74 (2018) 116–124.
[14] G.A. Wurden, et al., Nucl. Fusion 57 (2017), 056036.
[15] N. Fedorczak, et al., Phys. Scr. T171 (2020), 014046.
[16] S. Shu, et al., Infrared Phys. Technol. 98 (2019) 1–6.
[17] C.J. Lasnier., Nuclear Fusion 38 (1998) 8 1225.
[18] P. Vondracek, et al., Fusion Eng. Des. 146 (2019) 1003–1006.
[19] M. Firdaouss, et al., Fusion Eng. Des. 124 (2017) 207–210.
[20] J. Bucalossi, et al., Fusion Eng. Des. 89 (2014) 907–912.
[21] J. Gaspar, et al., Fusion Eng. Des. 146 (2019) 757–760.
[22] Y. Corre, et al., Rev. Sci. Instrum. 89 (2018), 063508.
[23] M. Diez, et al., Nucl. Fusion 60 (2020), 054001.
[24] P.W. Webb, IEE Proc. G 138 (1991) 390–400.
[25] T. Walach, Measurement 41 (2008) 503–515.
[26] O. Riou, Measurement 89 (2016) 239–251.
[27] M.H. Aumeunier, et al., Nucl. Mater. Energy 12 (2017) 1265–1269.
[28] M.H. Aumeunier, et al., Rev. Sci. Instrum. 83 (2012) 10D522.
[29] M.H. Aumeunier, et al., IEEE Trans. Plasma Sci. 39 (2011) 11.
[30] P. Hanrahan, et al., SIGGRAPH 91 (1991) 197–206.
[31] J. Gaspar, et al., Int. J. Therm. Sci. 72 (2013) 82–91.
[32] A. Scarabosio, et al., J. Nucl. Mater. 438 (2013) S426–S430.
[33] C. Talatizi, et al., Fusion Engineering and Design, Volume 159, 2020, 11867.