HAL Id: hal-02902994
https://hal.archives-ouvertes.fr/hal-02902994
Submitted on 6 May 2021
HAL is a multi-disciplinary open access
archive for the deposit and dissemination of
sci-entific research documents, whether they are
pub-lished or not. The documents may come from
teaching and research institutions in France or
abroad, or from public or private research centers.
L’archive ouverte pluridisciplinaire HAL, est
destinée au dépôt et à la diffusion de documents
scientifiques de niveau recherche, publiés ou non,
émanant des établissements d’enseignement et de
recherche français ou étrangers, des laboratoires
publics ou privés.
biogeochemistry of the Mediterranean Sea
Stefano Guerzoni, Roy Chester, François Dulac, Barak Herut,
Marie-Dominique Loÿe-Pilot, Chris Measures, Christophe Migon, Emanuela
Molinaroli, Cyril Moulin, Paolo Rossini, et al.
To cite this version:
Stefano Guerzoni, Roy Chester, François Dulac, Barak Herut, Marie-Dominique Loÿe-Pilot, et al..
The role of atmospheric deposition in the biogeochemistry of the Mediterranean Sea. Progress in
Oceanography, Elsevier, 1999, 44 (1-3), pp.147-190. �10.1016/S0079-6611(99)00024-5�. �hal-02902994�
IN THE BIOGEOCHEMISTRY OF THE
M
EDITERRANEAN
S
EA
Stefano Guerzoni (*)
Istituto di Geologia Marina, CNR /via Gobetti, 101 /40129 Bologna, Italy
Roy Chester,
Oceanography Laboratory,University of Liverpool, P.O. Box 147 /Liverpool L69 3 BX, United Kingdom
François Dulac,
CEA, MIXTE Lab., Ctr. Faibles Radioactivites /Saclay 709 - CNRS, 91198 Gif-sur-Yvette, France
Barak Herut
Israel Oceanographic & Limnological Research/ Tel Shikmona /P.O.Box 8030 /31080 Haifa, Israel
Marie-Dominique Loÿe-Pilot
Ecole Normale Superieure, IBM - CNRS 386/ 1, Rue Maurice Arnoux 792120 - Montrouge, France
Chris Measures
Dept.of Oceanography, University of Hawaii at Mãnoa / 1000 Pope Road /Honolulu, HI 96 822 - USA
Christophe Migon
C.N.R.S./ Laboratoire de Physique et Chimie Marines/ B.P. 8 /06230 - Villefranche-sur-mer, France
Emanuela Molinaroli
Dip. Scienze Ambientali, Università di Venezia/ Dorsoduro 2137 /30123 Venezia, Italia
Cyril Moulin
CEA, MIXTE Lab., Ctr. Faibles Radioactivites /Saclay 709 - CNRS, 91198 Gif-sur-Yvette, France
Paolo Rossini
Istituto di Geologia Marina, CNR /via Gobetti, 101 /40129 Bologna, Italy
Cemal Saydam
Institute of Marine Science -METU/ P.O. Box 28 /33731 Erdemli-Içel, Turkey
Alexandre Soudine
WMO, Environment Division/ Case postale n° 2300 /CH-1211 Geneva 2, Switzerland
Patrizia Ziveri
Geomarine Center ,Vrije Universiteit Amsterdam/ 1081 HV Amsterdam, The Netherlands
(*) This paper is an expansion of discussions held at the CIESM-CNR Workshop in Bologna , 8-11 October 1997.
Abstract
Estimates of atmospheric inputs to the Mediterranean (MED) and some coastal areas are reviewed, and uncertainities in these estimates considered. Both the magnitude and the mineralogical composition of atmospheric dust inputs indicate that eolian deposition is an important (50%) or prevailing (>80%) contribution to sediments in the offshore waters of the entire
Mediterranean (MED) basin. Model data for trace metals and nutrients indicate that the atmosphere delivers more than half the lead and nitrogen, one-third of total phosphorus, and 10% of the zinc entering the entire basin. Measured data in sub-basins, such as the north-western MED and northern Adriatic indicate an even greater proportion of atmospheric versus riverine inputs. When dissolved fluxes are compared (the form most likely to impinge on surface water biogeochemical cycles), the atmosphere is found to be 5 to 50 times more important than rivers for dissolved Zn and 15 to 30 times more important for Pb fluxes. Neglecting co-limitation by other nutrients, new production supported by atmospheric nitrogen deposition ranges from 2-4 g C m -2 yr-1, whereas atmospheric phosphorus deposition appears to support less than 1 g C m-2 yr-1. In spite of the apparently small
contribution of atmospheric deposition to overall production in the basin it has been suggested that certain episodes of phytoplankton blooms are triggered by atmospheric deposition of N, P or Fe. Future studies are needed to clarify the extent and causal links between these episodic blooms and atmospheric/oceanographic forcing functions. A scientific program aimed at elucidating the possible biogeochemical effects of Saharan outbreaks in the MED through direct sampling of the ocean and atmosphere before and after such events is therefore highly recommended.
Introduction
Over the past two decades it has become apparent that the atmosphere is not only a significant but in some cases the dominant pathway by which both natural and pollutant materials are transported from continents to both coastal and open seas. These substances include mineral dust, plant residues, heavy metals, nitrogen species from combustion processes and fertilisers, pesticides, and a wide range of synthetic organic compounds from industrial and domestic sources. Some of these substances, such as lead and some chlorinated hydrocarbons, when carried into oceans by the atmosphere, are potentially harmful to marine biological systems. Others, such as nitrogen species, phosphorus and iron, are nutrients and may enhance marine productivity. For some substances (e.g. aluminium, cadmium, lead, and some rare earth elements), atmospheric flux has an important impact on their oceanic chemical cycles. Atmospheric inputs may thus exert many different effects on the marine environment, and it is necessary to understand the magnitude and geographical distribution of the atmospheric fluxes of these materials to both coastal and open seas. Indeed, there have recently been a number of intensive studies of atmospheric inputs to coastal waters in North America and Europe, with several studies also devoted to investigating these processes in open oceans.
The most complete review of this subject, updated to the early 1990s, was a report by the Group of Experts on the Scientific Aspects of Marine Environmental Protection (GESAMP, 1989), much of which was subsequently published as a review article in the scientific literature (DUCE et al., 1991). The present paper briefly reviews results from several of these studies, especially those related to the Mediterranean Sea.
The biogeochemical effects of mineral dust deposition to the water surface are of interest from several perspectives. The observation of more than 30-fold increases in dust deposition during glacial periods suggests a link between climatic oscillations and carbon cycling in the surface ocean on global and glacial scales (MARTIN, 1990). This link is created through the roles played by eolian deposition in supplying Fe to remote parts of the open ocean and by iron limitation in controlling primary production. In these high-nutrient/low-chlorophyll (HNLC) regions, there may be a direct connection between atmospheric and biological processes (MARTIN, 1990; KUMAR et al., 1995).
Dust input to the nutrient-limited Mediterranean (MED) basin (2.3 × 10⁶ km2) is one of the greatest in the contemporary ocean (20-50 x 106 tons yr-1) and it is thus a natural laboratory in which to study the effects of dust deposition on the surface ocean in a setting that is distinct from the HNLC regions (COALE et al., 1996). There have been several hypotheses suggesting that this large dust input is responsible for biogeochemical effects, although no concerted scientific program aimed at elucidating these effects directly has yet been set up.
The aim of the present paper is to review current understanding of the magnitude and effects of dust inputs to the MED and to highlight important areas of uncertainty. Section 1 considers the magnitude of atmospheric dust inputs and problems related to their estimates. Section 2 compares fluxes of trace elements from atmospheric and riverine sources and considers evidence that atmospheric inputs affect the chemistry of surface waters in the MED. Section 3 looks at the role played by atmospheric processes in delivering nutrients to the surface MED and their spatial effects. Section 4 considers current hypotheses of mechanisms by which atmospheric deposition is believed to affect surface water biogeochemical cycles, focusing particularly on the roles of phosphate and iron, and reviews what evidence exists to evaluate them.
1. Magnitude and mineralogical composition of atmospheric mineral dust input
Budgets and residence time estimates for trace metals and nutrients in the oceans have traditionally been based on riverine fluxes and have neglected atmospheric and other inputs. For most major and minor components of seawater, the atmosphere has generally been assumed to be a secondary source. However, over the last 20 years systematic studies of atmospheric inputs to the MED have been undertaken, and sufficient data are now available to allow fairly reliable estimates to be made. The most comprehensive study is that prepared by GESAMP (1989), together with several recent reviews devoted to the Western MED within the EROS 2000 project (MILLIMAN and MARTIN, 1997). For rivers, there is the major problem of understanding and quantifying transport through estuarine and coastal regions to deep waters. MILLIMAN et al. (1995) and GESAMP (1989) both attempted to address this problem by compiling run-off data for countries surrounding the MED. It is important to note, however, that many of these data reflect historic not present-day discharges. A good example of this is the decreased flow to the western MED, as illustrated in the introduction to the EROS-2000 DSR-II special issue (MILLIMAN and MARTIN, 1997). The Rhone and many Italian rivers currently have discharges very similar to those of 40 years ago, whereas most Spanish and north African rivers have been dammed in the past 20-30 years.
Atmospheric flux estimates suffer from an undersampling problem. The atmosphere is a very dynamic compartment of the earth’s system, within which concentrations of reactive gases and particulate matter vary considerably in space and time. This variability ranges from rapid day-to-day changes in pollutant concentrations (lead, cadmium, NOx, SOx) to massive temporal and spatial changes in dust
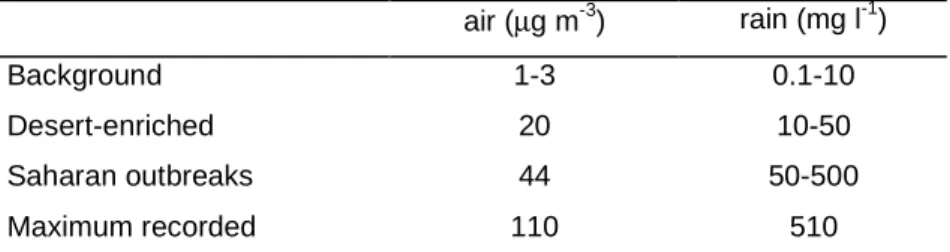
loading over the entire MED (Tab. 1.1), as a result of dust storms in North Africa (GUERZONI et al., 1997; BERGAMETTI, 1989; DULAC et al., 1989, 1996; LOŸE-PILOT and MARTIN, 1996).
Tab. 1.1 - Range of insoluble particulate load concentrations in air and rain during two years at Sardinia (39°N, 9°E: from Guerzoni et al., 1997).
air (µg m-3) rain (mg l-1)
Background 1-3 0.1-10
Desert-enriched 20 10-50 Saharan outbreaks 44 50-500 Maximum recorded 110 510
background :Al/Si < 0.3; Ca <2 %; associated rain pH < 5.60; Ca < 200 meq l-1 desert enriched = Al/Si > 0.3; Ca > 2 %; Saharan outbreaks = Al > 1000 ng m-3; Al/Si > 0.4; Ca > 4%.
The high spatial and temporal variability of dust transport and deposition, coupled with the short duration of oceanographic research cruises, has made it difficult to obtain good estimates of dust deposition to those areas of the open ocean devoid of islands at which continuous sampling can be undertaken.
Encouragingly, however, recent results from ship-board collections of aerosol metals over the North Sea, where a steep spatial gradient in aerosol concentration is found (YAAQUB et al., 1991), are comparable to samples collected at the coast (CHESTER et al., 1993; KANE et al., 1994). This finding suggests that atmospheric fluxes estimated from coastal sites may be extrapolated to adjacent marine areas. A similar result was found in the Western MED (WMED) where MARTIN et al. (1989) and CHESTER et al. (1993) showed that background aerosols at sea have similar Pb and Cd values to those collected at a remote coastal station in Sardinia (GUERZONI et al., 1997).
Despite the shortcomings of these estimates, for many trace elements (e.g., Al, Pb, Zn), it has been shown that the local dissolved flux from partial dissolution of eolian dust in surface waters is much greater than that carried by the Rhone and Po rivers into the WMED and Adriatic respectively (GUIEU
et al., 1997; GUERZONI et al., in press). Even where river fluxes appear to be similar in magnitude to
those of dust, estuarine and near-shore removal processes attenuate river fluxes severely, often resulting in little of the riverine signal penetrating into offshore regions. An exception to this is Cd, which forms stable and soluble complexes with chlorides and may also be desorbed from river-borne particulate during estuarine mixing, so that in this case the input very often influences open basin waters (BOYLE et al., 1985; Elbaz-Poulichet et al., 1989).
Beside the undersampling problem, several theoretical problems also hinder our ability to derive atmospheric flux estimates to the ocean from atmospheric suspended loads. It is therefore useful to compare the measured data with the results of GESAMP flux calculations (DUCE, 1991).
Fig. 1.1 and Tab. 1.2 list most of the coastal stations where long (2-11 yrs) time series data are available together with an inventory of mean annual bulk dust fluxes around the Mediterranean. Flux values are deduced from a combination of aerosol suspended loads, dry, wet and bulk deposition samples. Sampling frequency at the various sites ranged from a few days (aerosols) to a few weeks (bulk).
Mean annual deposition mass fluxes of mineral dust for the WMED range from 3-12 g m-2 yr-1, whereas much higher values are found (20-50 g m-2 yr-1) in the Eastern MED (EMED). The measured data are higher than those calculated with the GESAMP model using precipitation rates and a scavenging ratio (SR) of 200. As the SR for the MED is probably higher (GUERZONI et al., 1996), mass fluxes were recalculated using an SR of 500, and are listed in Tab. 1.2. When SR=500 is used, the two estimates agree very well.
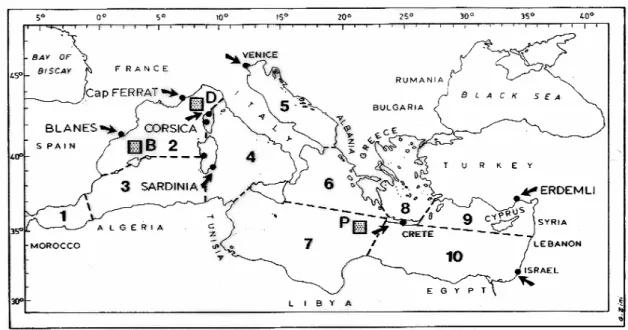
With the data from table 1.2 we can calculate mean values of 8, 12 and 35 g m-2 yr-1 for WMED, CMED and EMED respectively, and use these values to estimate the total annual atmospheric dust flux, which turned out to be ∼40 x 106 tons for the whole Mediterranean basin (Tab. 1.3). This estimate may be compared to total riverine discharge estimates recently revised by LOICZ (MILLIMAN et al., 1995). The sub-areas indicated by GESAMP (Nos. 1 to 10, shown in Fig. 1.1) were used for calculations.
Fig. 1.1 - Arrows indicate the location of sampling sites for which time series of atmospheric data are available. Squares: sediment trap locations (B=Balear; D=Dyfamed; P=Paleoflux). Division in sub-areas 1-10 according to UNEP (1984) for budget calculations.
Tab. 1.2 - Mean annual (and range) atmospheric mass fluxes (g m-2) measured at various coastal sites (refer to Fig.1.1 for site locations). Mean fluxes for three sub-basins calculated by averaging Spain, SE France, Sardinia and Corsica for WMED, Corsica, NE Italy and Crete for CMED, and Crete and Israel for EMED. Estimates from GESAMP model (DUCE, 1991) calculated with scavenging ratio values of 200 and 500 respectively.
_____________________________________________________________________
site flux sub-basin mean GESAMP
g m-2 g m-2 SR=200(500) _____________________________________________________________________ Spaina 5(1-11) SE Franceb 4 (2-11) Sardiniac 8 (2-12) WMED 8 3.4 (8) Corsicad 12 (4-25) NE Italye 3 (2-6) CMED 12 7(18) Cretef 21 (6-46) Israelg 50 (36-72) EMED 35 14 (35) _____________________________________________________________________ (a) CARRATALA et al. (1996); RODA et al. (1993); (b) GUEIU et al. (1997); (c) GUERZONI et
al. (1997); LE BOLLOCH and GUERZONI (1995); (d) LOŸE-PILOT et al. (1996); BERGAMETTI et al. (1989); (e) GUERZONI et al. (in press); ROSSINI and GUERZONI (1996); (f) NIHLEN and
MATTSSON (1989); PYE (1992); (g) HERUT and KROM (1996).
Table 1.3 - Comparison of riverine discharge (R) and atmospheric (A) input of insoluble particles to Mediterranean Sea. Data on riverine discharge are from MILLIMAN et al. (1995). Atmospheric mass inputs derived from average fluxes in three sub-basins (west to east) of 8-12-35 g m-2 yr-1, respectively (see Tab. 1.2 and text for explanation).
____________________________________________________________
Area mass (106tons)
Sub-basin (106km2) R A %A ____________________________________________________________ WMED 0.84 30 7 19 CMED 0.80 35 10 22 EMED 0.70 10 24 70 Total 2.34 75* 41 35 ____________________________________________________________
(*) if 2/3 of riverine input remains on the continental shelf (< 100 m) then the offshore riverine discharge is reduced to 25 x 106 tons, and the atmospheric contribution increases to ~60%.
1.1.1. Mineralogy
LOŸE-PILOT et al. (1986) and GUERZONI et al. (1997) have shown the relationship between eolian deposition and deep sea sedimentation, and found that the atmosphere contributes on average from 10 to 30% of recent sediments. Here, we highlight differences among sub-basins and the possible role of mineralogy in identifying the sites where the atmospheric input is most important.
The mineralogical signature may be used as an indicator of dust origin. Mineral dust mainly consists of a mixture of silicates (clay minerals, feldspar, quartz) associated with carbonates. The abundance of each of these minerals in dust is highly variable, mainly reflecting the source composition and its
evolution during transport. Several studies have examined specific minerals within the clay to identify source regions. For example, palygorskite has been used as an indicator of dusts of north-west African origin in samples collected over the MED (TOMADIN and LENAZ, 1989; MOLINAROLI and IBBA, 1995; MOLINAROLI, 1996).
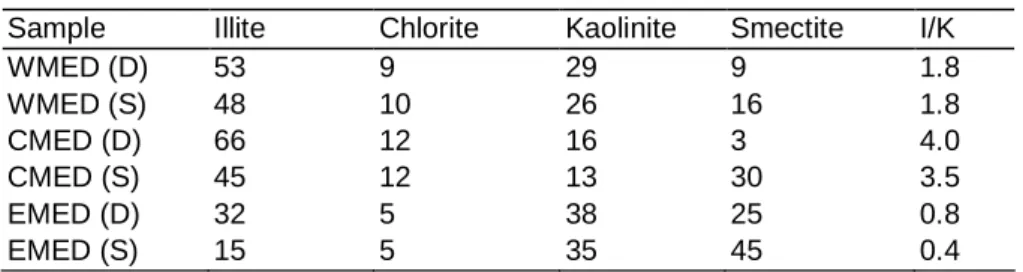
Another approach is to look for mineral associations which are characteristic of dust sources. For example, illite is an ubiquitous clay and is not characteristic of any particular weathering regime, whereas kaolinite, which may also be produced in a variety of weathering conditions, is characteristic of desert weathering regimes. A comparison of the mineralogy of dusts collected throughout the MED shows that illite reaches its highest value in the CMED and its lowest in the EMED (Tab.1.4). In the CMED mixed dusts are observed. Kaolinite is more abundant in dust originating from the eastern compared to western Sahara, the highest concentrations being observed off the Egyptian coast. Smectite is very common in the EMED but not in the WMED. A comparison between dust and sediment has been attempted (CAQUINEAU et al., in press) by considering the difference between illite and kaolinite distributions in the Mediterranean and the illite/kaolinite ratio in the African source dust. The comparison between the I/K ratio in dust and sediments is shown in Tab 1.4. WMED dust transported from the Sahara originating from north-west Africa shows an I/K ratio of 1.8. CAQUINEAU
et al. (in press) observed a range of I/K values from 2.4 to 1.6 in north-west Africa. The similarity of the
I/K ratio between dust and sediment (I/K=1.8) in the WMED indicates that the major contribution to sedimentation in this region is from dust deposition from the western Sahara. This conclusion contradicts data from Table 1.3, which indicates an overwhelming river contribution in this region. The fact that the sediment I/K ratio appears to be set by atmospheric dust probably indicates that a large fraction of the riverborne material is deposited on shelves.
Tab. 1.4 - Average of clay mineral compositions and I/K ratio in Saharan dusts (D) and sediments (S) in MED basin.
Sample Illite Chlorite Kaolinite Smectite I/K
WMED (D) 53 9 29 9 1.8 WMED (S) 48 10 26 16 1.8 CMED (D) 66 12 16 3 4.0 CMED (S) 45 12 13 30 3.5 EMED (D) 32 5 38 25 0.8 EMED (S) 15 5 35 45 0.4
This average was compiled using data from several authors:
CHESTER et al. (1984) (3 samples); MAZZUCCOTELLI et al. (1986) (3 samples); MOLINAROLI (1996) (10 samples) for the WMED.
LENAZ et al. (1988) (5 samples) for the CMED.
CHESTER et al. (1977) (7 samples) GANOR and FONER (1996); (17 samples); TOMADIN and LENAZ (1989) (3 samples) for the south-EMED
TOMADIN (1981) (3 samples) for the (S) WMED
TOMADIN and BORGHINI (1987) (4 samples) for the (S) CMED VENKATARATHNAM and RYAN (1971) (20 samples) for the(S) EMED
The CMED has an average I/K ratio of 4.0 in dust and 3.5 in sediments. This very high ratio shows that the dust is a mixture of Saharan and background dusts (European), since CAQUINEAU et al. (in press) demonstrated that the I/K ratio is always <2.4 in African regions.
The EMED has a low I/K ratio (0.8) in dust and 0.4 in sediments. A relatively low I/K ratio (0.7) is associated with north east African sources by CAQUINEAU et al. (in press). The similarity between dust and sediment values again indicates that the major contribution to sedimentation is from dust deposition, in particular from the eastern Sahara.
1.2. Sediment trap estimates
Many sediment trap studies have been or are being carried out in the MED, e.g. Mediterranean Targeted Projects 1 and 2 (MTP1 and MTP2), but very few of these are useful for studying dust deposition, mainly because of their location relative to river inputs.
For instance, among the traps in the WMED, very different results have been derived from those deployed in the Balearic basin (39°N, 3°E; “B” in F ig. 1.1) with mass fluxes of 50-70 g m-2 yr-1, compared to the DYFAMED site (43°N, 8°E; “D” in Fig . 1.1) where average fluxes are 31-35 g m-2 yr-1. In addition, the relative contribution of the lithogenic fraction is different between the two sites (60% and 25%, respectively). The high flux and lithogenic contribution to the Balearic site is probably related to bottom resuspension and coastal run-off.
The trap used in Paleoflux, MARFLUX (34°N, 20°E; ZI VERI et al., 1996; “P” in Fig. 1.1) is in the best location for dust flux measurement in the EMED, since river discharge is negligible in this region. The total annual average flux recorded in this 3000m deep trap deployed between November 1991 and August 1994, was around 25 g m-2 yr-1, with approximately 60% of lithogenic origin (RUTTEN et al., in press; ZIVERI et al., submitted).
HEUSSNER and MONACO (1996) showed that two flux gradients of total mass are evident in the MED, and that they are related to trophic conditions. A gradient of decreasing flux is seen on the scale of the entire MED basin from west to east, roughly corresponding to the degree of oligotrophy. Within each sub-basin, a second gradient of trophic conditions appears, of decreasing flux from north to south. The inorganic carbon flux is observed to be slightly higher in the EMED, perhaps related to desert-derived carbonate inputs. The above authors conclude that seasonal variations in fluxes in the traps are essentially due to changes in continental input rates to the MED system, i.e., direct deposition of dust through rain and the effect of rain-induced river run-off (HEUSSNER and MONACO, 1996). The sensitivity of traps to river run-off explains why few of these sites can be used for absolute and relative quantification of Saharan dust export flux to the MED. In fact, as far as we are aware, it has been difficult (if not impossible) to distinguish between lithogenic material from dust and that from river discharge in trap samples.
Despite these problems, trap data from the DYFAMED (WMED) and Paleoflux (EMED) sites appear to be promising. At both sites, the lithogenic flux appears to be similar to or smaller than the eolian fluxes
estimated for the region from coastal sites (Tab. 1.2). It is very important that, in future trap work, wherever possible, sites that are suitable for the task of quantifying dust deposition are chosen. The EMED is a particularly important region that needs more coverage of eolian deposition from sediment traps.
1.3. Remote sensing and modelling
In a series of recent papers, DULAC et al. (1996) and MOULIN et al. (1997a), presented an analysis of historical Meteosat data, which monitored dust export from Africa over the Mediterranean on a quasi-daily basis between June 1983 and December 1994. These authors showed that, despite large quasi-daily variability, there were clear seasonal cycles with minima during the dry season (November, December and January). The general pattern is that dust transport begins over the eastern basin in spring and spreads over the western basin in summer.
Tentative estimates of deposition fluxes were made from Meteosat vertically integrated dust concentrations, using simple deposition velocity approaches, on a yearly time scale at the DYFAMED station, and for shorter periods in the western basin (DULAC et al., 1996). A similar paper was published with results for the DYFAMED station in the Ligurian Sea (MOULIN et al., 1997b).The former authors compared Meteosat data with measured aerosols at the Corsica site for a six-month period (1/2/87-31/8/87) and found the average measured flux was 0.024 g m-2 day-1 (equivalent to approximately 9 g m-2 yr-1), whereas Meteosat data yielded a flux of 0.01-0.03 g m-2 day-1 ( 4-11 g m-2 yr-1) for the same period.
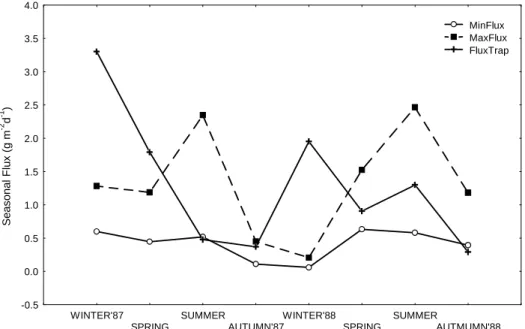
DULAC et al. (1996) also compared Meteosat-derived atmospheric fluxes in 1987 and 1988 with seawater dust fluxes measured in sediment traps at 200 m water depth during the same period at the DYFAMED station. If the periods with sediment trap data are examined, there are results for 364 days over a 2-year period. Seasonal variations are shown in Fig. 1.2. The minimum and maximum Meteosat-derived fluxes bracket the trap fluxes in summer and autumn 1987 and again between spring and autumn 1988. In both winters (1987 and 1988) the trap flux is greater than the maximum Meteosat estimates.
The Meteosat estimates show a similar range for both years (3.5-10.8 and 3.6-11.0 g m-2 yr-1) while the sediment trap data show distinctly different fluxes (12 and 9 g m-2 yr-1) in the two years. Some of this variability may be due to various short-term hydrological and biological processes that control the downward transport of particulate material in the water column. The susceptibility of trap data to short-term variations is shown in Fig 1.3, showing contemporaneous trap fluxes and Meteosat estimates.
2. Magnitude and fate of atmospheric trace metal inputs
2.1. Trace metal concentrations in air
Aerosols transported to the MED may be considered to consist of anthropogenic-rich “background” materials supplied continuously from Europe, upon which sporadic pulses of Saharan crust-rich dust
S e a s o n a l F lu x ( g m -2 d -1 ) -0.5 0.0 0.5 1.0 1.5 2.0 2.5 3.0 3.5 4.0 WINTER'87 SPRING SUMMER AUTUMN'87 WINTER'88 SPRING SUMMER AUTMUMN'88 MinFlux MaxFlux FluxTrap
Fig. 1.2 - Seasonal Meteosat-derived (min/max) and sediment trap terrigenous fluxes at Dyfamed station, 1987-1988.
Days of average F lu x ( g m -2 d -1 ) -0.02 0.02 0.06 0.10 0.14 0.18 9 9 9 10 10 10 11 10 10 10 10 10 11 10 10 10 20 15 15 15 15 15 10 10 10 10 10 10 10 10 10 10 10 MinAvgFlux MaxAvgFlux FluxAvgTrap
Fig. 1.3 - Time variations (seasonal scale as above) of Meteosat-derived and trap terrigenous fluxes (number of days is integration time of traps).
are superimposed. These two “end-member” aerosols have strikingly different trace metal composition, and this is clear in samples collected on board as well as at coastal stations (see Tab. 2.1).
Tab. 2.1 - Mean trace metal concentrations (conc. units: ng m-3 of air) and EFcrust
values for European anthropogenic-dominated and Saharan crust-dominated particulate aerosol populations collected over Tyrrhenian Sea (n=9, CHESTER et
al.,1984 ) and at Sardinia (n=55, GUERZONI et al., in press).
European anthropogenic-dominated aerosol population (n = 5+48) Saharan crust-dominated aerosol population (n = 4+7)
Concentration EFcrust Concentration EFcrust ship-Sardinia ship-Sardinia ship-Sardinia ship-Sardinia Al 112-210 1.0-1.0 2000-2929 1.0-1.0 Fe 117-84 1.7-8.3 1249-1139 0.9-1.7 Mn 4.3-5.4 3.5-1.5 19-24 0.8-1.1 Cr 1.0-0.5 8.6-3.3 4.9-3.3 2.9-1.1 Ni 1.3-5.3 15-21 3.1-7.3 2.8-4.1 Zn 12-22 120-63 8-28 6-18 Pb 1112 767-550 7-25 46-66 Cd 0.44-017 1219-80 0.31-0.08 96-12
Many studies have documented the airborne concentrations of trace metals over the Mediterranean Sea (DULAC et al., 1987; GUERZONI et al., 1988; BERGAMETTI et al., 1989; CHESTER et al., 1990, 1993; MIGON and CACCIA, 1990; MATEU et al., 1993; MIGON et al., 1993; Sandroni and Migon, 1997). Most metals have a relatively short residence time in the troposphere (between a few days and a few weeks; BERGAMETTI, 1987; BUAT-MÉNARD, 1993). They are not well mixed in the atmosphere and thus aerosols and rainwater are expected to exhibit strong spatial and temporal variability (BUAT-MÉNARD, 1993). However, while seasonal variability is observed in the NW Mediterranean (NICOLAS et al., 1995), spatial variability is rather low for metals such as Al, Cd, Cu, Fe, Pb and Zn, and the annual averages from 7 coastal sampling sites are within the same order of magnitude (Tab. 2.2). (CHESTER
et al., 1990, 1993; GUIEU et al., 1997; GUERZONI et al., 1996; SANDRONI and MIGON, 1997).
Tab. 2.2 - Average trace metal concentrations and EFcrust values for particulate aerosols from a number of Mediterranean Sea sites (conc. units: ng m-3 of air)
Spain1 Corsica2 Sardinia3 Erdemli4 Cap Ferrat5 Vignola6 Conc. EFcrust Conc. EFcrust Conc. EFcrust Conc. EFcrust Conc. EFcrust
Al 398 1 168 1 480 1 680 1 370 1 109 1 Fe 316 1.3 144 1.25 278 0.85 685 1.5 320 1.3 - - Mn 10 2.2 4.3 2.7 7.4 1.3 12.6 1.6 11 262 1.7 1.4 Cr 1.8 3.4 - - 0.51 0.89 10.8 13 2.5 5.6 - - Cu 7.9 29 2.1 18 - - - - 6.2 24 1.9 26 Zn 50 148 l9 133 21 52 19 33 41 130 12 130 Pb 50 837 16 635 14 194 30 294 58 1045 9 550 Cd 0.60 628 0.66 1633 0.30 260 0.19 116 0.60 676 0.11 423
(1) CHESTER et al. (1993); (2) BERGAMETTI et al. (1989); (3) KEYSE (1995), GUERZONI et al. (1996); (4) KUBILAY and SAYDAM (1995); (5) CHESTER et al. (1990); (6) MIGON et al. (1993)
2.2 Metal fluxes (total, dry, wet)
Several authors who have attempted to estimate the atmospheric fluxes of metals to the surface ocean (CHESTER et al., 1989; DULAC et al., 1989; GUIEU et al., 1991; MIGON et al., 1991;
GUERZONI et al., 1993; NICOLAS et al., 1995; MIGON et al., 1997) have pointed out the difficulties encountered in quantifying the different modes of atmospheric inputs, i.e. wet/dry/total and dissolved/particulate. While evaluation of wet inputs, calculated from rainwater concentration and rainfall amount, is generally reliable, that of dry deposition is more problematic. It has been calculated by a number of methods: i) on the basis of experimental cascade impactor data (e.g., BERGAMETTI, 1987; REMOUDAKI, 1990); ii) from theoretical models (e.g., DULAC et al., 1989); and iii) with surrogate surfaces (e.g., DOLSKE and GATZ, 1985; BAEYENS et al., 1990; GUIEU, 1991). Results differ greatly according to methodology. Comparisons between estimates must be interpreted with caution, principally as a result of poor knowledge of elemental mass-size distributions (DULAC et al., 1989; MIGON et al., 1991; BUAT-MÉNARD, 1993). For example, in the NW Mediterranean, DULAC et
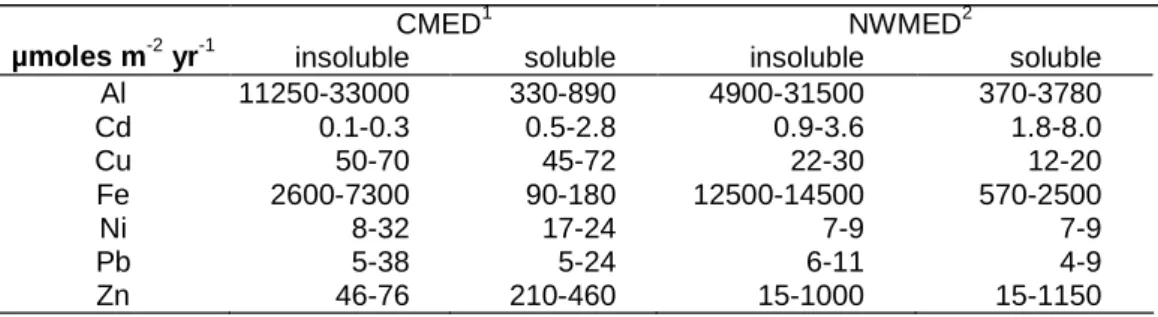
al. (1989) proposed a theoretical dry deposition rate of 0.04 cm s-1 for Pb, while REMOUDAKI (1990) gave an experimental value of 1.9 cm s-1. Dry deposition rates are not well known for submicrometer particles (SLINN, 1983; ARIMOTO and DUCE, 1986), and difficulties increase when particle size exceeds 10 µm: in this case, deposition rates are very high and their estimation becomes very questionable (DUCE et al., 1991). Moreover, phenomena such as fog or dew, which are common in coastal areas, significantly enlarge particles, thereby increasing their deposition rate (BERGAMETTI, 1987). Despite these problems, there is a significant amount of data on trace metal atmospheric fluxes, mainly for the Western and Central MED. They are listed in Tab. 2.3, which shows that the range of fluxes is quite high for some metals (e.g., Al, Cd, Zn), and lower for others (Cu, Pb, Fe, Ni) (GUIEU et al., 1997; GUERZONI et al., in press).
Tab. 2.3 - Range of total atmospheric fluxes (insoluble and soluble fractions), calculated from wet and dry deposition. 1=GUERZONI et al. (in press); 2=GUIEU et al. (1997).
CMED1 NWMED2
µmoles m-2 yr-1 insoluble soluble insoluble soluble Al 11250-33000 330-890 4900-31500 370-3780 Cd 0.1-0.3 0.5-2.8 0.9-3.6 1.8-8.0 Cu 50-70 45-72 22-30 12-20 Fe 2600-7300 90-180 12500-14500 570-2500 Ni 8-32 17-24 7-9 7-9 Pb 5-38 5-24 6-11 4-9 Zn 46-76 210-460 15-1000 15-1150
2.3 Fate of trace metals in seawater
The magnitude of air-to-sea fluxes of trace metals partly depends on their concentrations in the air. However, the fate of an atmospherically-transported trace metal, once deposited at the sea surface, depends on its thermodynamic speciation in seawater, its speciation in the parent aerosol, and the kinetics controlling any speciation change. Aerosol speciation may be assessed by determining the partitioning of trace metals between the following fractions: (i) exchangeable, the most mobile, (ii) oxide/carbonate, intermediate mobility, and (iii) refractory, the least mobile. The speciation of trace
metals in aerosols is a function of the source of the aerosol since some trace metals have very different speciation signatures in anthropogenic-rich and crust-rich “end-member” MED aerosols (CHESTER et al., 1996), and chemical changes occur during passage and transformation in the atmosphere prior to deposition on the sea surface.
Al and Fe are generally refractory in both end-member aerosols, Mn is speciated between all three fractions in both end-member aerosols, but Cu, Zn and Pb switch speciation signatures between the two end-member aerosols, being essentially refractory in crustal aerosols and exchangeable (i.e., mobile) in anthropogenic ones. Aerosols are removed from the air by dry fall-out and wet precipitation scavenging deposition modes.
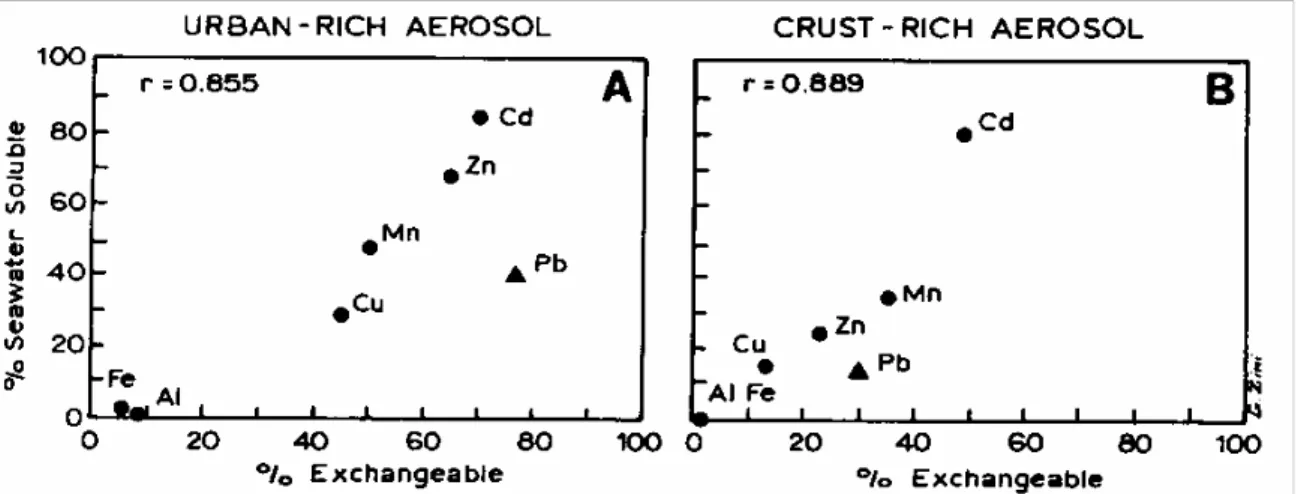
In the dry mode, aerosols reach the sea surface directly and trace metal solubility is constrained by aerosol-sea water reactivity. There is a direct relationship between the extent to which a trace metal is soluble in seawater and the extent to which it is held in the exchangeable fraction of an aerosol (Fig. 2.1). For Al and Fe in both end-member aerosols, <~10% of their total concentrations is in the form of exchangeable associations and both are also relatively insoluble in seawater. However, since both metals are present in relatively high concentrations in aerosols (3-8% by weight), even a solubility of a few percent can release considerable quantities of Al and Fe to seawater in a dissolved form. Mn has between ~20% and ~50% of its total concentration in the exchangeable fraction of each end-member aerosol and is relatively soluble, with ~35%-~50% of the total amount from each phase dissolving. Cu, Zn and Pb have significantly higher solubilities from the anthropogenic-rich than from the crust-rich end-member, due to their different speciation signatures in the two aerosol types. This is important, because it means that the aerosol seawater solubilities of Cu, Zn and Pb are reduced when crust-rich Saharan inputs perturb the anthropogenic-rich background aerosol over the MED.
Fig. 2.1 - Relationship between percentages of total concentrations of trace metals soluble in seawater and in exchangeable associations in a) anthropogenic-dominated and b) crust-dominated aerosols. After CHESTER et al. (1993).
In the wet deposition mode, trace metal solubility is constrained initially by aerosol-rainwater reactivity since some metals are already in solution prior to the deposition of the aerosols on the sea surface.
Solubility is still a function of trace metal speciation in the parent aerosol, as illustrated by the dissolved/particulate speciation of a number of trace metals in rainwater from Western Mediterranean sites (Tab. 2.4). Al and Fe are generally insoluble in all types of rainwater (<20% of total concentrations), and Cd and Mn are relatively soluble (60-90% of total aerosol). Cu, Zn and Pb solubilities vary considerably from one rainwater sample to another and from site to site, e.g. that of Pb varies from ~20% at Sardinia to ~70% at Cap Ferrat.
Tab. 2.4 - Average dissolved/particulate speciation of trace metals in rainwaters from a number of Mediterranean Sea sites; data given as % of total trace metal concentration in dissolved phase.
Cap Ferrat* Tour du Valat* Sardinia# Corsica* Al Fe Mn Ni Co Cu Zn Pb Cd 18 - 60 54 61 82 - 65 92 19 11 63 58 50 71 68 52 75 2 3 - - - - - 21 75 8 13 67 - - 49 76 48 -
* GUIEU et al. (1997); # GUERZONI et al. (1997)
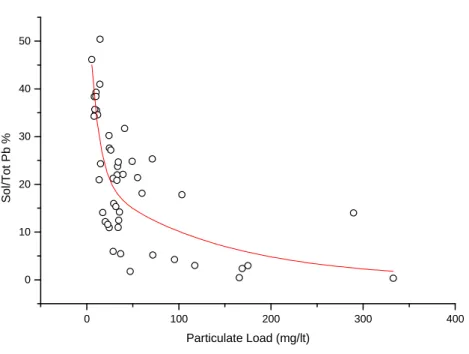
The speciation and solubility of trace metals is strongly affected by rainwater pH. Scavenging of anthropogenic-rich aerosols results in rainwater having pH values of <~4-5. In contrast, the scavenging of Saharan dust, with relatively high carbonate content, yields rainwaters with pH values of >~5. Many adsorption/desorption reactions are pH-dependent, particularly those affecting exchangeable trace metals. This may be illustrated for Pb in a series of rainwaters collected at Cap Ferrat (CHESTER et al., 1990). The most striking feature in the pH vs solubility plot for Pb is the presence of the classical pH adsorption edge (Fig. 2.2), which is typical of adsorption/desorption processes at particulate-water interfaces and has been studied by various authors, in both rain and aerosols (CHESTER et al., 1993; LIM et al., 1994; SPOKES and JICKELLS, 1996). For Pb, this adsorption edge lies in the pH region ~4.8-~5.8. On the more acidic side, ~80% of total Pb is in the soluble form, whereas on the alkaline side only ~10% is soluble. However, some authors note that the low solubility region is defined by a relatively small number of points, reflecting the few cases studied of rain with pH >6 (LIM et al., 1994; SPOKES and JICKELLS, 1996). This observation is important, given that these waters normally contain variable amounts of particulate material and that particle concentrations, grain-size, and physical surface characteristics (scavenged clays or silicate mineral aerosol) may also be important parameters in adsorption models of trace metals in rain (LIM et al., 1994). In fact, aerosol dissolution experiments performed at particle concentrations ranging from 3 to 300 mg l-1 (the usual particle concentrations found in MED rainwater, see Tab.1.1) showed that Cd and Pb have low solubility at high particle concentrations (Fig. 2.3). The solubility of Pb was also found
to increase with increasing EFcrust values and with increasing content of the finest (<1µm) grain-size of the aerosols (GUERZONI et al., in press).
Fig. 2.2. - pH solubility of Pb in Western Mediterranean rainwaters (after CHESTER et al., 1990). 0 100 200 300 400 0 10 20 30 40 50 S o l/ T o t P b % Particulate Load (mg/lt)
Fig. 2.3 - Lead solubility versus particulate load in aerosol dissolution laboratory experiment (from GUERZONI et al., in press).
2.4. Atmospheric versus riverine inputs
Having identified atmospheric input as being important to the ocean, what problems remain in understanding the magnitude and significance of this input mode, with respect to riverine input? Aerosol undersampling problems may be remedied by increased sampling effort. Alternatively, atmospheric fluxes may be calculated from atmospheric transport and deposition models (ERDMAN et
al., 1994), using information on emission source strength (NRIAGU and PACYNA, 1988; GESAMP,
1989; AXENFELD et al., 1992).
We present here two examples of comparison between riverine and atmospheric inputs using measurements made in the WMED and the Adriatic, Central Mediterranean (CMED).
2.4.1. Measurements.
The total atmospheric inputs of several trace elements and potential pollutants are compared with total riverine trace metal inputs for the Adriatic and the NW Mediterranean in Tab. 2.5.
Tab. 2.5 - Comparison between total inputs of atmospheric and riverine origin for Adriatic and NW Mediterranean (all data in ton yr-1). * Al and Fe: ton x 1000; # Adriatic Sea area: 112,000 km2; from ROSSINI and GUERZONI (1996); § NW Mediterranean Sea area: 180,000 Km2, from GUIEU et al. (1997).
tons year-1 Al* Fe* Cd Pb Cu Ni Zn Adriatic# atmosphere Po river 29 86 14 74 18 7 311 151 489 281 148 514 177 935 NW Med.§ atmosphere Rhône & Ebro rivers
97 441 151 232 126 13 579 318 486 505 162 450 12,600 1545
The data indicate that the atmosphere supplies 16-90% of the total input of these elements. When dissolved fluxes are compared (the form most likely to impinge on surface water biogeochemical cycles), the influence of atmospheric input is even more pronounced (Tab. 2.6).
Tab. 2.6 - Comparison between dissolved inputs of atmospheric and riverine origin for Adriatic (area: 112,000 km2) and NW Mediterranean (area: 180,000 Km2). # Adriatic Sea: from ROSSINI and GUERZONI (1996); § NW Mediterranean Sea: from GUIEU et al. (1997).
tons year-1 Al Fe Cd Pb Cu Ni Zn PAH PCB Adriatic# atmosphere Po river 1039 60 573 30 13 4 152 10 332 66 116 148 1560 215 NW Med.§ atmosphere Rhône & Ebro rivers
10 1 16 1 99 2 252 8 189 175 81 115 6813 105 45 15 12 1
For example the atmosphere is 5-50 times more important than rivers for dissolved Zn fluxes and 15 - 30 times more important for Pb fluxes. A similar pattern is seen for Cu. The dramatic difference between total particulate and dissolved fluxes underscores the important role played by speciation of trace elements in rainwater in determining their flux to the surface ocean.
2.4.2. Models.
Only by using models can we extend the same comparison to each of the three basins of the MED (Tab. 2.7). This comparison is meant to show the same approach as the two tables above but is extended to other basins for total fluxes.
Table 2.7 - Comparison of total riverine (R) and atmospheric (A) inputs to Mediterranean Sea (all in tons yr-1). Data on Pb and Zn riverine inputs from UNEP (1984), on atmospheric input from ERDMAN et al. (1994) and GESAMP (1989).
________________________________________________________________________ Area Pb Zn Sub-basin (106km2) R A R A ________________________________________________________________________ Western Med 0.84 2200 3072 9200 1125 Central Med 0.80 1770 2757 10700 809 Eastern Med 0.70 850 1605 4800 590 Total 2.34 4820 7404 24700 2524 % atmosphere 61 9 ________________________________________________________________________
Available estimates of riverine and atmospheric inputs were computed on the basis of average pollutant concentrations and mean water discharges for rivers (UNEP, 1984) and by applying a Eulerian-Lagrangian model for atmospheric transport and deposition (ERDMAN et al., 1994).
Several sources of errors are associated with these estimates. An example is given in Tab. 2.8, showing a comparison between measured and model data for Pb and Zn in the Adriatic (equivalent to WMO area MT5; see ERDMAN et al., 1994) and north-western Mediterranean (equivalent to WMO area MT2; see ERDMAN et al., 1994). In these models, the authors state that the discrepancy between regional mean values for Pb does not exceed 20%, but very often individual data are less reliable. For Zn, the total underestimation of mean values by the models may be 10 times lower, mainly because of underestimation of the emission strength .
These comparisons of modelling results with measurement data for atmospheric deposition should only be considered as approximate, for the following reasons (EMEP, 1994): i) models give grid square (e.g. 150x150 km) average values and measurements give point values, and variations between measurement and model data increase with increasing grid size and decreasing averaging time; ii) as completeness of measurement data should be 75-80% over a rather long period of time (e.g., at least one month) to be used for comparison with modelling results, better spatial and temporal data rage is needed; iii) measurement sites should be representative for the whole grid square
(meteorological conditions, surface characteristics, local pollution sources, etc.); iv) several monitoring sites are needed for a square of 150x150 km and correlation analysis between sites should be applied, taking into account seasonality, mixing, time scale, meteorology, emission and topography; v) measurement and modelling data used for comparison purposes are sometimes made at different times (or even in different years) and the year-to-year variability of meteorological conditions introduces uncertainty into single-year model (or measurement) estimates; vi) emissions used for modelling are rather uncertain and sometimes underestimated, and are mainly based only on annual estimates from major sources without the required temporal and spatial distributions.
Tab. 2.8 - Comparison between atmospheric (measured and modelled) and riverine inputs (measured and estimated).
Region Input Pb tons y-1 Zn tons y-1 Reference
Adriatic atmospheric measured model 311 871 177 246
ROSSINI and GUERZONI (1996) ERDMAN et al. (1994) riverine Po river measured estimated 151 1300 935 7900
ROSSINI and GUERZONI (1996) UNEP (1984) NW Med atmospheric measured model 579 999 12600 337 GUIEU et al. (1997) ERDMAN et al. (1994) riverine
Rhône & Ebro measured estimated 318 800 1545 2400 GUIEU et al. (1997) UNEP (1984)
It may be seen that atmospheric data are in agreement within a factor of 2-3, whereas huge differences are evident for riverine inputs. Some of these differences are due to the reduction in run-off and discharge over the last 10-20 years, not always accounted for in the models. Furthermore, riverine model data are derived from run-off estimates and contain few real measurements, therefore providing only an order-of-magnitude estimate of the elemental input for the MED basin. In addition, the differences between models and measured data may be due to the behaviour of elements in estuarine areas. The chemical behaviour of elements in this zone is very difficult to generalise. For some elements there is removal from the water column in the estuarine zone while for others there is no effect. In some cases (e.g. Cd), there is addition of the element to the dissolved phase as a result of the competitive desorption of Cd bound to the surface of suspended particulate material by seawater ions. While the behaviour of a particular element can be characterised in a particular estuary, different physico-chemical regimes (e.g. pH, ionic strength, presence of dissolved organic matter, etc.) in a different estuary can lead to different behaviour in the mixing zone.
2.5. Case studies.
2.5.1. The atmospheric “signature” in seawater. For some reactive trace elements including Al, Mn and
the shapes of dissolved oceanic profiles with surface water concentration maxima suggest that atmospheric input is of major importance. For other elements which are not so rapidly removed from seawater by scavenging processes, internal biogeochemical cycles mask such input signals.
Al and Fe. It has been shown above that Al and Fe have only relatively low solubilities from aerosols
but, since they are present in large concentrations, even low solubility can deliver significant quantities to the dissolved seawater pool from dust pulses.
The effect of dust deposition of Al on MED surface waters is dramatically visible in its effect on the surface water concentrations. The extremely high concentration of this element in crustal materials (8.1%; TAYLOR, 1964), and its low concentration in seawater makes it a particularly good tracer of the partial dissolution of eolian dust in MED surface waters. In fact, as a result of biological and convective transport, the deep waters of the MED have the highest concentrations of dissolved Al of any basin in the world, consistent with their receiving the greatest rate of deposition of eolian material. The effect that this has on the Al budget has been recognised by several workers (HYDES et al., 1988; MEASURES and EDMOND, 1988; CHOU and WOLLAST, 1997), the latter indicating that the partial deposition of eolian dust in the WMED was responsible for some 20 times as much input of Al as that supplied by rivers. That the eolian input is basin-wide is shown by the progressive build-up of Al from west to east along the advective flow path of the incoming Atlantic surface water (Fig. 2.4).
0 50 100 150 0 0.5 1 1.5 2 2.5 3 3.5 4 -10 -5 0 5 10 15 20 25 30
Mediterranean surface waters
Al, nM Fe, nM
Longitude E
W
Gibraltar Sicily Crete
In this figure, all post-1980 surface water Al values in the open Mediterranean are plotted as a function of longitude. Data from the region of the Gulf of Lions are excluded, to eliminate the local influence of the Rhone discharge. In addition, early Corsican nearshore data are excluded, to eliminate local artifacts.
The data distribution is quite distinctive in that there is an unmistakable increase in Al concentrations from 9-13 nM at the Strait of Gibraltar (6 W) to ~75 nM at 26 E in the eastern basin. The anomalously high value at ~5 E (100 nM) results from elevated deep water mixing into the surface waters in December 1988, during a convection episode in the Western Mediterranean Deep Water formation region. The general trend indicates something of the order of a 60-nM Al enrichment of inflowing Atlantic surface waters during their eastward transit from the Strait of Gibraltar to the eastern basin. The magnitude of this Al enrichment may be compared with estimates of atmospheric deposition to the region. GUIEU et al. (1997), using atmospheric data from coastal collection sites, estimated an annual deposition of some 0.38 to 3.8 mmoles of dissolved Al m-2 to the surface waters of the north-west Mediterranean. Such an input into a 50-m mixed layer, over the advective flow path of the Atlantic water, could easily raise Al concentrations in inflowing surface water to the values seen in the eastern basin over the time-scales of surface water renewal in the Mediterranean (1-10 years).
While the impact of dust is readily observed and is quantified in the Al signal, its effect on Fe concentrations is more difficult to quantify. The largest problem is the small data base of reliable measurements for Fe in the Mediterranean. Fig. 2.4 plots all the surface water dissolved Fe data of MORLEY et al. (1997) available in the EROS-2000 data base which appear to be oceanographically consistent. The data of MORLEY et al. (1997) show a wide range of concentrations from 0.11 nM in the Strait of Gibraltar to 2.83 nM south of the Gulf of Lions. However, unlike the Al, there is no clear geographic trend associated with these values. Nevertheless, it may be stated that, on the basis of this data set, Fe levels are generally above 1 nM within the Mediterranean. It therefore seems reasonable to conclude that Fe cannot be considered as limiting factor to phytoplankton. This appears to be probable merely on the basis of available nutrients. Since the surface Mediterranean is low in nutrients, Fe demand is similarly low. Using Fe limiting conditions and assuming a C:N ratio of 6.7, 0.5 nM of Fe (at the low end of the observed amount of Fe in 1-L of seawater) is capable of removing 7.5 µM of N from surface waters, an extremely large amount of N to be found in 1-L of seawater in this nutrient-impoverished sea.
In summary, dust input to the Mediterranean clearly affects surface water trace element budgets, and this is most visible for Al for which a large data base of modern observations exists. Although surface water Fe concentrations in the Mediterranean also appear elevated, the small size and geographical extent of the existing data base precludes direct association of these values with dust deposition events. It is unlikely that dust deposition to the surface Mediterranean would spur primary production through either the relief of Fe-limiting conditions or the provision of a bioactively reduced Fe species.
2.5.2. Pb in atmosphere and seawater. The EROS 2000 data base on lead concentrations over the
period 1989-1993 gave an average of 100pM in surface waters and 80 pM in bottom waters. A mass balance for the WMED has been computed (MILLIMAN and MARTIN, 1997), and the output/input ratio for lead in the whole basin is 0.8, with a residence time of 5.2 years (water residence time being ~15 years). A tentative budget of dissolved lead in the WMED (WOLLAST, pers. comm.) indicates an accumulation in the water of 440 tons yr-1 for the period 1970-1985, related to the constant increment in consumption of leaded gasoline in that period.
In contrast, a recent paper (MIGON and NICOLAS, 1998) shows a reduction (over the period 1987-1995) of atmospheric fluxes of dissolved Pb from 3.5 to 1.5 mg m-2 yr-1, and of surface water concentrations in the WMED (central Ligurian Sea) from 300 to 120 pM. The amount of Pb in inflowing rivers has probably decreased in a similar way to the atmospheric input. However: i) the natural Pb component is probably higher in rivers than in the atmosphere, because of soil erosion; ii) a previous study (MIGON, 1993) showed that riverine Pb fluxes are far lower than atmospheric ones, and the loss of atmospheric Pb was estimated at >90%; iii) Pb dissolved in fresh water tends to precipitate and settle close to the river mouth (SHARP and NARDI, 1987; WINDOM et al., 1988; DORTEN et al., 1991), which lowers the role of the riverine contribution to offshore marine Pb concentrations. These results confirm the importance of the atmosphere in delivering Pb to surface waters and in controlling its concentration. Figure 2.5 illustrates the temporal evolution of dissolved Pb concentrations in surface waters (upper 100 m), together with mean atmospheric fluxes. The two curves have the same shape, which a posteriori indicates that the introduction of automotive Pb into the marine environment essentially occurs through the atmospheric pathway.
Fig. 2.5 - Pb atmospheric flux and mean marine Pb concentrations (0-100 m) (from MIGON and NICOLAS, 1998).
3. Atmospheric input of nutrients: estimates and impacts
The importance of the atmosphere as a source of nutrients, especially nitrogen, for terrestrial ecosystems was recognised as a by-product of studies of the impact of acid rain in the early 1980s. At the end of that decade, atmospheric nitrogen deposition to marine systems began to be investigated and its importance for the global ocean was assessed (DUCE, 1986). For example, it has been noted that the atmospheric input of nitrogen may be partly responsible for the eutrophication of estuarine or coastal waters and the appearance of harmful algal blooms, by either direct input or through the watershed (FISHER et al., 1988; MALLIN et al., 1993; PAERL et al.,1993).
Despite early observations of P limitation (FIALA et al., 1976; BERLAND et al., 1973, 1980), recent works suggest that MED surface waters are nitrogen-limited (ANDERSEN and NIVAL, 1988; OWENS et
al., 1989). In fact, there is growing evidence that the EMED is phosphorus-limited (KROM et al.,1991)
and that the WMED is probably N-limited (RAIMBAULT and COSTE, 1990; THINGSTAD and RASSOULZADEGAN, 1995), or that limitation shifts from nitrogen to phosphorus and vice versa depending on the period of the year (FIALA et al., 1976, DOLAN et al., 1995) or the area considered (WOODWARD and OWENS, 1989). The unique high levels of N/P ratios in the MED (20/27) compared with other open ocean averages (15) may reflect this situation, and are probably evidence of P limitation.
3.1. Atmospheric inputs of nitrogen to the Mediterranean
While there are many natural sources of fixed nitrogen to the atmosphere - NO3 from soils and NH3 from
wetlands - in the northern hemisphere the main sources are anthropogenic (NOx from industrial
combustion and vehicle traffic, HNO3 from vehicle traffic, NH3 emissions from intensive farming). The
most abundant data are for inorganic wet deposition. Data for the WMED and EMED are listed in Table 3.1.
Tab. 3.1 - Dissolved inorganic nitrogen (DIN) wet deposition (a: LOŸE-PILOT et al., 1990a; b: MIGON et
al., 1989; c: LOŸE-PILOT et al., 1990b; d: GUERZONI et al., 1993; e: LE BOLLOCH and GUERZONI,
1995; f: HERUT and KROM, 1996).
Field data Best estimates
in sub-basins
Studied site Period Range
(annual basis)
NWMED WMED EMED Mediterranean
µmol m-2 d-1 µmol m-2 d-1 µmol m-2 d-1 1010mol yr-1
French coast - Camarguea feb 88/jul 89 73
French coast - Cap Ferratb 86/87 119/142 2,5 / 7,5
Corsica - Bavellac 84/86 126 / 150 100 80 50 50 / 80 4,6 / 7,3
Sardinia - C.Carbonarad 91/94 47 Sardinia - Torregrandee 92/93 41 / 56
Atmospheric input of wet inorganic nitrogen. The average wet dissolved inorganic nitrogen (DIN) flux to
the north-west Mediterranean of ~100 µmol Nm-2 d-1 (LOŸE-PILOT et al., 1990a) is somewhat higher than that to the south-east Mediterranean, which is ~60 µmol Nm-2 d-1 (HERUT and KROM, 1996), the value for the whole Mediterranean being between 50 and 80 µmol Nm-2 d-1 (LOŸE-PILOT et al., 1990a). Nitrate and ammonium contribute almost equally to the DIN, while nitrite is normally less than 3%.
Atmospheric input of dry inorganic nitrogen. Dry deposition of inorganic nitrogen includes gas and
particulate deposition. Only annual average data are available for atmospheric particulate inorganic nitrogen species. Values in the NWMED are 1.71 and 0.85 µg m-3 for NO3
and NH4+, respectively
(KLEIN, 1998), and in the EMED 1.51 and 0.97 µg m-3 for NO3
and NH4 +
(MIHALOPOULOS et al., 1997). These coastal values are in good agreement with the mean concentrations of 1.45 and 1.22 µg m-3 for NO3
and NH4 +
obtained by MEDINETS (1996) from shipboard sampling over the whole Mediterranean. The reported values for particulate dry deposition depend on the deposition velocities
chosen for NO3- and NH4+, the best estimate for the NWMED being 25 µmol N m-2 d-1 (KLEIN, 1998).
Gas concentration measurements are very scarce, especially for NH3 which is assumed to be negligible
regarding N deposition to the Mediterranean. The few HNO3gas measurements are from urban sites.
Fig. 2.6 shows the partitions of various inorganic species and forms in the atmospheric deposition of nitrogen for the NWMED.
NH4 + w NH4+ dp NH3 dg HNO3 dg NO3 d p NO3- w
Fig. 2.6 - Relative importance of atmospheric inputs of different N species to NW Mediterranean; w=wet dp=dry particulate, dg=dry gaseous.
Total inorganic nitrogen deposition (Table 3.2). If only particulate dry species are taken into account,
nitrogen dry deposition represents 25-33% of wet deposition in the north-west basin (LOŸE-PILOT et
al., 1990, KLEIN, 1998); taking HNO3gas into consideration would increase the influence of dry
deposition to equal wet deposition in coastal urbanised zones. Dry deposition equal to half that of wet deposition seems to be a realistic assessment for the open sea. Results are summarised in Table 3.2, which also lists data from the UNEP Mediterranean Pollution (MED POL) Project (computed from models) for 1991 (ERDMAN et al., 1994; UNEP, 1984). Total inorganic nitrogen deposition varies between 214 µmol N m-2 d-1 for the Adriatic to about 48 µmol N m-2 d-1 for the Central Mediterranean (UNEP zone VII) (ERDMAN et al., 1994), agreeing well with the previously estimated values of 105 µmol N m-2 d-1 for the WMED and 65 µmol N m-2 d-1 for the EMED (LOŸE-PILOT et al., 1990b).
Distance from the source and climatological conditions appear to be the major factors which control nitrogen inputs. If the DIN flux to the southern oceans, ~ 6 µmol N m-2 d-1, represents the natural background level, then 90% of the total DIN flux into the Mediterranean is of anthropogenic origin.
Tab. 3.2 -Total nitrogen deposition (a: LOŸE-PILOT et al., 1993, b: KLEIN, 1998, c: LOŸE-PILOT, 1998, d: ERDMAN et al., 1994); p = particulate, g = gaseous species.
Best estimates
NWMED WMED EMED Mediterranean
µmol m-2 d-1 µmol m-2 d-1 µmol m-2 d-1 µmol m-2 d-1 1010mol yr-1 Field data
dryp= 1/3 weta,b 125 105 65 65 / 105 5,6 / 9,0 dryp+g= 1/2 wetc 150 120 75 75 / 120 6,4 / 10,2
Model
(UNEP MAP 94)d 117 107 80 89 7,6 without Adriatic:
69
Organic nitrogen. The importance of organic nitrogen in total atmospheric nitrogen deposition has
recently been re-evaluated; it may represent half of the input of inorganic forms on a regional scale and be equal to them for global ocean (CORNELL et al., 1995; DUCE et al., 1997). The source of organic nitrogen is not known, but CORNELL et al. (1995) believe that a large fraction of it is anthropogenic. The few measurements of organic nitrogen content in the Mediterranean atmosphere (SPITZY et al., 1990; LOŸE-PILOT et al., 1992) indicate that total amino acid concentrations in aerosols and rainwater are small (<5%) relative to inorganic species. It is clear that further studies are needed to assess the content, speciation and bioavailability of organic nitrogen in general and in the Mediterranean atmosphere in particular.
3.1.1. Atmospheric versus riverine inputs of nitrogen in the Mediterranean. The DIN atmospheric input to
the NWMED is in the same range as the Rhone input, which is the major water and nutrient riverine output to the WMED. If the entire WMED is considered (LOŸE-PILOT et al., 1990b), then atmospheric
input - derived from field data - is probably higher than that of rivers. Atmospheric input of N (1084x103 tons yr-1) is equal to the riverine input (1000 x103 tons yr-1) for the whole Mediterranean according to UNEP/WMO estimations (BASHKIN et al., 1997), the atmospheric input being predominant in the southern zones. If the fraction of riverine input which is derived from the atmosphere is taken into account, the atmospheric input is ∼60% of the total continental supply of nitrogen to the Mediterranean (BASHKIN et al., 1997).
Due to the fact that riverine nutrients are removed by biological activity in estuarine and proximal coastal zones, atmospheric input is probably the main source of nitrogen for the open sea, even in the northern zones of the Mediterranean.
3.1.2. Impact of atmospheric input of nitrogen on primary production. Atmospheric input of N contributes
to new production (DUGDALE and GOERING, 1967; EPPLEY and PETTERSON, 1979; DUCE, 1986), which is the primary production fuelled by nutrients originating outside the photic zone, as opposed to production fuelled by recycled nutrients from within the photic zone. Assuming that the assimilation of nitrogen is in the Redfield ratio to carbon (16/106), then the atmospheric input of nitrogen may account for new production of about 3.8 g C m-2 y-1 in the NWMED, 2.5 g C m-2 y-1 in the SWMED, and 2.1 g C m-2 y-1 in the SEMED.
For coastal zones such as the Gulf of Lions, where total primary production is as high as 130-180 g C m-2 y-1 (MOREL et al., 1990; TUSSEAU and MOUCHEL, 1995) and new production is approximately one-third of the total, then the atmospheric input of nitrogen represents only about 6-10% of new production, while the Rhône river provides ∼50%. However, in oligotrophic zones in the WMED, primary production is about 50 g C m-2 y-1 and new production is as low as 5 g C m-2.yr-1. In this case, the atmospheric N input of 2.5-3 g C m-2 y-1 represents up to 60% of new production. This contribution is somewhat lower in the oligotrophic zones of the EMED, where new production has recently been re-estimated at 16.7 g C m-2 y-1 (KROM et al., 1991). In this case, the atmospheric input of nitrogen, 2.1 g C m-2 y-1, represents ~12% new production.
3.2. Atmospheric input of phosphorus
The atmospheric input of phosphorus has received less attention than that of N, as it is assumed to be less important. The atmospheric input of dissolved inorganic phosphorus to Cap Ferrat is estimated at 1.4 µmol m-2 d-1 and to be between 0.4 and 1.4 µmol m-2 d-1 for the NWMED (MIGON et al., 1989). Total inorganic phosphorus deposition to the WMED was determined to be 3.5 µmol m-2 d-1 from 3 years of samples collected in Corsica. Crustal material made up 40% of this flux, and the dissolved fraction was estimated to be between one- and two-thirds of the total (BERGAMETTI et al., 1992).
The wet deposition of total inorganic phosphorus to the SEMED, estimated from 2 years of measurements on the northern coast of Israel was 0.6 µmol m-2 d-1 and dry deposition was 1.2 µmol m-2 d-1 (HERUT and KROM, 1996), giving a total rate of 1.8 µmol m-2 d-1.