HAL Id: insu-01396445
https://hal-insu.archives-ouvertes.fr/insu-01396445v2
Submitted on 13 Dec 2016
HAL is a multi-disciplinary open access
archive for the deposit and dissemination of
sci-entific research documents, whether they are
pub-lished or not. The documents may come from
teaching and research institutions in France or
abroad, or from public or private research centers.
L’archive ouverte pluridisciplinaire HAL, est
destinée au dépôt et à la diffusion de documents
scientifiques de niveau recherche, publiés ou non,
émanant des établissements d’enseignement et de
recherche français ou étrangers, des laboratoires
publics ou privés.
Methodology-selection by Fuzzy Analytic Hierarchy
Process for Studying Net Pays
Pedram Masoudi, Mohammad Ataei, Tahar Aïfa, Hossein Memarian
To cite this version:
Pedram Masoudi, Mohammad Ataei, Tahar Aïfa, Hossein Memarian. Methodology-selection by Fuzzy
Analytic Hierarchy Process for Studying Net Pays. The Fourth International Mine and Mining
In-dustries Congress & The Sixth Iranian Mining Engineering Conference, Nov 2016, Téhéran, Iran. 7
p. �insu-01396445v2�
Methodology-selection by Fuzzy Analytic
Hierarchy Process for Studying Net Pays
Pedram Masoudi
1,3, Mohammad Ataei
2, Tahar Aïfa
1*, Hossein Memarian
3*1* : Géosciences-Rennes, CNRS UMR6118, Université de Rennes 1, Bat.15, Campus de Beaulieu, 35042 Rennes cedex, France, [email protected] and [email protected]
2 : School of Mining, Petroleum and Geophysics Eng., Shahrood Univ. of Technology, Iran. 3 : School of Mining Eng., Univ. of Tehran, Tehran, Iran, [email protected] and [email protected]
Abstract
Net pay intervals are conventionally determined, applying cut-off values on geological well-logs. Recently developed methodologies utilize more complicated algorithms: Bayesian classifier, artificial neural network and Dempster-Shafer theory. The outputs of these methodologies are not completely compatible. It rises this question that which method should be recommended in each situation: (i) industrial use, (ii) research goal and (iii) general situations.
Fuzzy analytical hierarchy process is used here to compare effectiveness of the four net pay determination methods in each three situations. Six criteria were defined: precision, generalization ability, fuzziness, simplicity of methodological concepts, user-friendly and speed of the algorithm. For the precision and generalization ability, mean squared error of training and generalization data are used, respectively. Mean squared error and speed (inverse of time) of the algorithm are continues variables, and provide quantitative comparison. While qualitative comparison is done for the criteria of simplicity and user-friendly. For the criterion of the fuzziness, a ranking, i.e. categorical variable, is used based on the number of classes that the classifier could provide. The comparison is done based on the results of net pay determination (the four methods) on sandy Burgan and carbonated Mishrif reservoirs, Iranian offshore oil-fields.
The results show that from viewpoint of general situation, Bayesian and Dempster-Shafer-based methods are the best. Artificial neural network and Dempster-Shafer are the most suitable methods for industrial mode, and Bayesian and artificial neural network are the best methods for research applications. Finally, cut-off methodology is never prioritized.
Keywords: net pay methodologies; fuzzy AHP for net pay; purposes of net pay determination; solution-selection for net pays; intelligent net pay determination
1.
I
NTRODUCTIONIn cases that there are multiple solutions for a problem, how to select the most optimum methodology is an important question. Recently, novel net pay determination methods have been proposed that let user decide the process of evaluating productive zones by his own. Conventionally, pay zone identification methodologies were based on cut-off approaches, which simply applies two to three cut-offs on petrophysical parameters of shale percent, porosity and water saturation [1, 2 and 3]. However, it is also possible to study productive zones from other perspectives: reservoir engineering [4], probabilistic view of Bayesian classifier [5], using fuzzy aggregation for merging outputs of other net pay identification procedures [6] or by the means of other intelligent methods as Dempster’s rule of combination [7] or Artificial Neural Networks (ANN) [8, 9 and 10].
Resolving a question by multiple approaches might be considered as a repetitive job, e.g. in above literature, net
pay detection is addressed using six different methodologies. However, we believe that multiple approaches can provide options in different conditions. Here, fuzzy Analytic Hierarchy Process (fuzzy AHP) is used as a decision making tool to prioritize introduced methodologies in three cases: general situation, industrial use and research divisions.
AHP is a powerful and well-known process for ranking options/choices due to predefined criteria and goals; meanwhile, considering hierarchy of goals- criteria- options. From managerial viewpoint, AHP provides a link between “human’s thoughts” and “decision making”, through the tunnel of pairwise comparison process. If we use fuzzy numbers instead of crisp numbers for comparing options or criteria, this methodology is called fuzzy AHP. Using fuzzy numbers means that the process of pairwise comparison contains uncertainty. In another word, there is a vagueness or gloominess in our comparison procedure. Here, the aim of using AHP is to prioritize different net pay methodologies due to multiple goals (research, industry and general usage of methods).
2.
W
HAT ISN
ETP
AY?
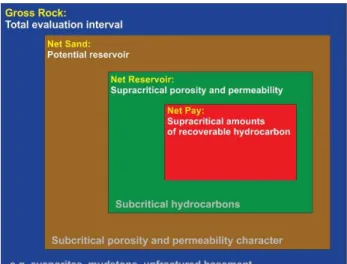
In general, net pay zone is a vague concept. It could be simply defined by words as “hydrocarbon producing horizon”; however, a mathematical and technical definition requires more considerations. In order to call a drilled interval a producing zone, it should firstly have a proper lithology, capable in storing and conducting hydrocarbon. Secondly, this reservoir rock should be hydrocarbon-bearing, i.e. containing some minimum amount of hydrocarbon. Conventionally, it has been done by applying some cut-offs on petrophysical properties: shale percentage, porosity and water saturation.
A general cut-off-based approach in determining net pays in conventional reservoirs consists of three stages. At first, clean reservoir (net sand) have to be distinguished from the gross rock. It could be simply done by setting a constraint on log of shale volume. Range of cut-off of shale volume varies from 30% to 50% for all conventional reservoirs. Then, porous media –capacity for storage- have to be specified within net sand. For sandy reservoirs, this range is between 6% and 8%, and for carbonates it varies from 4% to 5%. Finally, within net sand, selecting those intervals that contain water saturation below cut-off value (usually 50% to 60%) is the most appropriate place for oil production [1 and 2]. The graphical definition is presented in Figure 1.
Figure 1. Classical definition of nets; modified following [2].
Besides conventional cut-off-based method, recent works have defined net pays by well-test results, which provide less analytical and more data-driven-based method, i.e. Bayesian, ANN and fuzzy logic [9 and 11]. In a more precise language, net pays should be able in producing oil or gas during reservoir’s life span, with the highest possible recovery rate.
3.
M
ETHODOLOGYA. AHP in Simple Language
Analytic Hierarchy Process (AHP) is a decision making technique that organizes human’s thoughts and psyches by comparing alternatives due to criteria, and comparing
criteria due to goals. In this methodology, goals are described at first, then, few criteria should be defined due to predefined goals. In some cases, sub-criteria should be defined as well. Finally, alternatives are listed at the bottom of graph (Figure 2) [12 and 13]. Description of AHP method is well presented in [13 and 14]. Here, we are going to compare four net pay determination methodologies, i.e. Cut-off, Bayesian, ANN and Dempster-Shafer Theory (DST), due to six criteria under each specific goal.
Figure 2. AHP structure, goals at top, alternatives at bottom, and criteria as mid-layer between goals and alternatives.
After constructing the graph, comparison matrices should be constructed by the user, based on his personal judgment or decision of a team, i.e. pairwise comparison should be carried out at each level (alternatives and criteria), separately. Then, comparison matrices of each level should be constructed. For each node of criterion, we will have one squared matrix with size of four. Four is the number of alternatives that will be compared to each other due to each criterion. For comparing criteria due to goals, three matrices (with size of six by six) should be constructed too. Six is the number of criteria, and three is the number of goals. Each matrix is for pairwise comparison between alternatives due to a specific criterion or between criteria due to a goal. When a matrix is for comparing alternatives due to a criterion, the element aij is
the degree of relative preference of ith alternative (i.e. A i)
to jth alternative (i.e. A
j). The same concept is for
comparison matrix of criteria due to goals.
For constructing comparison matrix, usually, an odd digit (1, 3, 5, 7 and 9) is assigned to each element, expressing the relative degree of importance, e.g. 1 means similarity (there is no priority); 3 means one of them is a little more important than the other alternative; 5 means more important; 7 means much higher preference; and 9 has the meaning of extremely more important or absolute preference. It should be mentioned that comparison is not limited to odd numbers at all. Even digits could be used as well.
Pairwise comparison or assigning digits to the matrix elements could be done by an expert, a group of experts, measurement or a mixture of both (like here). But four principles should be considered in constructing comparison matrices [12 and 13]:
• Principle 1- Reciprocal Condition: if Ai (i.e. ith
alternative) is n times more important than Aj; then, Aj is
1/n times less important than Ai. Because of this property,
comparison matrix is a “reciprocal matrix”.
• Principle 2- Homogeneity: relative importance of Ai to Aj should be limited. In mathematical language, aij
could not be zero or infinite.
• Principle 3- Dependency: each element is linearly dependent on higher-level elements, and this dependency could be continuous upward towards the goal.
• Principle 4- Expectations: when a modification occurs in the structure of the graph, evaluation process should be redone.
In addition to above mentioned principles, another logical assumption has to be considered in constructing a consistent matrix. This principle is based on hypothetical syllogism, i.e. if the statement Q could be inferred from the statement P (i.e. P => Q); also if the statement T could be inferred from the statement Q (i.e. Q => T); therefore the statement T could be inferred from the statement P itself (i.e. P => T). This is an important reasoning in classical logic. In the literature, this property is called “cardinal” consistency property [15]: when Ai is aij times more
important than Aj; and if Aj is ajk times more important than
Ak; then, Ak is aij × ajk times more important than Ai.
In the next step, weights of each criterion or alternative should be calculated by one of (logarithmic) least square method, eigenvectors or approximate methods. The final stage is calculating the final score by summing multiplication of corresponding weights in the hierarchy, i.e. multiplying weight of each alternative due to each criterion by the weight of corresponding criterion, and summing all multiplications to come up to the final score. Score the higher, the more optimum alternative to choose [12 and 16].
B. Why Fuzzy AHP?
How much are we sure about assigned numbers in pairwise comparison? In another word, is it precise enough fixing each element to a specific and fixed digit? In fact, because we are not sure about a single number (vagueness and inaccuracy in weights and rating), it is better to assign an interval or a fuzzy number (i.e. using fuzzy AHP or fuzzy TOPSIS) in an advanced mode [17].
Saaty (2003) has not approved using fuzzy numbers in the AHP process. His reasoning is due to fuzzy nature of the AHP, i.e. priorities have fuzzy meaning themselves [16]. In spite of critics of Saaty about fuzzy-AHP, its application is growing (see below abstracted literature review) in different domains (place prioritizing, project selection, e-commerce, etc.). In fact, till there is no prove for using fuzzy AHP instead of AHP or vice-versa, both methods are valid. Authors support using fuzzy AHP in cases of vagueness in rating due to [17].
Fuzzy AHP has been developed in economic and business researches: customer requirements [18], place prioritizing [19], project selection [20], e-commerce [21],
comparing simple AHP and fuzzy AHP [17 and 22]. In newer publications, the use of fuzzy AHP is reported in textile industry [23], and also in the project of Turkish national identity card [24].
Fuzzy number is a fuzzy set on real numbers that should follow three properties: 1- must be a normal fuzzy set, 2- Its alpha cut must be a closed interval, 3- The support of the fuzzy set must be bounded [25]. One of the mostly used fuzzy numbers in engineering applications is triangular fuzzy number that corresponding non-fuzzy number is at its height, and two specific lower and upper bounds have also to be fixed. Triangular fuzzy number of [1/2,2,3] is an example of asymmetric fuzzy number, corresponding to none-fuzzy number of 2 (Figure 3).
Figure 3. Triangular fuzzy number of [1/2,2,3]
Defining fuzzy numbers is mostly based on engineering judgment. In extreme case that there is absolute certainty, fuzzy numbers would have no range, therefore would be exactly the same as simple crisp numbers. But in cases that there are large uncertainties, range of fuzzy numbers could be defined larger, subsequently large overlaps with neighbouring numbers, indicating uncertain space. In this work, defined fuzzy numbers are shown in Table I and Figure 4. They have both the following properties: 1- inverse of fuzzy number one is equal to itself, like in real numbers, 2- all integer fuzzy numbers are symmetric, except fuzzy number one. All other parts of the algorithm of Fuzzy AHP are the same as conventional AHP [26].
TABLE I.NUMBERS AND THEIR REVERSE IN THE FORM OF FUZZY NUMBERS (TRIANGULAR).[L,M,U] SHOWS TRIANGULAR FUZZY NUMBER
OF “M” WHEN “L” IS LOWER LIMIT AND “U” IS UPPER LIMIT. Integer non-fuzzy Number Fuzzy Number Inverse of Integer Non-fuzzy Number Fuzzy Number 1 [1/2,1,2] 2 [1,2,3] 1/2 [1/3,1/2,1] 3 [2,3,4] 1/3 [1/4,1/3,1/2] 4 [3,4,5] 1/4 [1/5,1/4,1/3] 5 [4,5,6] 1/5 [1/6,1/5,1/4] 6 [5,6,7] 1/6 [1/7,1/6,1/5] 7 [6,7,8] 1/7 [1/8,1/7,1/6] 8 [7,8,9] 1/8 [1/9,1/8,1/7] 9 [8,9,9] 1/9 [1/9,1/9,1/8]
FIGURE 4.TRIANGULAR FUZZY NUMBERS OF TABLE I, USED IN THIS WORK.
C. Inconsistency Rate (IR)
There is an algorithm for checking consistency of comparison matrices. In this method, Inconsistency Index (II) can easily be calculated, after finding an eigenvector, corresponding to the largest eigenvalue, using relation 1. Then dividing it by Random Inconsistency Index (RII) (relation 2), we will reach the Inconsistency Rate (IR) through relation 3. It is suggested in the literature that 0.1 is an appropriate cut-off for IR [12]. There are some other approximate methods for calculatingλMax without using eigenvector that readers are referred to the literature [12 and 13].
1
−
−
n
n
λ
=
II
Max (1)1
−
−
n
n
λ
=
RII
Max (2) RII II = IR (3)Where n is dimension of matrix;
λ
Max is maximum eigenvalue;Max
λ is average of expected value of
λ
Max[27].4.
P
AIRWISEC
OMPARISOND. Comparing Alternatives
Based on six decision criteria, four net pay detection methods are going to be compared in carbonate reservoir rock of Mishrif and sandy Burgan reservoir (both in Iran). The six decision criteria are: precision, generalization ability, fuzziness, simplicity of methodology (science concepts), user-friendly and speed of the algorithm (Table II). Comparison, resulted in six reciprocal matrices (size of four by four), using the previously introduced network structure of AHP.
Based on Table II, the four methods were compared from perspective of each criterion, and the IR was calculated for each matrix. When IR is lower than 0.10, the matrix is assumed to be consistent [12 and 28]; otherwise, the matrix is reconstructed. Then, corresponding weights are calculated, and presented at the bottom of each matrix (Tables III).
TABLE II.COMPARISON OF METHODS, APPLIED ON TWO RESERVOIRS. ONE OF THEM IS CARBONATE RESERVOIR OF MISHRIF, THE OTHER IS
SANDY BURGAN RESERVOIR [8].
P re ci si o n G en er a li za ti o n F u zz in es s S im p li ci ty o f M et h o d U se r-fr ie n d ly S p ee d C u t-o ff ac ce p ta b le i n ca rb o n at e, p o o r in ac ce p ta b le d is cr et e v er y s im p le to o s im p le ti m e co n su m in g A N N 8 6 % i n ca rb o n at e; 9 4 % i n n o t ch ec k ed d is cr et e co m p le x d if fi cu lt ra th er t im e co n su m in g B a y es 7 4 % i n ca rb o n at e; 8 1 % i n fu zz y : to o w ea k cr is p : v er y d is cr et e si m p le d if fi cu lt q u ic k D S T ac ce p ta b le v er y g o o d co n ti n u o u s v er y c o m p le x si m p le q u ic k
TABLE III.RECONSTRUCTED COMPARISON MATRICES DUE TO CRITERIA. Comparison matrix of precision with: IR=0.0076<0.10
Cut-off ANN Bayes DST Cut-off [1/2,1,2] [1/5,1/4,1/3] [1/4,1/3,1/2] [1/2,1,2]
ANN [3,4,5] [1/2,1,2] [1,2,3] [3,4,5] Bayes [2,3,4] [1/3,1/2,1] [1/2,1,2] [2,3,4] DST [1/2,1,2] [1/5,1/4,1/3] [1/4,1/3,1/2] [1/2,1,2] weights 0.14 0.43 0.29 0.14
Comparison matrix of generalization with: IR=0.0000<0.10 Cut-off [1/2,1,2] [1/2,1,2] [1/2,1,2] [1/6,1/5,1/4]
ANN [1/2,1,2] [1/2,1,2] [1/2,1,2] [1/6,1/5,1/4] Bayes [1/2,1,2] [1/2,1,2] [1/2,1,2] [1/6,1/5,1/4] DST [4,5,6] [4,5,6] [4,5,6] [1/2,1,2] weights 0.22 0.22 0.22 0.33
Comparison matrix of fuzziness with: IR=6.6×10⁻¹⁶<0.10 Cut-off [1/2,1,2] [1/2,1,2] [1/2,1,2] [1/9,1/9,1/8]
ANN [1/2,1,2] [1/2,1,2] [1/2,1,2] [1/9,1/9,1/8] Bayes [1/2,1,2] [1/2,1,2] [1/2,1,2] [1/9,1/9,1/8] DST [8,9,9] [8,9,9] [8,9,9] [1/2,1,2] weights 0.22 0.22 0.22 0.33
Comparison matrix of Simplicity of Method (SoM) with: IR=0.0632<0.10 Cut-off [1/2,1,2] [6,7,8] [4,5,6] [8,9,9] ANN [1/8,1/7,1/6] [1/2,1,2] [1/4,1/3,1/2] [2,3,4] Bayes [1/6,1/5,1/4] [2,3,4] [1/2,1,2] [4,5,6] DST [1/9,1/9,1/8] [1/4,1/3,1/2] [1/6,1/5,1/4] [1/2,1,2] weights 0.50 0.17 0.33 0.00 Comparison matrix of being user-friendly with IR=0.0161<0.10
Cut-off [1/2,1,2] [4,5,6] [4,5,6] [2,3,4] ANN [1/6,1/5,1/4] [1/2,1,2] [1/2,1,2] [1/4,1/3,1/2] Bayes [1/6,1/5,1/4] [1/2,1,2] [1/2,1,2] [1/4,1/3,1/2] DST [1/4,1/3,1/2] [2,3,4] [2,3,4] [1/2,1,2] weights 0.43 0.14 0.14 0.29
Comparison matrix of speed with: IR=0.0161<0.10 Cut-off [1/2,1,2] [1/4,1/3, 1/2] [1/6,1/5, 1/4] [1/6,1/5, 1/4] ANN [2,3,4] [1/2,1,2] [1/4,1/3,1/2] [1/4,1/3,1/2] Bayes [4,5,6] [2,3,4] [1/2,1,2] [1/2,1,2] DST [4,5,6] [2,3,4] [1/2,1,2] [1/2,1,2] weights 0.00 0.14 0.43 0.43 E. Comparing Criteria
For building comparison matrix of criteria, priority of criteria to each other should be discussed, considering the goal. The authors found it difficult to prioritize precision, generalization ability and fuzziness to each other. We categorized these three criteria as Precision Group (PG). Also, ranking three criteria of simplicity of method, user-friendly and speed was impossible in general. We call these three criteria as Application Group (AG).
Criteria of PG address those metrics showing accuracy of net pay determination methods, i.e. precision shows precision of output in training dataset, generalization reveals precision of output in generalization dataset; here, a well of which the methodology is not trained within. Due to inherit of fuzziness of geosciences data: the fuzzier output, the closer to the reality. Therefore, it is believed that
the degree of fuzziness of output is a measure of accuracy too.
Criteria of AG consist of attributes related to application of methods in pay zone determination. Understanding the science background of the method, applying it simply (user-friendly) and speed of the method. Here, no priority is set in comparing these attributes, because there is no specific goal in general mode. Prioritizing should be done case-based, e.g. in research applications, the easier and simpler the method, the more understandable methodology and path-way. Hence, it is easier to implement it in complex situations. The speed of running the algorithm becomes important in two situations: 1- in real-time industrial logs; 2- in high-dimensional or giant data.
1) General Mode
Based on equity of criteria of PG and its relative importance to AG, equity of criteria of AG too, the below matrix is constructed (Table IV). In the comparison matrix, it is assumed that PG is five times more important than AG. The IR of the matrix is calculated to be zero, i.e. absolutely consistent.
Then, final scores of each alternative are calculated in Table V. Bayes and DST were successful in getting the maximum score of 0.26, then ANN method with 0.25. Cut-off method got the lowest score: 0.23.
2) Industrial Mode
For the case of industrial applications, another comparison is accomplished, and Table IV is constructed. In this table, again PG is considered to be more important than AG due to importance of accurate and precise output. However, fuzziness is not as important as other criteria since most industrial decisions are made in categorical and non-fuzzy situations. In AG, being user-friendly is set prior to speed and simplicity of the methodology because a non-experienced user in the industry should be able in running the algorithm too. Also, speed is prioritized to simplicity of the method for real-time applications.
Final scores in industrial mode show that both DST and ANN have the same scores (Table V). Bayes and cut-off methods were ranked in third and fourth stages, respectively.
3) Research Mode
For research issues, another comparison is fulfilled, and Table IV is constructed. In this table, again PG is considered to be more important than AG due to importance of having accurate and precise outputs. However, fuzziness is considered to be more important than other criteria because non-fuzzy output is completely incompatible with inherit of geosciences datasets. Within AG, simplicity of methodology is set prior to speed and user-friendly, because understanding the methodology fully is really critical for researchers to be able in evaluating complex models analytically. Also, speed is prioritized to user-friendly for coping with big data.
It is due to high importance of fuzziness in research mode (Table IV) that ANN and Bayes have been scored
0.26. DST scored just below ANN and Bayes: 0.25. Finally, cut-off was ranked fourth due to the lowest score: 0.22 (Table VI).
5. CONCLUSION
In this work, four previously developed methodologies for net pay determination were compared to each other within a fuzzy AHP. Six criteria for comparison were: precision, generalization ability, fuzziness, simplicity of methodology (science concepts), user-friendly and speed of the algorithm. First, pairwise comparison was done
between alternatives due to each criterion. Then, these six criteria were compared to each other three times from three perspectives: from the viewpoint of the industry, standpoint of researchers and in general mode. In the last step, net pay identification methods were ranked due to their final scores (Table VI). None of ANN, Bayes and DST methods could be prioritized to each other, ANN is not the best method in general mode, Bayes is not the best in industrial mode and DST is not the best in research mode. However, cut-off method is ranked 3rd in all three
modes. It shows that having different algorithms is not useless at all.
TABLE IV.COMPARISON MATRIX FOR CRITERIA IN DIFFERENT MODES.WEIGHTS ARE CALCULATED AND BROUGHT AT THE BOTTOM OF EACH MATRIX.
Precision Group Application Group
Precision Generalization Fuzziness Simplicity of
Method User-friendly Speed Comparison matrix for general mode with Inconsistency Rate: IR=0.0000
Preciseness [1/2,1,2] [1/2,1,2] [1/2,1,2] [4,5,6] [4,5,6] [4,5,6] Generalization [1/2,1,2] [1/2,1,2] [1/2,1,2] [4,5,6] [4,5,6] [4,5,6] Fuzziness [1/2,1,2] [1/2,1,2] [1/2,1,2] [4,5,6] [4,5,6] [4,5,6] Simplicity of Method [1/6,1/5,1/4] [1/6,1/5,1/4] [1/6,1/5,1/4] [1/2,1,2] [1/2,1,2] [1/2,1,2] User-friendly [1/6,1/5,1/4] [1/6,1/5,1/4] [1/6,1/5,1/4] [1/2,1,2] [1/2,1,2] [1/2,1,2] Speed [1/6,1/5,1/4] [1/6,1/5,1/4] [1/6,1/5,1/4] [1/2,1,2] [1/2,1,2] [1/2,1,2] Weights 0.24 0.24 0.24 0.09 0.09 0.09
Comparison matrix for industrial mode with Inconsistency Rate: IR=0.0448
Preciseness [1/2,1,2] [1/2,1,2] [2,3,4] [8,9,9] [4,5,6] [6,7,8] Generalization [1/2,1,2] [1/2,1,2] [2,3,4] [8,9,9] [4,5,6] [6,7,8] Fuzziness [1/4,1/3,1/2] [1/4,1/3,1/2] [1/2,1,2] [6,7,8] [2,3,4] [4,5,6] Simplicity of Method [1/9,1/9,1/8] [1/9,1/9,1/8] [1/8,1/7,1/6] [1/2,1,2] [1/6,1/5,1/4] [1/4,1/3,1/2] User-friendly [1/6,1/5,1/4] [1/6,1/5,1/4] [1/4,1/3,1/2] [4,5,6] [1/2,1,2] [2,3,4] Speed [1/8,1/7,1/6] [1/8,1/7,1/6] [1/6,1/5,1/4] [2,3,4] [1/4,1/3,1/2] [1/2,1,2] Weights 0.31 0.31 0.19 0.00 0.12 0.06
Comparison matrix for research mode with Inconsistency Rate: IR=0.0600
Preciseness [1/2,1,2] [1/2,1,2] [1/4,1/3,1/2] [2,3,4] [4,5,6] [3,4,5] Generalization [1/2,1,2] [1/2,1,2] [1/4,1/3,1/2] [2,3,4] [4,5,6] [3,4,5] Fuzziness [2,3,4] [2,3,4] [1/2,1,2] [3,4,5] [5,6,7] [4,5,6] Simplicity of Method [1/4,1/3,1/2] [1/4,1/3,1/2] [1/5,1/4,1/3] [1/2,1,2] [3,4,5] [2,3,4] User-friendly [1/6,1/5,1/4] [1/6,1/5,1/4] [1/7,1/6,1/5] [1/5,1/4,1/3] [1/2,1,2] [1/4,1/3,1/2] Speed [1/5,1/4,1/3] [1/5,1/4,1/3] [1/6,1/5,1/4] [1/4,1/3,1/2] [2,3,4] [1/2,1,2] Weights 0.25 0.25 0.31 0.12 0.00 0.06
TABLE V.FINAL SCORES FOR DIFFERENT MODES. P re ci si o n G en er al iz at io n F u zz in es s S im p li ci ty o f M et h o d U se r-fr ie n d ly S p ee d Final Score General mode weights 0.24 0.24 0.24 0.09 0.09 0.09 Cut-off 0.14 0.22 0.22 0.50 0.43 0.00 0.23 ANN 0.43 0.22 0.22 0.17 0.14 0.14 0.25 Bayes 0.29 0.22 0.22 0.33 0.14 0.43 0.26 DST 0.14 0.33 0.33 0.00 0.29 0.43 0.26 Industrial mode weights 0.31 0.31 0.19 0.00 0.12 0.06 Cut-off 0.14 0.22 0.22 0.50 0.43 0.00 0.21 ANN 0.43 0.22 0.22 0.17 0.14 0.14 0.27 Bayes 0.29 0.22 0.22 0.33 0.14 0.43 0.24 DST 0.14 0.33 0.33 0.00 0.29 0.43 0.27 Research mode weights 0.25 0.25 0.31 0.12 0.00 0.06 Cut-off 0.14 0.22 0.22 0.50 0.43 0.00 0.22 ANN 0.43 0.22 0.22 0.17 0.14 0.14 0.26 Bayes 0.29 0.22 0.22 0.33 0.14 0.43 0.26 DST 0.14 0.33 0.33 0.00 0.29 0.43 0.25
TABLE VI.SUMMARY OF RESULTS.
General Mode Industrial Mode Research Mode 1st Bayes, DST ANN, DST ANN, Bayes
2nd ANN Bayes DST
3rd Cut-off Cut-off Cut-off
ACKNOWLEDGMENT
This work has been supported by the Center for International Scientific Studies & Collaboration (CISSC) and French Embassy in Iran through PHC Gundishapur Program. We want to thank Mahta Gholizadeh Ansari for sharing her experience in applying and verifying fuzzy AHP methodology.
REFERENCES
[1] Worthington, P.F.; Cosentino, L.; 2005; “The Role of Cut-offs in
Integrated Reservoir Studies”, SPE Reservoir Evaluation &
Engineering, 8, 276-290.
[2] Worthington, P.F.; 2010; “Net Pay-What Is It? What Does It Do?
How Do We Quantify It? How Do We Use It?”, SPE Reservoir
Evaluation & Engineering, 13, 812-822.
[3] Mahbaz, S.; Sardar, H.; Namjouyan, M.; Mirzaahmadian, Y.; 2011; “Optimization of reservoir cut-off parameters: a case study in SW
Iran”, Petroleum Geoscience, 17, 355-363.
[4] Masoudi, P.; Tokhmechi, B.; Zahedi, A.; Jafari, M.A.; 2011; “Developing a Method for Identification of Net Zones Using Log
Data and Diffusivity Equation”, Journal of Mining and
Environment, 2, 53-60.
[5] Masoudi, P.; Tokhmechi, B.; Ansari Jafari, M.; Zamanzadeh, S.M.; Sherkati, S.; 2012; “Application of Bayesian in determining
productive zones by well log data in oil wells”, Journal of
Petroleum Science and Engineering, 94–95, 47-54.
[6] Masoudi, P.; Tokhmechi, B.; Bashari, A.; Jafari, M.A.; 2012; “Identifying productive zones of the Sarvak formation by
integrating outputs of different classification methods”, Journal of
Geophysics and Engineering, 9, 282-290.
[7] Masoudi, P.; Arbab, B.; Mohammadrezaei, H.; 2014; “Net Pay
Determination by Dempster Rule of Combination, Case Study on
Iranian Offshore Oil Fields”, Journal of Petroleum Science and
Engineering, 123, 78-83, doi: 10.1016/j.petrol.2014.07.014 [8] Masoudi, P.; 2013; “Developing a New Data Fusion Approach for
Fuzzy Net Pay Determination”, Iranian Offshore Oil Company,
Research Project, Tehran, 109p.
[9] Masoudi, P.; 2013; “Identifying Net Pay Zones in Oil Wells by
Artificial Neural Network and Dempster-Shafer Theories”, Iran
patent application 139250140003002836.
[10] Masoudi, P.; Arbab, B.; Mohammadrezaei, H.; 2014; “Net pay
determination by artificial neural network, Case Study on Iranian Offshore Oil Fields”, Journal of Petroleum Science and
Engineering, 123, 72-77, doi: 10.1016/j.petrol.2014.07.007 [11] Masoudi, P.; Tokhmechi, B.; Jafari, M.A.; Moshiri, B.; 2012;
“Application of Fuzzy Classifier Fusion in Determining Productive
Zones in Oil Wells”, Energy Exploration and Exploitation, 30,
403-415.
[12] Ataei, M.; 2010; “Multi-Criteria Decision Making”, Shahrood University of Technology, Iran, 234p., ISBN: 978-964-7637-64-0 (in Farsi).
[13] Saaty, R.W.; 1987; “The analytic hierarchy process-what it is and
how it is used”, Mathematical Modelling, 9, 161-176.
[14] Saaty, T.L.; 2008; “Decision making with the analytic hierarchy
process”, International journal of services sciences, 1, 83-98.
[15] Saaty, T.L.; 1977; “A scaling method for priorities in hierarchical
structures”, Journal of mathematical psychology, 15, 234-281.
[16] Saaty, T.L.; 2003; “Decision-making with the AHP: Why is the
principal eigenvector necessary”, European journal of Operational
Research, 145, 85-91.
[17] Torfi, F.; Farahani, R.Z.; Rezapour, S.; 2010; “Fuzzy AHP to
determine the relative weights of evaluation criteria and Fuzzy TOPSIS to rank the alternatives”, Applied Soft Computing, 10,
520-528.
[18] Kwong, C.; Bai, H.; 2002; “A fuzzy AHP approach to the
determination of importance weights of customer requirements in quality function deployment”, Journal of intelligent manufacturing,
13, 367-377.
[19] Kuo, R. J.; Chi, S.-C.; Kao, S.S.; 2002; “A decision support system
for selecting convenience store location through integration of fuzzy AHP and artificial neural network”, Computers in Industry,
47, 199-214.
[20] Enea, M.; Piazza, T.; 2004; “Project selection by constrained fuzzy
AHP”, Fuzzy Optimization and Decision Making, 3, 39-62.
[21] Kong, F.; Liu, H.; 2005; “Applying fuzzy analytic hierarchy process
to evaluate success factors of e-commerce”, International Journal
of Information and Systems Sciences, 1, 406-412.
[22] Özdağoğlu, A.; Özdağoğlu, G.; 2007; “Comparison of AHP and
fuzzy AHP for the multi-criteria decision making processes with linguistic evaluations”, İstanbul Ticaret Üniversitesi Fen Bilimleri
Dergisi, 6, 65-85.
[23] Cebeci, U.; 2009; “Fuzzy AHP-based decision support system for
selecting ERP systems in textile industry by using balanced scorecard”, Expert Systems with Applications, 36, 8900-8909.
[24] Catak, F.O.; Karabas, S.; Yildirim, S.; 2012; “Fuzzy Analytic
Hierarchy Based DBMS Selection In Turkish National Identity Card Management Project”, International Journal of Information,
2(4), 29-38.
[25] Klir, G.J.; Yuan, B.; 1995; “Fuzzy Sets and Fuzzy Logic, Theory
and Applications”, Prentice Hall New Jersey.
[26] Ataei, M.; 2010; “Fuzzy Multi-Criteria Decision Making”, Shahrood University of Technology, Iran, 234p., ISBN : 978-964-7637-65-7 (in Farsi).
[27] Tummala, V.R.; Wan, Y.W.; 1994; “On the mean random
inconsistency index of analytic hierarchy process (AHP)”,
Computers & industrial engineering, 27, 401-404.
[28] Saaty, T.L.; 1999; “Decision making for leaders: the analytic
hierarchy process for decisions in a complex world (vol.2)”, RWS
![Figure 3. Triangular fuzzy number of [1/2,2,3]](https://thumb-eu.123doks.com/thumbv2/123doknet/14742046.576803/4.892.465.804.400.580/figure-triangular-fuzzy-number-of.webp)