HAL Id: insu-01800799
https://hal-insu.archives-ouvertes.fr/insu-01800799
Submitted on 7 Sep 2020
HAL is a multi-disciplinary open access
archive for the deposit and dissemination of
sci-entific research documents, whether they are
pub-lished or not. The documents may come from
teaching and research institutions in France or
abroad, or from public or private research centers.
L’archive ouverte pluridisciplinaire HAL, est
destinée au dépôt et à la diffusion de documents
scientifiques de niveau recherche, publiés ou non,
émanant des établissements d’enseignement et de
recherche français ou étrangers, des laboratoires
publics ou privés.
New measurements of D/H on Mars using EXES aboard
SOFIA
Thérèse Encrenaz, C. Dewitt, M. Richter, T. Greathouse, Thierry Fouchet,
Franck Montmessin, Franck Lefèvre, Bruno Bézard, S. Atreya, Shohei Aoki, et
al.
To cite this version:
Thérèse Encrenaz, C. Dewitt, M. Richter, T. Greathouse, Thierry Fouchet, et al.. New measurements
of D/H on Mars using EXES aboard SOFIA. Astronomy and Astrophysics - A&A, EDP Sciences,
2018, 612, pp.A112. �10.1051/0004-6361/201732367�. �insu-01800799�
LESIA, Observatoire de Paris, PSL University, CNRS, UPMC, Univ. Denis Diderot, 92195 Meudon, France
2Dept. of Physics, University of California Davis, CA 95616, USA 3SwRI, Div. 15, San Antonio, TX 78228, USA
4LATMOS, IPSL, 75252 Paris Cedex 05, France
5Dept. of Climate and Space Sciences, University of Michigan, Ann Arbor, MI 48109-2143, USA
6Belgium Institute for Space Aeronomy (BIRA-IASB), 1180 Brussels, and Fonds National de la Recherche Scientifique,
1000 Brussels, Belgium
7Kyoto-Sangio University, Kyoto 603-8555, Japan
Received 27 November 2017 / Accepted 21 January 2018
ABSTRACT
The global D/H ratio on Mars is an important measurement for understanding the past history of water on Mars; locally, through condensation and sublimation processes, it is a possible tracer of the sources and sinks of water vapor on Mars. Measuring D/H as a function of longitude, latitude and season is necessary for determining the present averaged value of D/H on Mars. Following an earlier measurement in April 2014, we used the Echelon Cross Echelle Spectrograph (EXES) instrument on board the Stratospheric Observatory for Infrared Astronomy (SOFIA) facility to map D/H on Mars on two occasions, on March 24, 2016 (Ls= 127◦
), and January 24, 2017 (Ls= 304◦
), by measuring simultaneously the abundances of H2O and HDO in the 1383–1391 cm−1range (7.2 µm).
The D/H disk-integrated values are 4.0 (+0.8, −0.6) × Vienna Standard Mean Ocean Water (VSMOW) and 4.5 (+0.7, −0.6) × VSMOW, respectively, in agreement with our earlier result. The main result of this study is that there is no evidence of strong local variations in the D/H ratio nor for seasonal variations in the global D/H ratio between northern summer and southern summer.
Key words. planets and satellites: atmospheres – planets and satellites: individual: Mars
1. Introduction
Measuring the D/H ratio in the Martian atmosphere is impor-tant for estimating the abundance of the early water reservoir on Mars. Indeed, the main mechanism responsible for the deuterium enrichment in the Martian atmosphere is expected to be fraction-ation through differential escape rates of the D and H atoms, the
post-decomposition products of the HDO and H2O molecules
(Owen et al. 1988). The disk-integrated estimate of the D/H ratio must be compared with its value in the past, measured in the most ancient SNC meteorites and/or in clays at the Martian surface (Greenwood et al. 2008;Usui et al. 2012;Mahaffy et al. 2015). For a precise measurement of the present D/H ratio on Mars and in order to avoid any possible seasonal variation, D/H should be, as much as possible, integrated over an entire Martian year.
The HDO molecule was first detected on Mars byOwen et al.
(1988) who inferred, from near-infrared ground-based
observa-tions, a D/H ratio of 6 ± 3 times the terrestrial value (the Vienna
Standard Mean Ocean Water, VSMOW, is equal to 1.556 × 10⁻⁴).
Many observations have been performed since 1988 (Bjoraker
et al. 1989; Krasnopolsky et al. 1997; Encrenaz et al. 2001), all consistent with the first detection. More recently, attempts to map D/H on Mars as a function of latitude and season have been performed byNovak et al.(2011),Villanueva et al.(2015),
Krasnopolsky (2015), Aoki et al. (2015) and Encrenaz et al.
(2016).
In addition to its cosmogonical interest, the measurement of D/H in water on Mars as a function of altitude, location, and season can bring important constraints on the mechanisms
responsible for the sources and sinks of water vapor on the mod-ern day Martian surface and atmosphere. The main mechanism is the vapor pressure isotope effect (VPIE), a fractionation mech-anism associated with condensation/sublimation processes. At
thermodynamical equilibrium, the HDO/H2O ratio in ice,
com-pared with that in the gas phase, is known to be a decreasing function of temperature (Merlivat & Nief 1967). The latitudinal gradient of D/H is constrained by the sublimation of the north-ern polar cap and the condensation in the southnorth-ern polar regions. Thus, due to the general atmospheric circulation, the D/H ratio in water vapor is expected to be highest at the north pole at northern summer solstice, and to increase with the water vapor content
and with the temperature, as predicted byFouchet & Lellouch
(2000) andMontmessin et al.(2005). However,Villanueva et al.
(2015) have reported in some cases strong variations in D/H over the Martian disk, larger than expected by the models. Mapping D/H for different latitude and longitude ranges, and for different seasons, can allow us to test this model.
In April 2014, we used the Echelon Cross Echelle Spectrograph (EXES) instrument on board the Stratospheric Observatory for Infrared Astronomy (SOFIA) facility in order to
observe H2O, HDO, and CO2transitions in the thermal infrared
(7 µm). The D/H ratio was directly derived from the HDO
and H2O line depth ratios. The diameter of Mars was 15
arc-sec, allowing us to build a map of D/H in spite of the poor seeing experienced by the SOFIA telescope (3 arcsec). Our disk-averaged D/H mixing ratio was 4.4 (+1.1, −0.6) × VSMOW, in global agreement with previous observations and model predictions.
A112, page 1 of13
Table 1. Summary of EXES observations of Mars.
Date UT Ls Mars SEP W-long SEP-lat Doppler Doppler Aircraft
of obs. diameter velocity shift altitude
(◦) (arcsec) (◦) (◦) (km s−1) (cm−1) (km)
2014 April 8 05:00–05:30 113 15 160 25 −2.7 +0.0125 11.6
2016 March 24 12:20–12:31 127 11 167 −3 −16.2 +0.075 13.7
2017 January 24 00:50–01:30 304 5.2 357 −25 +11.7 −0.053 11.9
Notes. SEP = sub-Earth point.
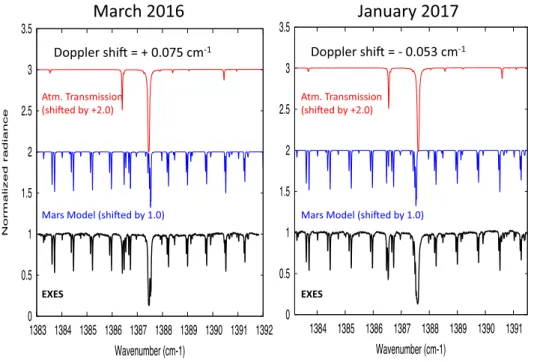
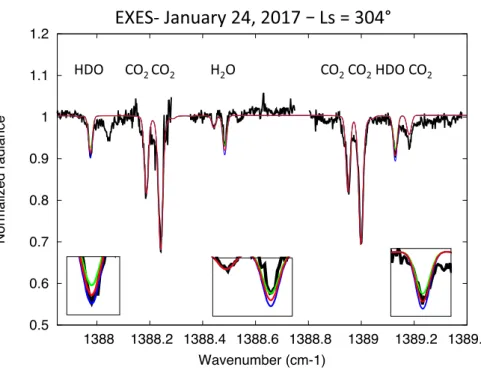
Fig. 1. Thick black line: EXES spec-trum of Mars between 1383.5 and 1391.5 cm−1, integrated over the Martian
disk (normalized radiance). Blue line: nominal synthetic model of the Mar-tian atmosphere (shifted by +1.0). Red: nominal model of the terrestrial opac-ity, for an altitude of 14 km, computed with the EXES model, shifted by +2.0. Left: March 24, 2016, data (Doppler shift: +0.075 cm−1); right: January 24, 2017,
data (Doppler shift: −0.053 cm−1).
We continued our observing campaign with EXES on board SOFIA in order to map D/H on Mars for different longitude ranges and different seasons. A second run was obtained in
March 2016 (Ls = 127◦), when the diameter of Mars was
11 arcsec. A third run was obtained in January 2017 when the
Martian season was opposite (Ls= 304◦). As the diameter of
Mars was only 5.2 arcsec, we did not build a map and we only obtained latitudinal scans of the D/H ratio.
In this paper, we present the analysis of the EXES spectra of Mars recorded during the two flights of EXES on March 24,
2016, and January 24, 2017. Section 2 describes the
observa-tions, the radiative transfer model used in our analysis, and the retrieval of the terrestrial opacity. The results of the two runs are presented in Sect.3and discussed in Sect.4.
2. Observations and modeling
2.1. Observations
The Echelon Cross Echelle Spectrograph (Richter et al. 2010)
was derived from the Texas Echelon Cross Echelle Spectro-graph (TEXES) instrument in operation at the NASA InfraRed
Telescope Facility (Lacy et al. 2002). EXES operates between
4.5 and 28.3 µm (350–2220 cm−1) in three different modes:
high resolution (R = 50 000–100 000), medium resolution
(R = 5000–20 000), and low resolution (R = 1000–3000). We
used the high resolution mode and we selected the 1383–
1391 cm−1 interval (slightly shifted with respect to our first
observation of May 2014), in order to optimize the number
of weak and strong transitions of H2O, HDO, and CO2. At
1387 cm−1, the spectral resolution is better than 0.028 cm−1
(R higher than 50 000).
Table1 summarizes the EXES observations of 2014, 2016,
and 2017. The slit length was 11.8 arcsec and its width was 1.44 arcsec. In March 2016, we used the same strategy as in the case of our 2014 observations. We scanned the slit across the planet with 35 steps of 0.19 arcsec east and 0.69 arcsec north, starting from an offset position of −2.12 arcsec east and −14.56 arcsec north with respect to the planet center. In view of the planet’s size, a single scan was sufficient to cover the whole disk. Two successive scans were recorded, the first between UT 12:20:41.12 and UT 12:25:25.0 and the second between UT 12:25:44.7 and 12:30:27.3. In January 2017, due to the small size of the planet and the poor seeing of the SOFIA telescope, we registered a series of scans close to the center of the planet, and we retrieved D/H as a function of latitude. The geometry of the 2017 observations is described below (Sect.3.2).
The EXES observations of March 2016 and January 2017 show a significant advantage over the previous observation. Indeed, the Doppler shift is higher than the spectral resolution by a factor of 2–3 or more (depending on the actual resolving power, as will be discussed below), so that the Martian water lines (H2O
and HDO) are separated from the terrestrial lines, which was not the case in April 2014; the correction of the terrestrial opacity is thus much easier than in the case of our previous run (the counterpart is of course that Mars is smaller).
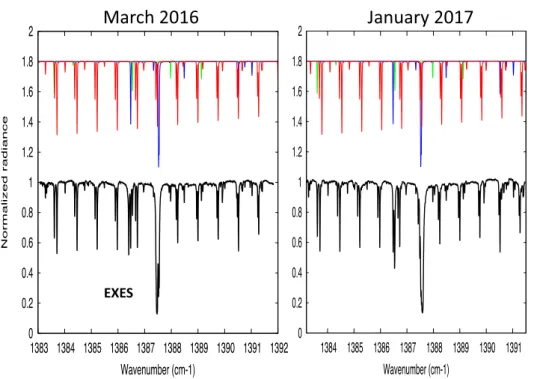
Fig. 2. Thick black line: EXES spec-trum of Mars between 1383.5 and 1391.5 cm−1, integrated over the
Mar-tian disk (normalized radiance). Syn-thetic models of the Martian atmo-sphere: contributions due to CO2 (red),
H2O (300 ppmv, blue), HDO (467
ppbv, green). Left: March 24, 2016, data (Doppler shift: +0.075 cm−1); right:
January 24, 2017, data (Doppler shift: −0.053 cm−1).
Figure1shows the disk-integrated spectrum of Mars between
1383 and 1391 cm−1, for both the March 2016 and the
January 2017 runs. A nominal synthetic spectrum of Mars
including CO2, H2O, and HDO is shown for comparison, with
a standard spectrum of the terrestrial atmospheric transmission, calculated for an altitude of 14 km. Because the Doppler shift has an opposite sign for both runs, the terrestrial absorption lines are shifted in opposite directions versus the Martian spectrum. As a result, the shape of the EXES spectrum is different in the
two cases, especially in the 1386–1388 cm−1range where strong
telluric features appear.
Figure2 shows the two EXES spectra of March 2016 and
January 2017, compared to our nominal model of Mars showing
contributions by CO2, H2O, and HDO. It can be seen that the
spectrum of Mars is dominated by a regular series of CO2
dou-blets. Between 1386 and 1388 cm−1, two strong terrestrial H2O
absorption features, centered around 1386.5 and 1387.5 cm−1,
are superimposed on the Mars spectrum and dominate the EXES
spectrum. In contrast, between 1387.8 and 1391.5 cm−1, weak
isolated lines of H2O and HDO appear in the Mars spectrum,
well separated from their terrestrial counterparts. We thus use
the 1386–1388 cm−1range to model the terrestrial opacity, and
we use it to correct the EXES spectrum over the whole
spec-tral range. Then, we select the 1387.8–1391.4 cm−1range for our
analysis of the H2O and HDO mixing ratios.
2.2. Atmospheric modeling
To model the Martian synthetic spectrum, we used the radiative transfer code developed for our analysis of the TEXES data of Mars (Encrenaz et al. 2004,2015), and also used for the analysis
of our EXES data of April 2014 (Encrenaz et al. 2016).
Spectro-scopic data were extracted from the GEISA molecular database (Jacquinet-Husson et al. 2008). As a first step, for both datasets, we used the disk-integrated spectra of Mars (for a maximum signal-to-noise ratio) in order to estimate the contribution of the terrestrial atmospheric opacity. In the case of the March 2016 data, we used a surface temperature of 255 K, a surface pres-sure of 6.0 mbar, and temperatures of 230, 200, 170, and 140 K at altitude levels of 0, 10, 20, and 40 km respectively, with an
isothermal profile above 40 km. This profile, close to that
pre-dicted by the European Mars Climate Database (EMCD;Forget
et al. 1999), is the same as the one we used for our data of April 2014, which corresponded to a similar season and the same longitude range. In the case of the January 2017 data, also in agreement with the EMCD, we used a surface temperature of 250 K, a surface pressure of 5.5 mbar, and temperatures of 230, 220, 195, and 145 K at altitude levels of 0, 10, 20, and 40 km respectively, with an isothermal profile above 40 km.
As in our previous analysis, for both datasets, we used the CO2
lines to determine the spectral resolution of our data. The best fit of the line width was obtained for a Gaussian profile with a
FWHM of 0.022 cm−1(R = 63 000) for the March 2016 data, and
0.020 cm−1(R= 69 000) for the January 2017 data (Fig.3). As in
our previous analysis, we note that this profile does not perfectly fit the EXES lines, which show broader wings than the Gaussian profile, while the central core tends to be narrower. As shown
in our earlier analysis (Encrenaz et al. 2016), the sinc2
func-tion is very close to the Gaussian curve and does not improve the fit with our data. We adopted these Gaussian profiles and these resolving powers as a compromise to minimize the discrep-ancies between the data and the model. The resolving powers adopted in this study are actually slightly degraded with respect to the theoretical instrumental function of the EXES instrument. Part of the explanation comes from the fact that in order to get
the best signal-to-noise ratio for the H2O and HDO retrievals,
we are using disk-integrated spectra for which the FWHM is slightly broader than for spectra corresponding to single pixels. This effect might be due to a very small shift of the wavenumber scale as the slit moves over the planet.
As in our previous analyses, we directly determine the
mix-ing ratios of H2O and HDO with respect to CO2 by making
the ratio of the H2O or HDO line depth divided by the CO2
line depth. In our previous analyses of the TEXES spectra of
Mars (Encrenaz et al. 2015), we showed that the mixing ratio
of two atmospheric species can be directly estimated from the ratio of their line depths provided that the lines are weak, with line depths less than about 10%. The validity of this method also requires that the two species be homogeneously mixed. We applied this method for the analysis of the EXES data
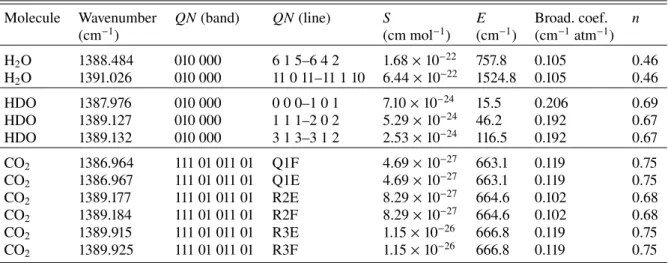
Table 2. Spectroscopic parameters of the transitions used for the HDO and CO2mapping and for the spectral fits (n is the temperature dependence
factor of the broadening coefficient).
Molecule Wavenumber QN(band) QN(line) S E Broad. coef. n
(cm−1) (cm mol−1) (cm−1) (cm−1atm−1) H2O 1388.484 010 000 6 1 5–6 4 2 1.68 × 10⁻²² 757.8 0.105 0.46 H2O 1391.026 010 000 11 0 11–11 1 10 6.44 × 10⁻²² 1524.8 0.105 0.46 HDO 1387.976 010 000 0 0 0–1 0 1 7.10 × 10⁻²⁴ 15.5 0.206 0.69 HDO 1389.127 010 000 1 1 1–2 0 2 5.29 × 10⁻²⁴ 46.2 0.192 0.67 HDO 1389.132 010 000 3 1 3–3 1 2 2.53 × 10⁻²⁴ 116.5 0.192 0.67 CO2 1386.964 111 01 011 01 Q1F 4.69 × 10⁻²⁷ 663.1 0.119 0.75 CO2 1386.967 111 01 011 01 Q1E 4.69 × 10⁻²⁷ 663.1 0.119 0.75 CO2 1389.177 111 01 011 01 R2E 8.29 × 10⁻²⁷ 664.6 0.102 0.68 CO2 1389.184 111 01 011 01 R2F 8.29 × 10⁻²⁷ 664.6 0.102 0.68 CO2 1389.915 111 01 011 01 R3E 1.15 × 10⁻²⁶ 666.8 0.119 0.75 CO2 1389.925 111 01 011 01 R3F 1.15 × 10⁻²⁶ 666.8 0.119 0.75
Fig. 3.Top(shifted by +0.5): EXES spectrum of Mars between 1388.05 and 1388.35 cm−1, integrated over the Martian disk (thick black line),
recorded with EXES on March 24, 2016 (Ls = 127◦
, normalized radiance). The synthetic model of the Martian atmosphere with the CO2 contribution (red curve) corresponds to a Gaussian profile with
a FWHM of 0.022 cm−1. Bottom: EXES spectrum recorded on
Jan-uary 24, 2017, over the slit and summed over the six scans. The synthetic model corresponds to a Gaussian profile with a FWHM of 0.020 cm−1.
obtained in May 2014 (Encrenaz et al. 2016). However, we must
be aware of the limitations of this method. First, if the water is concentrated just above the surface, which may occur in
partic-ular near aphelion, H2O and HDO may not be homogeneously
mixed. Second, when the airmass is higher than 5, the
depar-ture from linearity may exceed 10% (Encrenaz et al. 2015). This
means that results obtained near the limb should be considered with caution.
In the case of the D/H retrieval, the determination of the
H2O and HDO volume mixing ratios, using the H2O/CO2 and
HDO/CO2 line depth ratios, is made to check the consistency
of our results with respect to Global Climate Models and other observations. To retrieve the D/H ratio, we simply use the
HDO/H2O line depth ratio (taking into account that [HDO/H2O]
= 2 × D/H). The advantage of using the HDO/H2O line depth
ratio directly is that no assumption is required on the precise thermal structure of the atmosphere since there is no need to
use CO2 transitions (Encrenaz et al. 2016). Table 2 describes
the spectroscopic parameters of the transitions used in our
calculations, for the March 2016 and January 2017 runs. It can
be noted that some of the HDO and CO2lines are actually very
close doublets (their separation is within the spectral resolution of the EXES data).
2.3. Retrieval of the terrestrial atmospheric transmission In order to obtain a precise correction of the terrestrial contribu-tion in the EXES spectra over the whole spectral range, we model the terrestrial atmosphere and we adjust the temperature, pres-sure, and water content in the Earth’s atmosphere to obtain the
best fit of the strong terrestrial absorption at 1386–1388 cm−1.
This method can be used because in this spectral range the con-tribution of the Martian spectrum is very minor compared to the terrestrial absorption.
Two main factors determine the shape of the terrestrial
atmospheric transmission in the H2O and HDO absorptions:
the pressure level above which the calculation is made, and the water vertical distribution above this level. We calculated a grid of spectra for different values of these parameters, and we multiplied these transmission curves with our nominal syn-thetic model of Mars to obtain the best fit of the disk-integrated
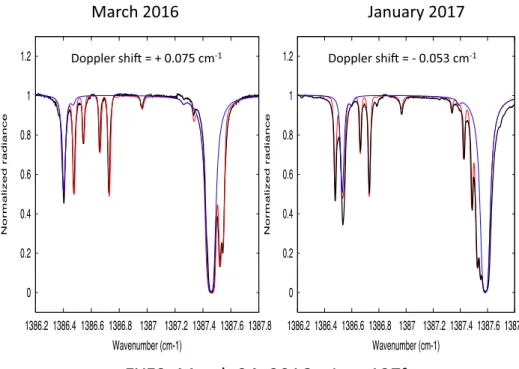
EXES spectrum of Mars. The best-fit transmission curve (Fig.4)
corresponds to an altitude level of 14 km (consistent with the flight altitude of SOFIA in March 2016) and a pressure of 0.11 bar at this level. The water mixing ratio ranges from
3 × 10⁻⁵ at the first level to 5 × 10⁻⁶ 5 km above this level,
in agreement with standard models of the terrestrial atmosphere (Jimenez et al. 2013). In order to fit the observed spectrum
at the center of the 1387.5 cm−1 H
2O band where the
ter-restrial transmission is expected to be null, we removed the offset due presumably to scattered light or to incomplete sky subtraction (the same effect was observed in our April 2014 observation). It can be seen that our retrieved terrestrial trans-mission curve leads to a good overall agreement with the EXES disk-integrated spectrum for the March 2016 and January 2017 runs.
3. Results
3.1. The March 2016 observations
We first used the disk-integrated EXES spectrum of Mars to
Fig. 4. Thick black line: EXES disk-integrated spectrum of Mars. Blue: best-fit atmospheric transmission over an alti-tude of 14 km. Red: best-fit model of Mars, multiplied by the terrestrial trans-mission, for comparison with the EXES spectrum. Left: March 24, 2016, data; right: January 24, 2017, data. It can be seen that the terrestrial transmission curve is the same for both runs.
Fig. 5.Thick black line: the EXES disk-integrated spectrum of Mars recorded on March 24, 2016 in two H2O transitions.
Left: the 1388.5 cm−1 transition; right:
the 1391.0 cm−1transition. Models: H 2O
= 240 ppmv (green), 280 ppbv (red, best fit), 335 ppbv (blue).
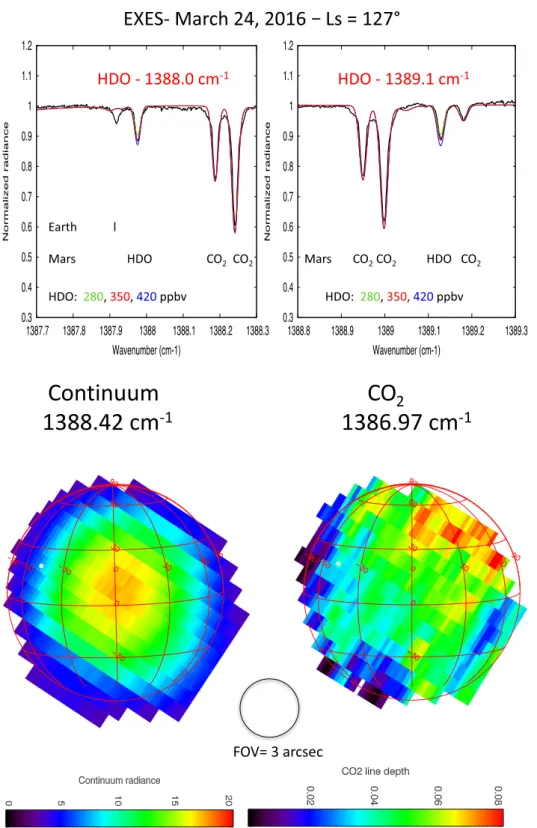
ratios. Figure 5 shows two H2O transitions, at 1388.484 and
1391.026 cm−1, respectively. Figure 6 shows two HDO
transi-tions, at 1387.976 and 1389.13 cm−1, respectively. In both cases,
it can be seen that the EXES disk-integrated spectrum is
brack-eted by the two extreme models shown in the figures (H2O =
240–335 ppmv, HDO = 280–420 ppbv). Considering that these extreme values correspond to a peak-to-peak uncertainty of 3 σ,
we derive from Fig.5a best-fit H2O mean volume mixing ratio
of 280 (+37, −27) ppmv, and we infer from Fig.6a best-fit mean
HDO mixing ratio of 350 (±47) ppbv. As pointed out above,
these weak transitions of H2O and HDO are well separated from
their terrestrial counterparts, so – in contrast with the April 2014 analysis – there is no uncertainty coming from the correction of the terrestrial atmospheric transmission. Taking into account that two lines of each species are used, we derive a disk-integrated D/H mixing ratio of 4.0 (+0.8, −0.6) × VSMOW, in agreement with our result of April 2014.
Figure 7 shows a map of the continuum radiance of Mars
at 1388.42 cm−1 and a map of the line depth of a weak CO2
transition at 1386.97 cm−1. In the absence of absolute
calibra-tion available on the EXES instrument for our Mars data, we have not converted the continuum radiance map into a brightness temperature map.
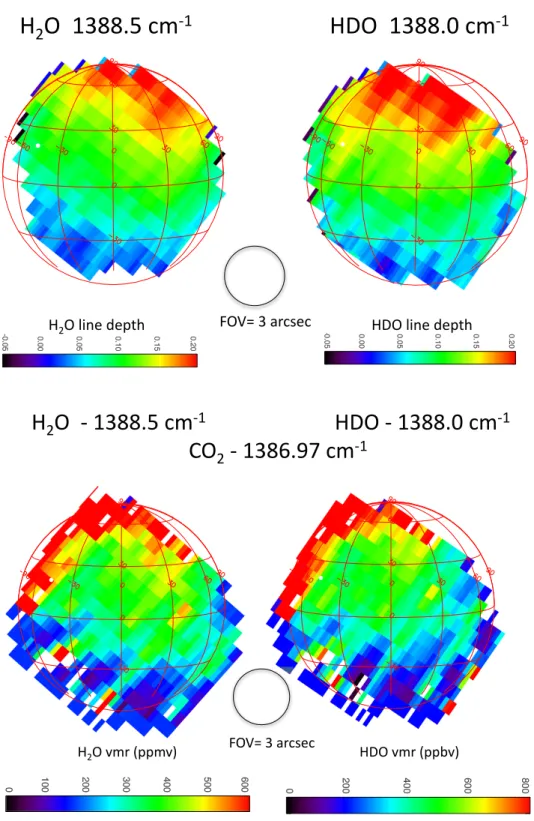
Figure 8 shows the maps of the line depths of H2O at
1388.5 cm−1and HDO at 1388.0 cm−1, as observed on March 24,
2016 (Ls= 127◦). The H2O and HDO line depth maps show
similar behaviors with a distinct enhancement around the north pole, as expected from the EMCD predictions during
north-ern summer (Montmessin et al. 2005). Using our radiative
transfer model and measuring the H2O/CO2 and HDO/CO2
line depth ratios (ldr) for different values of the H2O and
HDO volume mixing ratios (vmr), we converted these line
depths into volume mixing ratios of H2O and HDO, using
Fig. 6.Thick black line: the EXES disk-integrated spectrum of Mars recorded on March 24, 2016 in two HDO transi-tions. Left: the 1388.0 cm−1 transition;
right: the 1389.1 cm−1 transition.
Mod-els: HDO = 280 ppmv (green), 350 ppbv (red, best fit), 420 ppbv (blue).
Fig. 7. Left: continuum radiance map of the Martian disk recorded at 1388.42 cm−1 on March 24, 2016
(Ls= 127◦
), with EXES. Right: map of the line depth of a weak CO2 transition
at 1386.97 cm−1. The white dot
corre-sponds to the position of the subsolar point. The spatial resolution is limited by the pointing accuracy of the SOFIA telescope. The field of view is indicated by a circle at the center of the figure.
relationships derived from the best-fit model of the disk-integrated spectrum:
vmr(H2O)(ppmv) = 280.0/1.717 × ldr(H2O/CO2),
vmr(HDO)(ppbv) = 350.0/1.833 × ldr(HDO/CO2).
The latitudinal trend shown in Fig.9is qualitatively
consis-tent with the EMCD predictions for northern summer.
Figure 10 shows the D/H ratio on Mars, directly inferred
from the HDO/H2O line depth ratio, using the following
relationship:
D/H = 0.5 × vmr(HDO)/vmr(H2O)
or
D/H (VSMOW units) = 4.0/1.07 × ldr(HDO/H2O).
Figure 10 shows the two D/H maps of April 2014 and
March 2016 for comparison. The two maps are in good agree-ment, as expected in view of the similarities in season and lon-gitude ranges for both observing runs. Our map of March 2016 is of lower quality than the earlier one because of the smaller size of the planet and the limited spatial resolution of the SOFIA telescope.
In order to confirm these results, we isolated two areas along
Fig. 8. Maps of the line depths for H2O at 1388.5 cm−1 (left) and HDO
at 1388.0 cm−1 (right), recorded with
EXES on March 24, 2016 (Ls= 127◦
). The white dot corresponds to the position of the subsolar point. The field of view is indicated by a circle at the center of the figure.
Fig. 9. Maps of the volume mix-ing ratio of H2O, derived from the
1388.5 cm−1 transition (left), and the
volume mixing ratio of HDO, derived from the 1388.0 cm−1 transition (right),
recorded with EXES on March 24, 2016 (Ls = 127◦
). The CO2 transition at
1386.97 cm−1is used in both cases. The
white dot corresponds to the position of the subsolar point. The field of view is indicated by a circle at the center of the figure.
the north limb and from 30◦S down to the south limb. We
note that some fluctuations are present in the continuum, prob-ably of instrumental origin. It can be seen that these continuum fluctuations are not visible on disk-integrated spectra, but appear on localized spectra, especially when high airmasses are con-sidered; in these regions, the blurring due to the poor seeing of the SOFIA telescope is most severe. As in our previous anal-ysis, for comparison with the synthetic models, we removed these fluctuations by assuming, for each transition, a straight line between the continuum taken on each side of the transi-tion. We also noticed that continuum fluctuations were stronger toward the high frequency range of the spectra; for this reason,
we removed the 1391.0 cm−1H
2O line from the analysis of the
localized spectra. We thus kept the 1388.5 cm−1H2O line and the
two HDO lines, at 1388.0 and 1389.1 cm−1respectively (Figs.10
and11).
To model the synthetic spectra, we adopted atmospheric parameters derived from the EMCD for the corresponding
loca-tion and season. Figures11and12show the best fits obtained for
the H2O and HDO mixing ratios in the northern and southern
region, respectively. The following mixing ratios are inferred:
Disk-integrated spectrum: H2O = 280 (+37, −27) ppmv,
HDO = 350 (±47) ppbv, D/H = 4.0 (+0.8, −0.6) × VSMOW (1σ error bars);
Fig. 10. Maps of the D/H ratio on Mars, inferred from the EXES data recorded on April 8, 2014 (Ls = 113◦
, left), and March 24, 2016 (Ls= 127◦
, right). The white dot corresponds to the position of the subsolar point. For each observation, the field of view is indicated by a circle at the center of the figure.
Fig. 11. Black line: spectrum of Mars recorded on March 24, 2016, in the north-ern region between 1387.9 and 1389.3 cm−1.
Models: H2O = 250 ppmv, HDO = 400 ppbv
(green); H2O = 375 ppmv, HDO = 550 ppbv
(red, best fit); H2O = 500 ppmv, HDO =
700 ppbv (blue). The surface pressure is 6 mb and the surface brightness temperature is 255 K. The temperature profile is the same as that used for the integrated spectrum (see Sect.2.2). The airmass is 2.0.
Northern region: H2O = 375 (±125) ppmv, HDO = 550
(±100) ppbv, D/H = 4.7 (+2.4, −1.3) × VSMOW (1σ error bars);
Southern region: H2O = 125 (+125, −67) ppmv, HDO = 150
(+100, −50) ppbv, D/H = 3.8 (+2.8, −2.0) × VSMOW (1σ error bars).
We note that in the southern region, the H2O and HDO
line depths are too small for a reliable value of D/H to be determined. We note also that, surprisingly, the two HDO tran-sitions do not fit the same HDO volume mixing ratio; the
observed 1389.1 cm−1transition appears slightly weaker than the
1388.0 cm−1 transition compared with the EMCD predictions.
We have no explanation for this discrepancy, which does not appear on the other EXES spectra.
3.2. The January 2017 observations
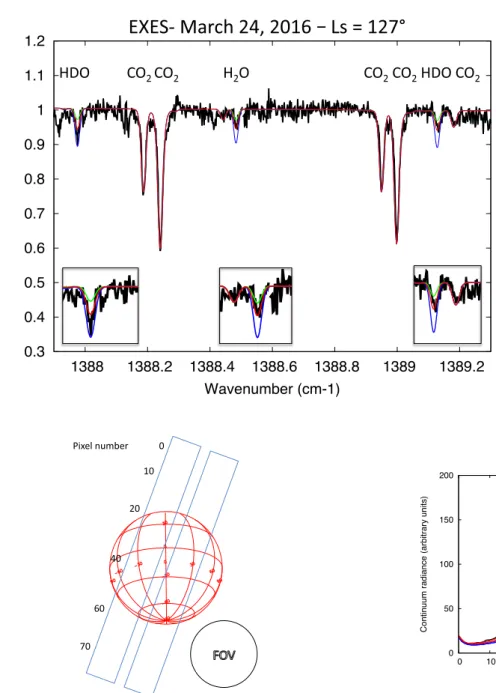
Figure13shows the geometry of the observation performed on
January 24, 2017. A first (interrupted) scan was recorded at 0:50 UT, along the disk center from north to south, with a polar angle of 139◦. Then, six successive scans of about 5 minutes each were recorded between 0:55 and 01:30 UT, with a shift of ±1 arcsec with respect to the disk center.
Figure 14 shows the integrated radiance over the
1383–1391 cm−1 for each of the seven scans, as a function
of the pixel number. The latitude coverage of the observations
ranges from about 45◦N to 90◦S. The longitude coverage ranges
from 270◦W to 330◦W. However, there is a considerable
Fig. 12. Black line: spectrum of Mars recorded on March 24, 2016, in the south-ern region between 1387.9 and 1389.3 cm−1.
Models: H2O = 67 ppmv, HDO = 75 ppbv
(green); H2O = 125 ppmv, HDO = 150 ppbv
(red, best fit); H2O = 250 ppmv, HDO = 300
ppbv (blue). The surface pressure is 5 mb and the surface brightness temperature is 235 K. The temperature profile is the same as that used for the integrated spectrum (see Sect.2.2). The airmass is 2.0.
Fig. 13. Geometry of the EXES observation of January 24, 2017. The diameter of Mars is 5.2 arcsec. The longitude and latitude of the sub-Earth point are 357◦
W and 26◦
S, respectively. The longitude and latitude of the subsolar point are 321◦
W and 21◦
S, respectively. The two positions of the slit, at an equal distance from the disk center, are sepa-rated by 2 arcsec. The field of view is indicated on the right side of the figure.
resolution of the SOFIA telescope. Since the diameter of Mars is only 5.2 arcsec, this limitation converts into an uncertainty
of about 60◦ in longitude for each scan. The latitude coverage
can be determined by the shape of the continuum radiance that peaks near the latitude of the sub-Earth point at 25◦S. Figure14
shows that all scans show a comparable value of the maximum
radiance around pixel 40 (presumably 25◦S latitude). This result
is surprising, as we would have expected a higher radiance near
the subsolar point at a longitude of about 330◦W (on the right
side of the figure). We interpret this result as being due to the large uncertainty in the longitude location of the scans.
We analyzed each scan individually, and we performed in
each case the analysis of the H2O and HDO mixing ratios. We
Fig. 14.EXES radiance, integrated over the 1383–1391 cm−1range, as a
function of the pixel number along the slit. Black: first scan (interrupted) recorded along the disk center (357◦
W longitude). Red: “left” scans (centered around 15◦
W longitude). Blue: “right” scans (centered around 345◦
W longitude). There is considerable uncertainty on the position of the slit with respect to the Martian disk.
find no significant difference between the results obtained in
the “left” scans (30◦W longitude) and the “right” scans (330◦W
longitude). In view of the considerable uncertainty in the longi-tude determination, we summed all the scans together to perform
an analysis of H2O, HDO, and D/H as a function of latitude
only.
We first consider the slit-integrated spectrum. Figure 15
shows the two weak transitions of H2O at 1388.5 and
1391.0 cm−1 used for our analysis. The best fit is obtained for
a H2O volume mixing ratio of 250 ± 34 ppmv. Figure16shows
the two HDO transitions at 1388.0 and 1389.1 cm−1. We derive
a HDO mixing ratio of 350 ± 47 ppbv. Taking into account the two lines of each species, we derive for the January 2017 data a D/H ratio of 4.5 (+0.7, −0.6) × VSMOW. We note that, as in the case of the March 2016 data, the Martian lines are well
Fig. 15. Thick black line: EXES slit-integrated spectrum of Mars recorded on January 24, 2017, in two weak H2O
transitions. Left: 1388.5 cm−1transition;
right: 1391.0 cm−1 transition. Models:
H2O = 240 ppmv (green), 280 ppmv (red,
best fit), 335 ppmv (blue).
Fig. 16. Thick black line: EXES slit-integrated spectrum of Mars recorded on January 24, 2017, in two weak HDO transitions. Left: 1388.0 cm−1transition;
right: 1389.1 cm−1 transition. Models:
HDO = 280 ppmv (green), 350 ppbv (red, best fit), 420 ppbv (blue).
Fig. 17. Line depths of the CO2 (1389.2 cm−1, black), H2O
(1388.5 cm−1, blue), and HDO (1388.0 and 1389.1 cm−1, mean value,
red) as a function of latitude, integrated over the six scans. Data are from January 24, 2017.
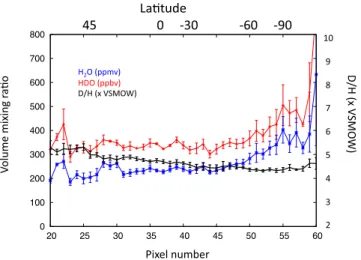
Fig. 18. Volume mixing ratios of H2O (in ppmv, blue) and HDO (in
ppbv, red), using the line depth ratios of H2O/CO2(blue) and HDO/CO2
(red) for the transitions shown in Fig.17. Black: the D/H ratio inferred from the HDO/H2O line depth ratio. The data are shown as a
func-tion of latitude, integrated over the six scans. Data are from January 24, 2017.
recorded on January 24, 2017, in the north-ern region between 1387.9 and 1389.4 cm−1,
recorded on January 24, 2017. Models: H2O
= 200 ppmv, HDO = 280 ppbv (green); H2O
= 250 ppmv, HDO = 350 ppbv (red, best fit); H2O = 300 ppmv, HDO = 420 ppbv (blue).
The surface pressure is 7.5 mb and the surface brightness temperature is 212 K. The temper-atures at altitudes of 0, 10, 20, and 40 km are 205, 202, 200, and 185 K, respectively. The airmass is 2.0.
separated from the terrestrial counterparts, so that there is no contamination from terrestrial atmospheric opacity.
We now consider the variation in the H2O and HDO
vol-ume mixing ratios as a function of latitude. After trying different
sets of lines, we selected the CO2 transition at 1389.2 cm−1,
the H2O line at 1388.5 cm−1, and the two HDO lines at 1388.0
and 1389.1 cm−1 which give the best signal-to-noise ratios
for the line depth ratios. Figure 17 shows the line depths of
the CO2 transition, the H2O transition, and the mean value
of the two HDO transitions. These data are summed over the six scans and the error bars are calculated from the disper-sion of these values between the scans. We note that they do not correspond to the instrumental noise, but they reflect true
variations in the CO2, H2O, and HDO line depths as
differ-ent locations of the planet are observed along the differdiffer-ent scans.
Figure18 shows the H2O and HDO volume mixing ratios
and the D/H ratio inferred from the line depths shown in Fig.16,
determined using the best fits shown in Figs.15 and16for the
slit-integrated spectra. The following relationships are used:
vmr(H2O)(ppmv) = 250.0/1.7 × ldr(H2O/CO2),
vmr(HDO)(ppbv) = 350.0/1.53 × ldr(HDO/CO2),
D/H (VSMOW units) = 4.5/1.11 × ldr(HDO/H2O).
As in the case of Fig.17, the error bars are calculated from
the dispersion of the six scans. They are significantly lower than in Fig.17, which illustrates that the H2O and HDO mixing ratios,
and even more D/H, are the same for all scans and show little dependence upon topographic variations. It must be noted that these error bars do not include uncertainties associated with the radiative transfer model. They are thus significantly smaller than the final error bars inferred from the spectral fittings (see Figs.19
and20).
It is interesting to note that the D/H ratio shows an increas-ing trend from southern toward northern latitudes, while – as
predicted by the EMCD during southern summer (Ls= 304◦) –
the H2O and HDO volume mixing ratios both show maximum
values near high southern latitudes. This trend is not predicted
by global models of the D/H distribution as a function of
lati-tude and season (Montmessin et al. 2005). We have checked that
this trend is observed individually on all six scans, and also using both HDO transitions individually.
In order to check the consistency of our results, and in par-ticular the evolution of D/H with latitude, we have isolated two areas, in the northern part (pixels 20 to 25, 30◦N–45◦N latitudes)
and the southern part (pixels 55 to 60, 60◦S–90◦S latitudes)
of the slit. Figures 19 and 20 show the corresponding EXES
spectra between 1387.8 and 1389.4 cm−1 (summed over the six
scans), compared to synthetic models. As in the case of the 2016 data, in both cases we used the atmospheric parameters inferred from the EMCD for the corresponding location and season (Forget et al. 1999). In the case of the northern area (Fig.19), the CO2lines are significantly weaker than in the slit-integrated
spectrum, which requires a thermal profile close to isothermal, as also predicted by the EMCD. Our results are summarized below:
Disk-integrated spectrum: H2O = 250 (±34) ppmv, HDO =
350 (±47) ppbv, D/H = 4.5 (+0.7, −0.6) × VSMOW (1σ error bars);
Northern region: H2O = 250 (±50) ppmv, HDO = 350 (±47)
ppbv, D/H = 4.5 (+1.3, −0.9) × VSMOW (1σ error bars);
Southern region: H2O = 350 (±50) ppmv, HDO = 490 (±47)
ppbv, D/H = 4.5 (+0.9, −0.7) × VSMOW (1σ error bars). In the case of the northern region, we infer the same results as in the case of the slit-integrated spectrum. In the case of the
southern area, the best-fit values of the H2O and HDO vmrs
are significantly higher; both conclusions are consistent with the variations shown in Fig.18. It can be seen that the error bars on D/H are too large for us to confirm the reality of a variation of the D/H ratio over latitude.
4. Discussion
Our result of March 2016 can first be compared to our ear-lier EXES observation of April 2014, which was obtained in a
Fig. 20.Black line: spectrum of Mars recorded on January 24, 2017, in the southern region between 1387.9 and 1389.4 cm−1). Models:
H2O = 200 ppmv, HDO = 280 ppbv (green);
H2O = 250 ppmv, HDO = 350 ppbv (purple);
H2O = 350 ppmv, HDO = 420 ppbv (blue);
H2O = 350 ppmv, HDO = 490 ppbv (red, best
fit). The surface pressure is 5.0 mb and the sur-face temperature is 260 K. The temperatures at altitudes of 0, 10, 20, and 40 km are 235, 215, 190, and 165 K, respectively. The airmass is 2.0.
Fig. 21. Spatial distribution of the H2O mixing ratio on Mars for
Ls= 127◦
and the geometry of the EXES observation of March 2016, as derived from the EMCD.
comparable season (early northern summer) on similar
longi-tude and latilongi-tude ranges. The H2O and HDO abundances and
their spatial distributions over the disk are in good agreement for both datasets, as are their disk-averaged values. In both
cases, the H2O and HDO abundances indicate a clear
max-imum at high northern latitude, as expected during northern
summer. Figure 21 shows the expected H2O mixing ratio for
Ls= 127◦and the geometry corresponding to our observations
of March 2016, as predicted by the EMCD. The agreement is satisfactory, except at the north pole where the EMCD predicts a very high water content; this discrepancy has been pointed out
previously (Encrenaz et al. 2015,2016). Our disk-averaged D/H
value of March 2016 is also consistent with our earlier value
[D/H = 4.4 (+1.1, −0.6) × VSMOW, Ls = 113◦], within the
range of uncertainty. Figures11and12seem to indicate a slight
increase in D/H toward northern latitudes, although this effect is not clearly visible in Fig.10. The absence of strong latitudinal variation in D/H is also consistent with the EMCD predictions for Ls= 127◦(Montmessin et al. 2005).
Fig. 22.Spatial distribution of the H2O mixing ratio on Mars for Ls=
304◦
and the geometry of the EXES observation of January 2017, as derived from the EMCD.
In the case of the January 2017 run, the disk of Mars is observed under opposite conditions, both for the season (south-ern summer) and for the longitude and latitude ranges. The
H2O and HDO volume mixing ratios indicate a clear maximum
toward high southern latitudes, as expected from the EMCD (Fig. 22). It is interesting to note that the slit-integrated value (which actually corresponds to a longitude range probably as
large as 90◦ in view of the pointing uncertainty) is very close
to our value of April 2014. This result is also consistent with the
EMCD predictions ofMontmessin et al.(2005). However, we do
not observe an enhancement of D/H at high southern latitudes, as expected from the models. In contrast, the variations of D/H with latitude instead indicate an opposite trend; however, we caution the reader that it is a tentative conclusion in view of the large uncertainty in our results.
Our globally averaged results from the two datasets are also in good overall agreement with the mean D/H mixing
ratios derived by Aoki et al. (2015) who found D/H = 4.1
note, however, that this comparison is limited by the poor spatial resolution of our observations. In the future, we plan to com-plete this program by observing Mars with EXES during other seasons and with a larger angular diameter.
Acknowledgements. This article is based on observations made with the NASA/DLR Stratospheric Observatory for Infrared Astronomy (SOFIA). SOFIA is jointly operated by the Universities Space Research Association, Inc. (USRA), under NASA contract NAS2-97001, and the Deutsches SOFIA Institut (DSI) under DLR contract 50 OK 0901 to the University of Stuttgart. Financial sup-port for this work was provided by NASA. We wish to thank the SOFIA and EXES staff for the support of EXES observations. T.K.G. acknowledges sup-port of NASA Grant NNX14AG34G. T.E. and B.B. acknowledge supsup-port from CNRS and Programme National de Planétologie. T.F. acknowledges support from UPMC. T.E. acknowledges support from Jet Propulsion Laboratory as a Distinguished Visiting Scientist.
Jimenez, C., Gulkis, S., Beaudin, G., et al. 2013,Planet. Space Sci., 82, 99 Krasnopolsky, V. A. 2015,Icarus, 257, 377
Krasnopolsky, V. A., Bjoraker, G. L., Mumma, M. J., & Jenning, D. E. 1997,J. Geophys. Res., 102, 6525
Lacy, J. H., Richter, M. J., Greathouse, T. K., et al. 2002,PASP, 114, 153 Mahaffy, P. R., Webster, C. R., Stern, J. C., et al. 2015,Science, 347, 412 Merlivat, L., & Nief, G. 1967,Tellus, 19, 122
Montmessin, F., Fouchet, T., & Forget, F. 2005,J. Geophys. Res., 110, E03006 Novak, R. E., Mumma, M. J., & Villanueva, G. I. 2011,Planet. Space Sci., 59, 163 Owen, T., Maillard, J.-P., de Bergh, C., & Lutz, B. L. 1988,Science, 240, 1767 Richter, M. J., Ennico, K. A., Mc Kelvey, M. E., & Seifhart, A. 2010, inProc.
SPIE, 7735 “Ground-based and Airborne Instrumentation for Astronomy –
III”, San Diego, CA, USA, June 2010, eds. I. S. McLean, S. Ramsay, & H.
Takami
Usui, H., Alexander, C. M. O. D., Wang, J. et al. 2012,Earth Planet. Sci. Lett., 357, 119